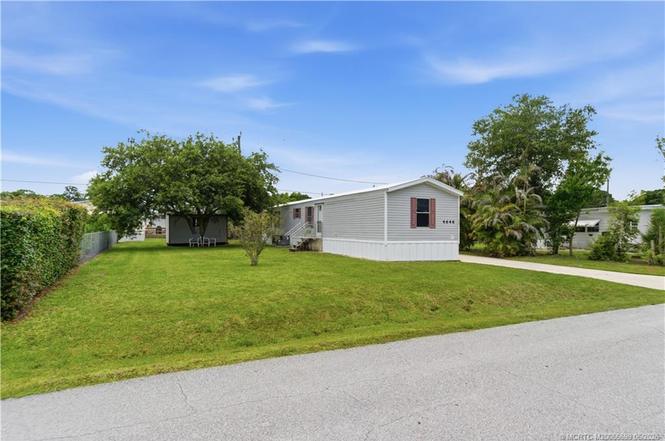
4646 SE Circle Way · Port Salerno, FL
Flood risk 1/10 · Minimal
- FEMA flood zone
- X (unshaded)
- Chance of flooding over 30 yrs
- 0.0%
- Est. flood insurance / yr
- $507 – $1,088
Fire risk 2/10 · Minimal
- Est. fire insurance / yr
- $947 – $1,759
Heat risk 10/10 · Severe
- Hot days now (above 106°F)
- 7 days/yr
- Hot days in 30 yrs
- 25 days/yr
Wind risk 10/10 · Severe
- Chance of severe wind over 30 yrs
- 99.0%
Air-quality risk 2/10 · Minimal
- Unhealthy air days now
- 1 days/yr
- Unhealthy air days in 30 yrs
- 1 days/yr
Risk factors via First Street. Map © Google.
Why this score? — see what drove the F grade
The composite is a weighted blend of 9 inputs, each scored 0–100. Each bar is that input's sub-score; the figure is the points it added to the 100-point composite (weight × sub-score).
- Cash flow +8.9/30.0
- ARV discount +7.5/15.0
- Schools +4.5/10.0
- Livability +3.5/5.0
- Rent growth +3.2/5.0
- DSCR +2.5/10.0
- Condition / age +2.5/5.0
- 1% rule +1.9/10.0
- Appreciation +0.0/10.0
$230,000
🖨 Deal sheet (PDF) 📄 Offer letter ✓ Due diligence
Listing remarks MLS
SPACIOUS 3 BR WITH ATTACHED PORCH AND DECK. LARGE LOT OFFERS ROOM TO ENJOY THIS QUIET COMMUNITY WITH POOL AND CLUBHOUSE. HOME BEING SOLD "AS IS".
Key facts
- 7,405 sq ft lot
- Community pool
- Built 2005
Property features AI
Finance
- Financial info: Pets allowed
- HOA & community: Homeowners association with $75 fee (covers common areas); Non-gated community; Community pool
Exterior
- Utilities: Cable available; Water available
- Home design: Manufactured home; Single-story; Resale property; Metal roof
- Construction: Manufactured construction; Metal roof
- Exterior features: Fenced yard; Shed
Interior
- Bedrooms: 1-story layout
- Bathrooms: 2 full bathrooms
- Heating & cooling: Central heating; Central air conditioning
- Interior features: Unfurnished
Neighborhood map
What this means for you Summary
Snapshot
- This is a 3-bed/2.0-bath manufactured listed at $230k.
Deal economics
- At list price, monthly cash flow is $-185 ($-2k/yr) — negative.
- To cash-flow at today's rent, offer at most $197k (14.2% below list).
- To meet the 1% rule (rent ≥ 1% of price), the offer needs to be $159k (31.0% below list).
- Recommended offer: $159k (31.0% below list) — sets the bar for 1% rule.
- Cap rate 5.3% vs local median 3.1% in Port Salerno — top-decile yield for the area; either an underpriced asset or a hidden risk that comps aren't pricing in. Stress-test before assuming the spread holds.
Location & tenants
- Location reads 70/100 on livability (#440 in FL) — a middle-class / working-renter tenant base. Strengths: housing A+, crime A, health & safety A; Watch: amenities F, commute F.
- Martin (suburban): math 52% / reading 53% proficiency, ranked #24 of 73 in FL (top 33%) — acceptable for families but not a draw, mixed tenant base, ~2y average lease.
- Zoned schools: Sea Wind Elementary School (math 43% / reading 46%, grade F, #1,288 of 2,144 statewide, top 62%, 501 students, 72% FRL); Murray Middle School (math 45% / reading 43%, grade D, #327 of 571 statewide, top 57%, 616 students, 69% FRL); South Fork High School (math 36% / reading 48%, grade F, #275 of 667 statewide, top 42%, 1,810 students, 51% FRL) — zoned schools average 64% FRL vs 41% district-wide (23 pts higher); higher-poverty schools than district average — tighter screening recommended.
- Market conditions: Rents rising (+2.7%/yr); 601 active listings in the ZIP; 12 comparable units currently listed for rent nearby; rentals at typical pace (median 24d on market — plan ~3-4 weeks tenant-placement turnaround); solid renter incomes; 737 units permitted in Martin County in 2024 (167 in 5+ unit buildings).
Forward outlook
- Local home prices are declining (-3.0%/yr); year-one equity from $2k of loan paydown is wiped out by about $7k of value loss. Plan a longer hold.
- Martin County population projected at +19% by 2050 — long-run rental-demand tailwind backs the buy-and-hold thesis.
Negotiation context
- Only 12 days on market — expect competitive offers; lowballing is unlikely to land.
- 2 sale attempts since 29y ago with the ask held roughly flat each time — persistent listings suggest the price (not the market) is what's stuck; bring a comps-based counter.
- Current owner paid $30k; list at $230k implies a 667% gain — meaningful room to come down on a strong offer.
Risks & watch-outs
- Climate carrying-cost: severe wind risk, 99% chance of damaging wind over 30y; extreme-heat days projected 7→25/yr by 2055 (HVAC capex compounding) — expect insurance premiums to compound above CPI over the hold.
Questions for the listing agent
- What do current leases actually rent for vs. the listed asking? Can we see a recent rent roll and the last 12 months of T-12 income?
- What does the HOA fee cover, when was the last increase, and are there any pending special assessments or reserve-fund shortfalls?
- Is there a deadline driving the sale (1031 exchange, divorce, estate, relocation)? That informs how much negotiation room exists.
- Schools are D-rated, which usually means shorter tenancies and higher turnover. Who's the typical renter profile here, and what's been the actual vacancy rate?
- The area grade is low — what's the realistic commute time and amenity access for the typical tenant pool here? Any planned neighborhood developments (good or bad) we should know about?
- What's the average days-on-market for RENTAL listings here right now (not sales)? A rising rental-DOM trend means longer vacancies and softer asking-rent achievability than the comps imply.
- What's the recent tenant-quality profile in this submarket — average credit score on applications, eviction rate, late-payment / NSF rate, and stable-employment percentage? A property-management company in the area should have these aggregated.
- How much new for-sale + rental construction is in the pipeline within 1–3 miles? Heavy new supply typically softens prices + rents 12–24 months out; constrained supply supports both.
Investment metrics
- 1% rule
- 0.69% ✗
- Cap rate
- 5.33%
- Cash-on-cash
- -3.44%
- DSCR
- 0.85
- GRM
- 12.1
CMA / ARV
- ARV (on-the-fly)
- $69,580
- Comps found
- 4
Show comp detail 4 sales within ~0.75 mi
| Address | Dist | Beds/Ba | Sqft | Sold | Price | $/sf | Match |
|---|---|---|---|---|---|---|---|
| 4686 SE Dogwood Ln | 0.55mi | 2/2.0 (-1) | 1,056 (+8%) | 17mo | $87,250 | $83 | 42 |
| 7062 SE Yellowood Ln | 0.63mi | 2/2.0 (-1) | 1,100 (+12%) | 6mo | $68,000 | $62 | 40 |
| 4677 SE Copperwood Ter | 0.67mi | 2/2.0 (-1) | 1,064 (+9%) | 19mo | $67,000 | $63 | 33 |
| 7078 Rosewood Ln | 0.70mi | 2/2.0 (-1) | 1,120 (+14%) | 10mo | $79,900 | $71 | 30 |
Match score weights: distance 35% · size 25% · config 20% · recency 20%. Top-matched comps best support the ARV.
Projected returns pro-forma
-3.0% appreciation · 2.71% rent growth · sell at horizon
- IRR
- -22.4%
- Equity multiple
- 0.23×
- Total profit
- $-49,556
- Equity at exit
- $34,294
- IRR
- -17.3%
- Equity multiple
- 0.06×
- Total profit
- $-60,452
- Equity at exit
- $19,886
Cash invested: $64,400 (down + closing). Projections, not guarantees.
Landlord ↔ Tenant lean methodology
- Overall (STATE)
- 87 Strongly Landlord-Friendly
- State Florida
- 87 Strongly Landlord-Friendly · R+3
- County
- — inherits STATE
- City
- — inherits STATE
ZIP-level market 34997
- Rents YoY
- 2.7%
- Active inventory
- 601
- Price-to-rent
- 12.1×
Monthly cashflow live
- Estimated rent
- $1,588 high interval (Pro) →
- Mortgage (P&I)
- −$1,206
- Tax from tax record
- −$62 /mo · $746/yr
- Insurance
- −$96
- HOA
- −$75
- Lot rent leased land?
- −$0
- Vacancy / Maint / Mgmt
- −$333
- Net cashflow
- $-185
Break-even live
Sensitivity live
| Price | -10% $-54 | -5% $-119 | +0% $-185 | +5% $-250 | +10% $-315 |
|---|---|---|---|---|---|
| Rent | -10% $-310 | -5% $-247 | +0% $-185 | +5% $-122 | +10% $-59 |
| Rate | -1.0pp $-69 | -0.5pp $-126 | base $-185 | +0.5pp $-244 | +1.0pp $-305 |
UW: 25.0% down · 7.5% · 30yr · 1.5% tax · 5.0% vac · 8.0% maint · 8.0% mgmt
Financing live
Cash to close
- Down payment
- $57,500
- Closing costs
- $6,900
- Reserves months
- —
- Total cash needed
- —
Loan-product check · same deal, 3 products live
Conventional
25% down · 7.5% · 30yr
- Down + closing
- —
- Monthly P&I
- —
- Monthly cashflow
- —
- DSCR
- —
- Eligible?
- —
Personal DTI + credit; lowest rate.
DSCR
20% down · 8.5% · 30yr
- Down + closing
- —
- Monthly P&I
- —
- Monthly cashflow
- —
- DSCR
- —
- Eligible?
- —
No personal income docs; deal must DSCR.
Hard money
10% down · 12.0% · 12mo
- Down + closing
- —
- Monthly P&I
- —
- Monthly cashflow
- —
- DSCR
- —
- Eligible?
- —
Short-term bridge; refi at stabilization.
Rent comps 12 comps
| Address | Beds | Baths | Sqft | Rent | $/sqft | DOM | Units | Dist |
|---|---|---|---|---|---|---|---|---|
| 4421 SE Village Rd Stuart, FL | 2.0 | 2.0 | 1080 | $2,100 | $1.94 | 26d | 1 | 0.15mi |
| 6535 SE Federal Hwy Stuart, FL | 2.0 | 2.0 | 967 | $1,750 | $1.81 | 26d | 1 | 0.19mi |
| 4667 SE Salvatori Rd Unit 4667 Stuart, FL | 2.0 | 2.0 | 800 | $2,100 | $2.62 | 26d | 1 | 0.24mi |
| 6537 SE Federal Hwy #102 Stuart, FL | 2.0 | 2.0 | 969 | $1,845 | $1.90 | 16d | 1 | 0.25mi |
| 6551 SE Federal Hwy Stuart, FL | 2.0 | 2.0 | 969 | $1,825 | $1.88 | 23d | 2 | 0.25mi |
| 6551 SE Federal Hwy #104 Stuart, FL | 2.0 | 2.0 | 969 | $2,000 | $2.06 | 16d | 1 | 0.25mi |
| 6553 SE Federal Hwy Unit 10-102 Stuart, FL | 2.0 | 2.0 | 969 | $1,750 | $1.81 | 26d | 1 | 0.26mi |
| 6531 SE Federal Hwy Stuart, FL | 2.0 | 2.0 | 1100 | $1,725 | $1.57 | 16d | 2 | 0.27mi |
| 5803 SE Collins Ave Stuart, FL | 2.0 | 2.0 | 874 | $2,200 | $2.52 | 26d | 1 | 0.61mi |
| 5045 SE Primrose Way Stuart, FL | 2.0 | 2.0 | 837 | $1,900 | $2.27 | 16d | 1 | 0.77mi |
| 4606 SE Binnacle Way Unit 1 Stuart, FL | 2.0 | 1.0 | 928 | $1,850 | $1.99 | 16d | 1 | 1.02mi |
| 5601 SE Laguna Ave Stuart, FL | 2.0 | 1.0 | 1080 | $2,200 | $2.04 | 16d | 1 | 1.19mi |
HOA detail
- Monthly dues
- $75 · $900/yr
- Likely covers
- pool
Listing history 9 events
-
2026-06-23days on market $230,000 Active 12 DOM
-
2026-06-21days on market $230,000 Active 11 DOM
-
2026-06-18days on market $230,000 Active 8 DOM
-
2026-06-17days on market $230,000 Active 7 DOM
-
2026-06-16days on market $230,000 Active 6 DOM
-
2026-06-15days on market $230,000 Active 5 DOM
-
2026-06-14days on market $230,000 Active 3 DOM
-
2026-06-13remarks 699-char remark
-
2026-06-13$230,000 Active 2 DOM
ⓘ Source: listings_history table (triggers on properties + properties_extension) + one-shot
backfill from property_details.listing_events for pre-trigger history.
Tax reassessment forecast FL · Resets to sale price
- Current annual tax
- $746 · $62/mo
- Projected year-2 tax
- $1,909 · $159/mo
- Expected delta
- +$1,163/yr (+$97/mo · 155.8%)
ⓘ Screening estimate from a state-policy table — verify with the county assessor before closing.
Climate risk First Street
- Flood 1/10 Low FEMA zone X (unshaded) · 0% chance over 30 yrs
- Wildfire 2/10 Low
- Heat 10/10 Extreme 7 d/yr ≥106°F today · 25 d/yr by 30 yrs out
- Wind 10/10 Extreme 99% chance of damaging wind over 30 yrs
- Air quality 2/10 Low 1 unhealthy d/yr today · 1 by 30 yrs out
Nearby sold comps map
Loading sold comps map…
Walkable amenities ~0.75 mi
Loading nearby amenities…
Taxation est. · year 1
- Rental income
- $19,057
- − Mortgage interest
- −$12,884
- − Property taxes
- −$746
- − Insurance
- −$1,150
- − Repairs & maintenance
- −$1,525
- − Management
- −$1,525
- − HOA
- −$900
- − Depreciation
- −$6,691
- Taxable loss
- −$6,363
- Est. tax savings @ 24.0%
- +$1,527
- After-tax cash flow
- $-688/yr
For passive investors: Depreciation is non-cash, so a rental often shows a tax loss while cash-flowing — sheltering income. Rental losses are passive: they offset passive income freely, and up to $25,000/yr can offset ordinary (W-2) income if you actively participate and your MAGI is under $100k (phasing out to $0 by $150k); unused losses carry forward. On sale, claimed depreciation is recaptured at up to 25%, and gains may owe capital-gains tax (a 1031 exchange can defer both). Figures are a year-1 estimate at your 24.0% rate — not tax advice; consult a CPA.
Schools (NCES district)
- District
- Martin
- NCES district ID
- 1201290
- Math proficiency
- 52% ▼ -14.00%
- Reading proficiency
- 53% ▼ -4.00%
- Median HH income
- $52,482
- Composite
- 45.1/100
- National rank
- #2690
- State rank
- #24 of 73 in FL
Livability — Port Salerno
- Score
- 70/100
- State rank
- #440
- US rank
- #7873
Category grades
Schools grade is shown separately in the Schools card above.
Census & demographics
- Census place
- Port Salerno, FL
- County
- Martin County · 165,223 people
- Metro
- Port St. Lucie, FL
- Population (ZIP)
- 47,075
- Household income
- $78,136
- Rent vs Own
- Severe rent burden
- 1323.0
Population outlook (Martin County) Hauer SSP2
- Today (2025)
- 172,383 people
- By 2030
- 180,192 · +4.5%
- By 2040
- 194,114 · +12.6%
- By 2050
- 204,992 · +18.9%
- By 2075
- 229,641 · +33.2%
- By 2100
- 232,146 · +34.7%
Race, ethnicity, and origin ACS 2023
- Neighborhood character
- Predominantly White (74%)
- Race & ethnicity
- White 74% Hispanic / Latino 19% Two or more races 9% Black 3% Asian 1%
- Hispanic origin (detail)
- Mexican 4% Puerto Rican 2% Cuban 3%
- Common ancestry
- Romanian 3% Lithuanian 3% Slovak 2%
- Foreign-born
- 14% · Canada, Jamaica, China
- Languages at home
- 81% English-only · Spanish 14% French/Haitian/Cajun 2% Other Indo-European 1%
Political lean MEDSL · Martin
- 2024 margin
- Solid R (+31.1) · D 34.1% · R 65.2%
- 2008→2024 swing
- -17.5pp toward R · 2008: -13.6pp · 2024: -31.1pp
- All cycles
- 2024: R+31.1 2020: R+24.6 2016: R+26.9 2012: R+22.9 2008: R+13.6
Not yet ingested
- Civics
- —
Market trends
- HPI YoY
- ▼ -319.78%
- Current HPI
- 336.7717
- Rent YoY
- ▲ 2.71%
- Metro
- Port St. Lucie, FL
- State GDP YoY
- ▲ 3.28%
- F500 in state
- 36
Industry mix (Fortune 500 HQ in FL)
| Industry | F500 HQs | Revenue |
|---|---|---|
| Industrial Technology | 2 | $29B |
|
||
| Insurance | 2 | $17B |
|
||
| Retail | 1 | $60B |
|
||
| Technology Distribution | 1 | $58B |
|
||
| Homebuilding | 1 | $35B |
|
||
| Technology Manufacturing | 1 | $35B |
|
||
Price history
+618.8% since first listed4 events — show timeline
- 2026-06-11 Listed $230,000 MCRTC
- 1998-06-01 Sold (MLS) $30,000 MCRTC
- 1997-05-24 Listed $34,900 MCRTC
- 1979-08-01 Sold (Public Records) $32,000 Public Records
Property tax history
+4.3%/yrLatest (2025): $746 · +3.9% YoY. Source: county tax records.
Cash-flow waterfall
monthlySold comps — $/sqft
last 12 mo · ≤1 miLoading sold comps…