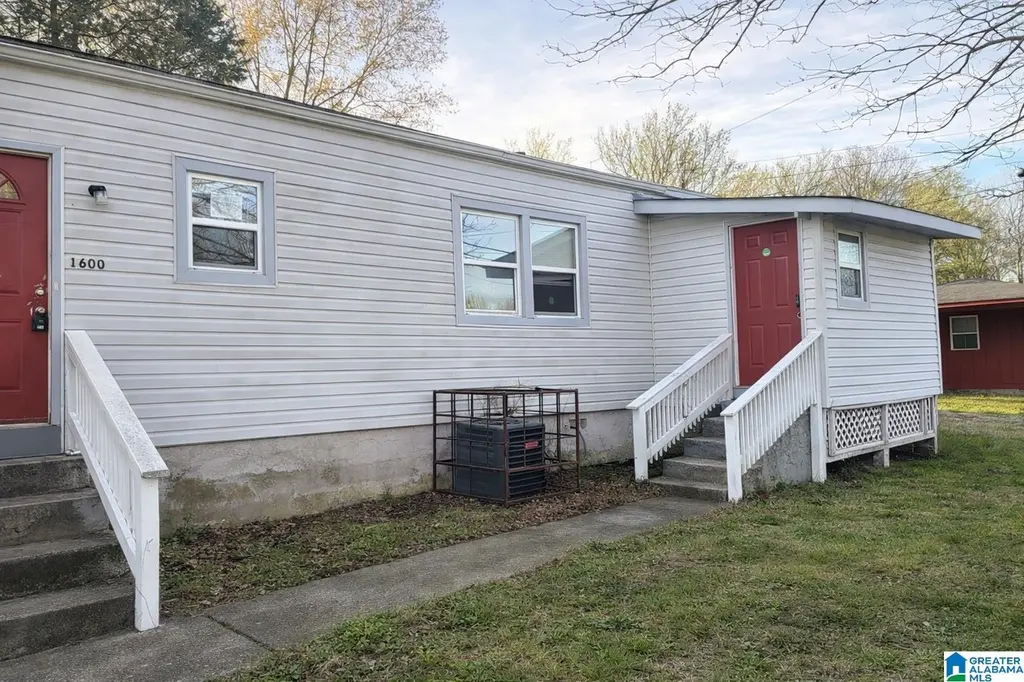
1600 Pleasant Grove Rd · Birmingham, AL
Flood risk 1/10 · Minimal
- FEMA flood zone
- X (unshaded)
- Chance of flooding over 30 yrs
- 0.0%
- Est. flood insurance / yr
- $507 – $1,088
Fire risk 3/10 · Minor
- Est. fire insurance / yr
- $916 – $1,700
Heat risk 6/10 · Moderate
- Hot days now (above 108°F)
- 7 days/yr
- Hot days in 30 yrs
- 19 days/yr
Wind risk 6/10 · Moderate
- Chance of severe wind over 30 yrs
- 27.0%
Air-quality risk 3/10 · Minor
- Unhealthy air days now
- 3 days/yr
- Unhealthy air days in 30 yrs
- 5 days/yr
Risk factors via First Street. Map © Google.
Why this score? — see what drove the A- grade
The composite is a weighted blend of 9 inputs, each scored 0–100. Each bar is that input's sub-score; the figure is the points it added to the 100-point composite (weight × sub-score).
- Cash flow +30.0/30.0
- ARV discount +15.0/15.0
- 1% rule +10.0/10.0
- DSCR +10.0/10.0
- Appreciation +7.1/10.0
- Livability +3.4/5.0
- Rent growth +2.5/5.0
- Condition / age +2.5/5.0
- Schools +0.9/10.0
$74,900
🖨 Deal sheet 📄 Offer letter ✓ Due diligence
Listing remarks MLS
Investment opportunity at 1600 Pleasant Grove! This 3-bedroom, 1-bath home offers solid potential with a functional layout and appealing curb presence. With the right updates, this property could be a great addition to a rental portfolio or resale project. Ideal for investors looking to add value and maximize returns. Receivership property being sold as-is.
Key facts
- 7,840 sq ft lot
- Built 1996
- Listed 79 days
Neighborhood map
What this means for you Summary
Snapshot
- This is a 3-bed/1.5-bath single-family listed at $75k.
Deal economics
- At list price, monthly cash flow is $380 ($5k/yr) — positive.
- The deal already cash-flows at list — no discount required.
- Meets the 1% rule at list price ($1k rent vs $75k).
- Recommended offer: $70k (6.0% below list) — sets the bar for market timing.
- Cap rate 12.4% vs local median 6.2% in Birmingham — top-decile yield for the area; either an underpriced asset or a hidden risk that comps aren't pricing in. Stress-test before assuming the spread holds.
Location & tenants
- Location reads 67/100 on livability (#78 in AL) — a middle-class / working-renter tenant base. Strengths: commute A+, cost of living A+, housing A+; Watch: amenities C-, schools F, crime F.
- Birmingham City (urban): math 4% / reading 20% proficiency, ranked #116 of 129 in AL (top 90%) — low school quality limits family demand, transient renter base, plan for 1-2y turnover; 82% free/reduced lunch — lower-income household profile, screen leases tightly.
- Market conditions: 16 active listings in the ZIP; 14 comparable units currently listed for rent nearby; rentals at typical pace (median 16d on market — plan ~3-4 weeks tenant-placement turnaround); 2,114 units permitted in Jefferson County in 2024 (556 in 5+ unit buildings).
Forward outlook
- In year one you build about $4k of equity ($518 loan paydown + $3k appreciation (4.1% local appreciation)).
- Jefferson County population projected to shrink 4% by 2050 — rents likely to lag national; underwrite the cash flow, not the appreciation.
- At projected returns (4.1% appreciation + 3.0% rent growth), your $21k cash investment doubles in ~3 years — after that, you're playing with house money.
- By year 9, paydown + projected appreciation supports a ~$31k cash-out refi (75% LTV) — recoverable capital for the next deal without selling this one.
Negotiation context
- It's been on market 79 days — a 6% lower offer ($70k) is reasonable based on typical stale-listing flexibility.
- 3 sale attempts since 3y ago with the ask held roughly flat each time — persistent listings suggest the price (not the market) is what's stuck; bring a comps-based counter.
- Current owner paid $48k; list at $75k implies a 56% gain — meaningful room to come down on a strong offer.
Risks & watch-outs
- Climate carrying-cost: major wind risk, 27% chance of damaging wind over 30y; extreme-heat days projected 7→19/yr by 2055 (HVAC capex compounding) — expect insurance premiums to compound above CPI over the hold.
Questions for the listing agent
- It's been on market 79 days. Have you received any prior offers? Is the seller open to a 6% concession, seller financing, or rate buy-down credit?
- Why hasn't it sold? Are there any deal-killer items the seller is aware of (foundation, flood, title, zoning, code violations)?
- Is there a deadline driving the sale (1031 exchange, divorce, estate, relocation)? That informs how much negotiation room exists.
- Schools are F-rated, which usually means shorter tenancies and higher turnover. Who's the typical renter profile here, and what's been the actual vacancy rate?
- Crime grade is F in this area — have there been break-ins, vandalism, or insurance claims at this property in the last 3 years? What carrier currently insures it and at what premium?
- What's the average days-on-market for RENTAL listings here right now (not sales)? A rising rental-DOM trend means longer vacancies and softer asking-rent achievability than the comps imply.
- What's the recent tenant-quality profile in this submarket — average credit score on applications, eviction rate, late-payment / NSF rate, and stable-employment percentage? A property-management company in the area should have these aggregated.
- How much new for-sale + rental construction is in the pipeline within 1–3 miles? Heavy new supply typically softens prices + rents 12–24 months out; constrained supply supports both.
Investment metrics
- 1% rule
- 1.57% ✓
- Cap rate
- 12.38%
- Cash-on-cash
- 21.75%
- DSCR
- 1.97
- GRM
- 5.3
CMA / ARV
- ARV (median comp)
- $118,900
- List price
- $74,900
- Delta
- -37.01%
- Verdict
- UNDERPRICED
- Comps
- 20 within 1.0 mi
Show comp detail 8 sales within ~0.75 mi
| Address | Dist | Beds/Ba | Sqft | Sold | Price | $/sf | Match |
|---|---|---|---|---|---|---|---|
| 223 Woodward Dr | 0.37mi | 3/1.0 | 988 (-6%) | 7mo | $100,000 | $101 | 65 |
| 1589 Carver St | 0.39mi | 3/1.0 | 957 (-9%) | 5mo | $120,000 | $125 | 61 |
| 1669 Pleasant Grove Rd | 0.30mi | 3/2.0 | 1,144 (+9%) | 14mo | $135,000 | $118 | 57 |
| 212 Cedar Cir | 0.41mi | 2/1.0 (-1) | 1,184 (+13%) | 1mo | $82,900 | $70 | 52 |
| 399 Clio St | 0.62mi | 3/1.0 | 1,118 (+6%) | 15mo | $115,000 | $103 | 46 |
| 3505 2nd St N | 0.46mi | 3/1.0 | 960 (-9%) | 21mo | $110,000 | $115 | 44 |
| 358 Five Acre Rd | 0.67mi | 3/1.0 | 1,118 (+6%) | 15mo | $125,900 | $113 | 43 |
| 1719 Robins St | 0.69mi | 3/1.5 | 1,152 (+10%) | 15mo | $27,000 | $23 | 39 |
Match score weights: distance 35% · size 25% · config 20% · recency 20%. Top-matched comps best support the ARV.
Projected returns pro-forma
4.1% appreciation · 3.0% rent growth · sell at horizon
- IRR
- 30.1%
- Equity multiple
- 2.80×
- Total profit
- $37,742
- Equity at exit
- $38,436
- IRR
- 29.6%
- Equity multiple
- 5.54×
- Total profit
- $95,219
- Equity at exit
- $63,234
Cash invested: $20,972 (down + closing). Projections, not guarantees.
Landlord ↔ Tenant lean methodology
- Overall (STATE)
- 90 Strongly Landlord-Friendly
- State Alabama
- 90 Strongly Landlord-Friendly · R+15
- County
- — inherits STATE
- City
- — inherits STATE
ZIP-level market 35061
- Home prices YoY
- 1.8%
- Active inventory
- 16
- Price-to-rent
- 5.3×
Monthly cashflow live
- Estimated rent
- $1,173 high interval (Pro) →
- Mortgage (P&I)
- −$393
- Tax from tax record
- −$122 /mo · $1,469/yr
- Insurance
- −$31
- HOA
- −$0
- Vacancy / Maint / Mgmt
- −$246
- Net cashflow
- $380
Break-even live
UW: 25.0% down · 7.5% · 30yr · 1.5% tax · 5.0% vac · 8.0% maint · 8.0% mgmt
Financing live
Cash to close
- Down payment
- $18,725
- Closing costs
- $2,247
- Reserves months
- —
- Total cash needed
- —
Loan-product check · same deal, 3 products live
Conventional
25% down · 7.5% · 30yr
- Down + closing
- —
- Monthly P&I
- —
- Monthly cashflow
- —
- DSCR
- —
- Eligible?
- —
Personal DTI + credit; lowest rate.
DSCR
20% down · 8.5% · 30yr
- Down + closing
- —
- Monthly P&I
- —
- Monthly cashflow
- —
- DSCR
- —
- Eligible?
- —
No personal income docs; deal must DSCR.
Hard money
10% down · 12.0% · 12mo
- Down + closing
- —
- Monthly P&I
- —
- Monthly cashflow
- —
- DSCR
- —
- Eligible?
- —
Short-term bridge; refi at stabilization.
Rent comps 14 comps
| Address | Beds | Baths | Sqft | Rent | $/sqft | DOM | Units | Dist |
|---|---|---|---|---|---|---|---|---|
| 1565 Miles St Dolomite, AL | 3.0 | 2.0 | 1120 | $1,175 | $1.05 | 16d | 1 | 0.22mi |
| 216 Pine St Bessemer, AL | 3.0 | 2.0 | 1000 | $1,200 | $1.20 | 43d | 1 | 0.41mi |
| 200 Woodward Dr Bessemer, AL | 3.0 | 1.0 | 900 | $1,123 | $1.25 | 2d | 1 | 0.44mi |
| 1401 9th Ave Birmingham, AL | 3.0 | 2.0 | 1222 | $1,200 | $0.98 | 43d | 1 | 1.08mi |
| 1983 Townhouse Ln Bessemer, AL | 2.0 | 2.0 | 1465 | $1,100 | $0.75 | 16d | 1 | 1.20mi |
| 406 Forest Rd Bessemer, AL | 3.0 | 2.0 | 1200 | $1,175 | $0.98 | 14d | 1 | 1.21mi |
| 1207 7th Ave Pleasant Grove, AL | 3.0 | 1.0 | 1362 | $1,601 | $1.18 | 1d | 1 | 1.26mi |
| 608 5th Ave Midfield, AL | 3.0 | 1.0 | 1241 | $795 | $0.64 | 21d | 1 | 1.33mi |
| 1109 12th Ave Birmingham, AL | 4.0 | 2.0 | 1217 | $1,475 | $1.21 | 3d | 1 | 1.36mi |
| 616 Rutledge Dr Birmingham, AL | 3.0 | 1.0 | 1416 | $1,095 | $0.77 | 21d | 1 | 1.36mi |
| 1133 7th Ave Pleasant Grove, AL | 3.0 | 2.0 | 1104 | $1,250 | $1.13 | 14d | 1 | 1.37mi |
| 617 8th Ave Birmingham, AL | 4.0 | 2.0 | 1436 | $1,350 | $0.94 | 1d | 1 | 1.39mi |
| 806 12th Ave Birmingham, AL | 3.0 | 1.0 | 1262 | $1,075 | $0.85 | 43d | 1 | 1.46mi |
| 605 10th Ave Birmingham, AL | 3.0 | 1.0 | 1060 | $850 | $0.80 | 43d | 1 | 1.48mi |
Listing history 20 events
-
2026-06-18days on market $74,900 Active 79 DOM
-
2026-06-17days on market $74,900 Active 78 DOM
-
2026-06-16days on market $74,900 Active 77 DOM
-
2026-06-15days on market $74,900 Active 76 DOM
-
2026-06-13days on market $74,900 Active 74 DOM
-
2026-06-10days on market $74,900 Active 71 DOM
-
2026-06-09days on market $74,900 Active 70 DOM
-
2026-06-08days on market $74,900 Active 69 DOM
-
2026-06-07days on market $74,900 Active 68 DOM
-
2026-06-03days on market $74,900 Active 64 DOM
-
2026-06-02days on market $74,900 Active 63 DOM
-
2026-06-01days on market $74,900 Active 62 DOM
-
2026-05-31days on market $74,900 Active 61 DOM
-
2026-03-30$74,900 Active 359-char remark
Show marketing remark (359 chars)
Investment opportunity at 1600 Pleasant Grove! This 3-bedroom, 1-bath home offers solid potential with a functional layout and appealing curb presence. With the right updates, this property could be a great addition to a rental portfolio or resale project. Ideal for investors looking to add value and maximize returns. Receivership property being sold as-is.
-
2026-01-20price $74,900
-
2025-07-25historical $1,150
-
2024-04-10$1,150
-
2024-04-10historical $1,150
-
2023-07-20$1,150
-
1997-10-01soldstatus $48,000
ⓘ Source: listings_history table (triggers on properties + properties_extension) + one-shot
backfill from property_details.listing_events for pre-trigger history.
Tax reassessment forecast AL · Resets to sale price
- Current annual tax
- $1,469 · $122/mo
- Projected year-2 tax
- $1,469 · $122/mo
- Expected delta
- $0/yr ($0/mo · 0.0%)
ⓘ Screening estimate from a state-policy table — verify with the county assessor before closing.
Climate risk First Street
- Flood 1/10 Low FEMA zone X (unshaded) · 0% chance over 30 yrs
- Wildfire 3/10 Moderate
- Heat 6/10 Major 7 d/yr ≥108°F today · 19 d/yr by 30 yrs out
- Wind 6/10 Major 27% chance of damaging wind over 30 yrs
- Air quality 3/10 Moderate 3 unhealthy d/yr today · 5 by 30 yrs out
Nearby sold comps map
Loading sold comps map…
Walkable amenities ~0.75 mi
Loading nearby amenities…
Taxation est. · year 1
- Rental income
- $14,074
- − Mortgage interest
- −$4,196
- − Property taxes
- −$1,469
- − Insurance
- −$374
- − Repairs & maintenance
- −$1,126
- − Management
- −$1,126
- − Depreciation
- −$2,179
- Taxable income
- $3,604
- Est. tax owed @ 24.0%
- −$865
- After-tax cash flow
- $3,697/yr
For passive investors: Depreciation is non-cash, so a rental often shows a tax loss while cash-flowing — sheltering income. Rental losses are passive: they offset passive income freely, and up to $25,000/yr can offset ordinary (W-2) income if you actively participate and your MAGI is under $100k (phasing out to $0 by $150k); unused losses carry forward. On sale, claimed depreciation is recaptured at up to 25%, and gains may owe capital-gains tax (a 1031 exchange can defer both). Figures are a year-1 estimate at your 24.0% rate — not tax advice; consult a CPA.
Schools (NCES district)
- District
- Birmingham City
- NCES district ID
- 0100390
- Math proficiency
- 4% ▼ -17.00%
- Reading proficiency
- 20% ▼ -4.00%
- Median HH income
- $31,988
- Composite
- 9.49/100
- National rank
- #9850
- State rank
- #116 of 129 in AL
Livability — Birmingham
- Score
- 67/100
- State rank
- #78
- US rank
- #10412
Category grades
Schools grade is shown separately in the Schools card above.
Census & demographics
- Census place
- Birmingham, AL
- City population
- 210,422
- Population (ZIP)
- 1,633
Population outlook (Jefferson County) Hauer SSP2
- Today (2025)
- 669,185 people
- By 2030
- 669,694 · +0.1%
- By 2040
- 661,388 · -1.2%
- By 2050
- 643,086 · -3.9%
- By 2075
- 577,267 · -13.7%
- By 2100
- 474,758 · -29.1%
Race, ethnicity, and origin ACS 2023
- Neighborhood character
- Predominantly Black (97%)
- Race & ethnicity
- Black 97% White 3%
- Foreign-born
- 0%
Political lean MEDSL · Jefferson
- 2024 margin
- D (+10.4) · D 54.6% · R 44.2% · Other 1.2%
- 2008→2024 swing
- +5.4pp toward D · 2008: 5.1pp · 2024: 10.4pp
- All cycles
- 2024: D+10.4 2020: D+13.2 2016: D+7.2 2012: D+6.0 2008: D+5.1
Not yet ingested
- Civics
- —
Market trends
- HPI YoY
- ▲ 4.10%
- Current HPI
- 232.777
- Rent YoY
- —
- Metro
- —
- State GDP YoY
- ▲ 2.94%
- F500 in state
- 4
Industry mix (Fortune 500 HQ in AL)
| Industry | F500 HQs | Revenue |
|---|---|---|
| Financial Services | 1 | $8B |
|
||
| Healthcare | 1 | $5B |
|
||
Price history
+56.0% since first listed7 events — show timeline
- 2026-03-30 Listed $74,900 Greater Alabama MLS
- 2026-01-20 Price Changed $74,900 Greater Alabama MLS
- 2025-07-25 Rental Removed $1,150 APPFOLIO
- 2024-04-10 Listed for Rent $1,150 APPFOLIO
- 2024-04-10 Rental Removed $1,150 APPFOLIO
- 2023-07-20 Listed for Rent $1,150 APPFOLIO
- 1997-10-01 Sold (Public Records) $48,000 Public Records
Property tax history
+33.8%/yrLatest (2025): $1,469 · +0.0% YoY. Source: county tax records.
Cash-flow waterfall
monthlySold comps — $/sqft
last 12 mo · ≤1 miLoading sold comps…