 Duplex
403 N 19th St · Paducah, KY
Flood risk 3/10 · Minor
- FEMA flood zone
- X
- Chance of flooding over 30 yrs
- 0.2%
- Est. flood insurance / yr
- $507 – $1,088
Fire risk 3/10 · Minor
- Est. fire insurance / yr
- $839 – $1,559
Heat risk 6/10 · Moderate
- Hot days now (above 108°F)
- 7 days/yr
- Hot days in 30 yrs
- 20 days/yr
Wind risk 3/10 · Minor
- Chance of severe wind over 30 yrs
- 6.0%
Air-quality risk 3/10 · Minor
- Unhealthy air days now
- 1 days/yr
- Unhealthy air days in 30 yrs
- 4 days/yr
Risk factors via First Street. Map © Google.
Why this score? — see what drove the C+ grade
The composite is a weighted blend of 9 inputs, each scored 0–100. Each bar is that input's sub-score; the figure is the points it added to the 100-point composite (weight × sub-score).
- Cash flow +27.5/30.0
- DSCR +9.6/10.0
- 1% rule +7.5/10.0
- ARV discount +7.5/15.0
- Livability +3.4/5.0
- Rent growth +2.5/5.0
- Schools +2.3/10.0
- Condition / age +2.2/5.0
- Appreciation +0.0/10.0
$219,900
🖨 Deal sheet (PDF) 📄 Offer letter ✓ Due diligence
Multi-family units
County records classify this as Multi-Family (2-4 Unit). Listing-text estimate: 2 units. confirmed
Listing remarks MLS
Income-generating duplex located in Paducah! One side is currently leased to a long-term tenant at $1,000/month. The tenant is interested in relocating to the updated vacant side, offering potential for increased rental income after light improvements to the current unit. The vacant side features 3 bedrooms and 1 full bath, all on one level. The occupied unit offers 3 bedrooms and 2 full baths, with all three bedrooms upstairs. With both units offering strong rental potential, this property presents a great opportunity for an investor or owner-occupant looking to offset their living expenses.
Key facts
- Completely renovated
- Convenient location
- Move in ready
Tags
Property features AI
Exterior
- Security: Smoke detectors
- Utilities: Public water; Public sewer; Cable available; Natural gas available
- Home design: Duplex residential income property; 2 stories
- Construction: Frame construction with vinyl siding; Shingle roof
- Exterior features: Level lot; Subdivision: Terrell's Fountain Park
Interior
- Flooring: Concrete; Vinyl; Wood
- Bathrooms: 3 full bathrooms
- Heating & cooling: Central air; Ceiling fans; Forced air heating
- Interior features: Concrete, vinyl, and wood flooring; Crawl space basement
Neighborhood map
What this means for you Summary
Snapshot
- This is a 2 × 3-bed/1.5-bath units multifamily listed at $220k. Condition is rated fair.
Deal economics
- At list price, monthly cash flow is $651 ($8k/yr) — positive. Per door: $326/mo.
- The deal already cash-flows at list — no discount required.
- Meets the 1% rule at list price ($3k rent vs $220k).
- Recommended offer: $217k (1.5% below list) — sets the bar for market timing.
- Cap rate 9.8% vs local median 4.5% in Paducah — top-decile yield for the area; either an underpriced asset or a hidden risk that comps aren't pricing in. Stress-test before assuming the spread holds.
Location & tenants
- Location reads 68/100 on livability (#197 in KY) — a middle-class / working-renter tenant base. Strengths: cost of living A+, housing A+, health & safety A+; Watch: crime C-, employment D, amenities F.
- Paducah Independent (town): math 22% / reading 36% proficiency, ranked #122 of 165 in KY (top 74%) — low school quality limits family demand, transient renter base, plan for 1-2y turnover; 69% free/reduced lunch — lower-income household profile, screen leases tightly.
- Zoned schools: Mcnabb Elementary School (math 8% / reading 17%, grade F, #630 of 676 statewide, top 95%, 322 students, 91% FRL); Paducah Middle School (math 19% / reading 36%, grade F, #168 of 217 statewide, top 78%, 652 students, 69% FRL); Paducah Tilghman High School (math 22% / reading 42%, grade F, #97 of 254 statewide, top 46%, 878 students, 64% FRL).
- Market conditions: 252 active listings in the ZIP; 187 units permitted in McCracken County in 2024 (104 in 5+ unit buildings).
- At $2,748/mo this rent would consume 46% of the median local household income ($71k/yr) (locally 1001% of renters already pay >50% of income on rent) — very limited rent-growth headroom before tenants either downsize or default.
Forward outlook
- Local home prices are declining (-3.0%/yr); year-one equity from $2k of loan paydown is wiped out by about $7k of value loss. Plan a longer hold.
- McCracken County population projected to shrink 9% by 2050 — rents likely to lag national; underwrite the cash flow, not the appreciation.
- At projected returns (-3.0% appreciation + 3.0% rent growth), your $62k cash investment doubles in ~9 years — after that, you're playing with house money.
Negotiation context
- It's been on market 22 days — a 2% lower offer ($217k) is reasonable based on typical stale-listing flexibility.
- 3 sale attempts; this cycle's ask has dropped $20k (8%) from the opening price — seller is motivated, your offer sets the floor, not the list.
- Current owner paid $178k; 24% above their basis — modest negotiation headroom, anchor on the comps not their cost.
Risks & watch-outs
- Climate carrying-cost: extreme-heat days projected 7→20/yr by 2055 (HVAC capex compounding) — expect insurance premiums to compound above CPI over the hold.
Questions for the listing agent
- Can we see the unit-by-unit rent roll, current vacancy, and any below-market leases? What's the average tenancy length?
- What capital expenditures (roof, boiler, parking lot, exteriors) have been made in the last 5 years, and what's planned in the next 2?
- Have any recent inspections been done? Can we get a copy of the seller's disclosures and any deferred-maintenance estimates?
- Is there a deadline driving the sale (1031 exchange, divorce, estate, relocation)? That informs how much negotiation room exists.
- Schools are D-rated, which usually means shorter tenancies and higher turnover. Who's the typical renter profile here, and what's been the actual vacancy rate?
- What's the average days-on-market for RENTAL listings here right now (not sales)? A rising rental-DOM trend means longer vacancies and softer asking-rent achievability than the comps imply.
- What's the recent tenant-quality profile in this submarket — average credit score on applications, eviction rate, late-payment / NSF rate, and stable-employment percentage? A property-management company in the area should have these aggregated.
- How much new apartment / multifamily construction is in the pipeline within 1–3 miles? Heavy new supply (>2% of stock underway) typically softens rents 12–24 months out; light construction supports rent growth.
Investment metrics
- 1% rule
- 1.25% ✓
- Cap rate
- 9.85%
- Cash-on-cash
- 12.69%
- DSCR
- 1.56
- GRM
- 6.7
CMA / ARV
No comps found within radius.
Projected returns pro-forma
-3.0% appreciation · 3.0% rent growth · sell at horizon
- IRR
- 2.5%
- Equity multiple
- 1.10×
- Total profit
- $5,886
- Equity at exit
- $32,788
- IRR
- 12.1%
- Equity multiple
- 1.95×
- Total profit
- $58,703
- Equity at exit
- $19,013
Cash invested: $61,572 (down + closing). Projections, not guarantees.
Landlord ↔ Tenant lean methodology
- Overall (STATE)
- 83 Strongly Landlord-Friendly
- State Kentucky
- 83 Strongly Landlord-Friendly · R+16
- County
- — inherits STATE
- City
- — inherits STATE
ZIP-level market 42001
- Home prices YoY
- -24.8%
- Active inventory
- 252
- Price-to-rent
- 13.3×
Monthly cashflow live
- Estimated rent
- $2,748 medium interval (Pro) →
- Mortgage (P&I)
- −$1,153
- Tax est. 1.5%
- −$275 /mo · $3,298/yr
- Insurance
- −$92
- HOA
- −$0
- Vacancy / Maint / Mgmt
- −$577
- Net cashflow
- $651
Break-even live
Sensitivity live
| Price | -10% $803 | -5% $727 | +0% $651 | +5% $575 | +10% $499 |
|---|---|---|---|---|---|
| Rent | -10% $434 | -5% $543 | +0% $651 | +5% $760 | +10% $868 |
| Rate | -1.0pp $762 | -0.5pp $707 | base $651 | +0.5pp $594 | +1.0pp $536 |
2-unit breakdown (identical units grouped — click to expand)
| Units | Beds | Baths | Est. rent |
|---|---|---|---|
| 2× units | 3 | 1.5 | $2,748 |
| #1 | 3 | 1.5 | $1,374 |
| #2 | 3 | 1.5 | $1,374 |
| Total (2 units) | $2,748 | ||
UW: 25.0% down · 7.5% · 30yr · 1.5% tax · 5.0% vac · 8.0% maint · 8.0% mgmt
Financing live
Cash to close
- Down payment
- $54,975
- Closing costs
- $6,597
- Reserves months
- —
- Total cash needed
- —
Loan-product check · same deal, 3 products live
Conventional
25% down · 7.5% · 30yr
- Down + closing
- —
- Monthly P&I
- —
- Monthly cashflow
- —
- DSCR
- —
- Eligible?
- —
Personal DTI + credit; lowest rate.
DSCR
20% down · 8.5% · 30yr
- Down + closing
- —
- Monthly P&I
- —
- Monthly cashflow
- —
- DSCR
- —
- Eligible?
- —
No personal income docs; deal must DSCR.
Hard money
10% down · 12.0% · 12mo
- Down + closing
- —
- Monthly P&I
- —
- Monthly cashflow
- —
- DSCR
- —
- Eligible?
- —
Short-term bridge; refi at stabilization.
Listing history 17 events
-
2026-06-22days on market $219,900 Active 22 DOM
-
2026-06-21days on market $219,900 Active 21 DOM
-
2026-06-19days on market $219,900 Active 19 DOM
-
2026-06-18price $219,900 Active 18 DOM
-
2026-06-18days on market $239,900 Active 18 DOM
-
2026-06-17days on market $239,900 Active 17 DOM
-
2026-06-16days on market $239,900 Active 16 DOM
-
2026-06-15days on market $239,900 Active 15 DOM
-
2026-06-14days on market $239,900 Active 13 DOM
-
2026-06-12days on market $239,900 Active 12 DOM
-
2026-06-09days on market $239,900 Active 9 DOM
-
2026-06-08days on market $239,900 Active 8 DOM
-
2026-06-07days on market $239,900 Active 7 DOM
-
2026-06-03days on market $239,900 Active 3 DOM
-
2026-06-02days on market $239,900 Active 2 DOM
-
2026-06-01remarks 695-char remark
-
2026-06-01$239,900 Active 1 DOM
ⓘ Source: listings_history table (triggers on properties + properties_extension) + one-shot
backfill from property_details.listing_events for pre-trigger history.
Climate risk First Street
- Flood 3/10 Moderate FEMA zone X · 20% chance over 30 yrs
- Wildfire 3/10 Moderate
- Heat 6/10 Major 7 d/yr ≥108°F today · 20 d/yr by 30 yrs out
- Wind 3/10 Moderate 6% chance of damaging wind over 30 yrs
- Air quality 3/10 Moderate 1 unhealthy d/yr today · 4 by 30 yrs out
Nearby sold comps map
Loading sold comps map…
Walkable amenities ~0.75 mi
Loading nearby amenities…
Taxation est. · year 1
- Rental income
- $32,976
- − Mortgage interest
- −$12,318
- − Property taxes
- −$3,298
- − Insurance
- −$1,100
- − Repairs & maintenance
- −$2,638
- − Management
- −$2,638
- − Depreciation
- −$6,397
- Taxable income
- $4,587
- Est. tax owed @ 24.0%
- −$1,101
- After-tax cash flow
- $6,714/yr
For passive investors: Depreciation is non-cash, so a rental often shows a tax loss while cash-flowing — sheltering income. Rental losses are passive: they offset passive income freely, and up to $25,000/yr can offset ordinary (W-2) income if you actively participate and your MAGI is under $100k (phasing out to $0 by $150k); unused losses carry forward. On sale, claimed depreciation is recaptured at up to 25%, and gains may owe capital-gains tax (a 1031 exchange can defer both). Figures are a year-1 estimate at your 24.0% rate — not tax advice; consult a CPA.
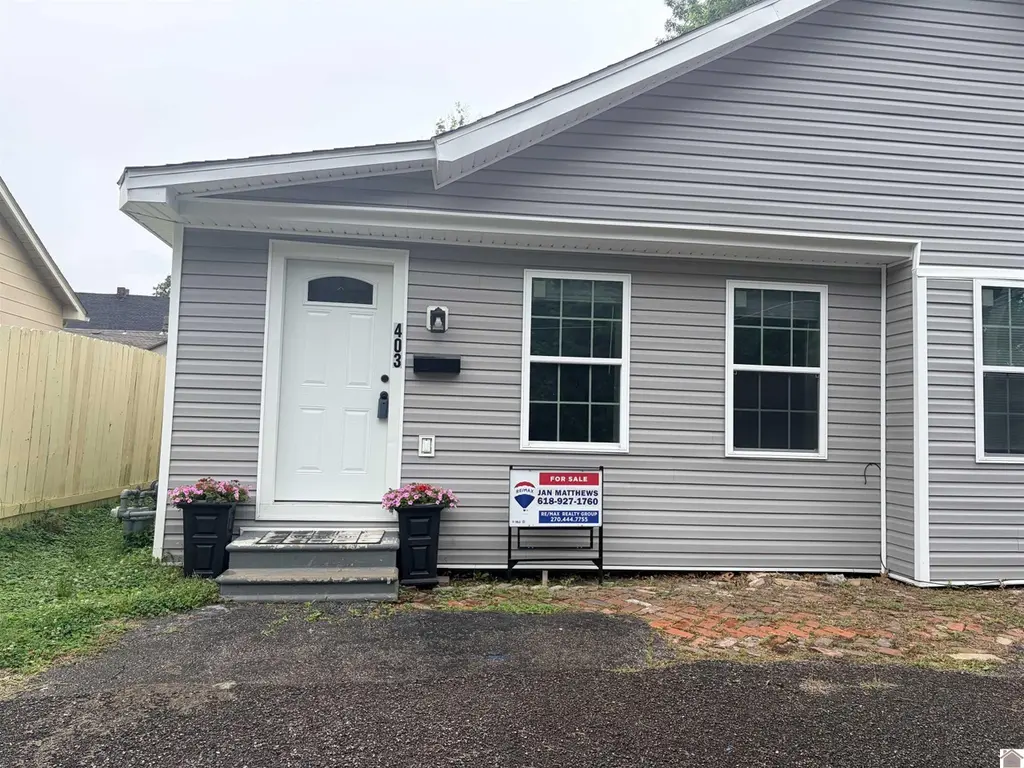
Condition & rehab AI · 1 photo
This duplex is in fair condition with some cosmetic repairs and maintenance needed. Upgrading the exterior lighting, refreshing the interior paint, and maintaining the landscaping can significantly improve its value and attract potential buyers or tenants.
Repairs flagged
- Minor exterior lighting — The exterior lighting fixture is in need of cleaning or replacement.
- Minor interior paint — The interior walls and paint show some wear and could benefit from a fresh coat.
- Minor flooring — The carpeted flooring in the visible areas shows some wear and could benefit from cleaning or replacement.
- Minor bathroom fixtures — The bathroom fixtures appear to be in fair condition but could benefit from cleaning or minor repairs.
- Minor kitchen appliances — The kitchen appliances appear to be in fair condition but could benefit from cleaning or minor repairs.
- Minor landscaping — The landscaping and curb appeal show signs of overgrowth and could benefit from trimming and maintenance.
Value-add opportunities
- Rental exterior lighting — Upgrading the exterior lighting can improve curb appeal and attract potential tenants.
- Both interior paint — Refreshing the interior paint can improve the home's appearance and increase its value.
- Both landscaping — Maintaining the landscaping can improve curb appeal and attract potential buyers or tenants.
- Both cleaning — A thorough cleaning can improve the home's appearance and attract potential buyers or tenants.
- Both minor repairs — Addressing minor repairs can improve the home's appearance and increase its value.
- Both HVAC maintenance — Maintaining the HVAC system can improve the home's comfort and attract potential buyers or tenants.
Renovation cost estimate screening
| Repair item | Severity | Est. cost |
|---|---|---|
| exterior lighting · The exterior lighting fixture is in need of cleaning or replacement. | Minor | $500–3,000 |
| interior paint · The interior walls and paint show some wear and could benefit from a fresh coat. | Minor | $500–3,000 |
| flooring · The carpeted flooring in the visible areas shows some wear and could benefit from cleaning or replacement. | Minor | $500–3,000 |
| bathroom fixtures · The bathroom fixtures appear to be in fair condition but could benefit from cleaning or minor repairs. | Minor | $500–3,000 |
| kitchen appliances · The kitchen appliances appear to be in fair condition but could benefit from cleaning or minor repairs. | Minor | $500–3,000 |
| landscaping · The landscaping and curb appeal show signs of overgrowth and could benefit from trimming and maintenance. | Minor | $500–3,000 |
| Total estimated repair cost · 6 items | $3,000–18,000 |
Value-add ROI direction
- Rental exterior lighting — Upgrading the exterior lighting can improve curb appeal and attract potential tenants. ↑
- Both interior paint — Refreshing the interior paint can improve the home's appearance and increase its value. ↑
- Both landscaping — Maintaining the landscaping can improve curb appeal and attract potential buyers or tenants. ↑
- Both cleaning — A thorough cleaning can improve the home's appearance and attract potential buyers or tenants. ↑
- Both minor repairs — Addressing minor repairs can improve the home's appearance and increase its value. ↑
- Both HVAC maintenance — Maintaining the HVAC system can improve the home's comfort and attract potential buyers or tenants. ↑
ⓘ Cost ranges are severity-bucket heuristics (US national rule-of-thumb). Get contractor quotes + a written scope before underwriting a rehab budget.
Schools (NCES district)
- District
- Paducah Independent
- NCES district ID
- 2104650
- Math proficiency
- 22% ▼ -14.00%
- Reading proficiency
- 36% ▼ -17.00%
- Median HH income
- $30,067
- Composite
- 23.41/100
- National rank
- #7896
- State rank
- #122 of 165 in KY
Livability — Paducah
- Score
- 68/100
- State rank
- #197
- US rank
- #9780
Category grades
Schools grade is shown separately in the Schools card above.
Census & demographics
- Census place
- Paducah, KY
- County
- McCracken County · 30,856 people
- City population
- 30,856
- Metro
- Paducah, KY-IL
- Population (ZIP)
- 30,856
- Household income
- $71,365
- Rent vs Own
- Severe rent burden
- 1001.0
Population outlook (McCracken County) Hauer SSP2
- Today (2025)
- 64,237 people
- By 2030
- 63,468 · -1.2%
- By 2040
- 61,221 · -4.7%
- By 2050
- 58,432 · -9.0%
- By 2075
- 52,668 · -18.0%
- By 2100
- 44,517 · -30.7%
Race, ethnicity, and origin ACS 2023
- Neighborhood character
- Predominantly White (78%)
- Race & ethnicity
- White 78% Black 13% Two or more races 6% Hispanic / Latino 2% Asian 1%
- Common ancestry
- Lithuanian 2% Italian 2% Serbian 2%
- Foreign-born
- 2% · Canada, China
- Languages at home
- 97% English-only · Spanish 1%
Political lean MEDSL · McCracken
- 2024 margin
- Solid R (+34.9) · D 31.9% · R 66.8% · Other 1.2%
- 2008→2024 swing
- -9.7pp toward R · 2008: -25.2pp · 2024: -34.9pp
- All cycles
- 2024: R+34.9 2020: R+31.7 2016: R+37.2 2012: R+32.5 2008: R+25.2
Not yet ingested
- Civics
- —
Market trends
- HPI YoY
- ▼ -85.23%
- Current HPI
- 258.1706
- Rent YoY
- —
- Metro
- Paducah, KY-IL
- State GDP YoY
- ▲ 1.81%
- F500 in state
- 4
Industry mix (Fortune 500 HQ in KY)
| Industry | F500 HQs | Revenue |
|---|---|---|
| Healthcare | 1 | $118B |
|
||
| Food / Beverage | 1 | $7B |
|
||
Price history
+20.0% since first listed4 events — show timeline
- 2026-06-01 Listed $239,900 WKRMLS
- 2025-11-19 Sold (MLS) $177,500 WKRMLS
- 2025-07-11 Relisted — WKRMLS
- 2025-06-18 Listed $200,000 WKRMLS
Cash-flow waterfall
monthlySold comps — $/sqft
last 12 mo · ≤1 miLoading sold comps…