 🏗️ New Construction
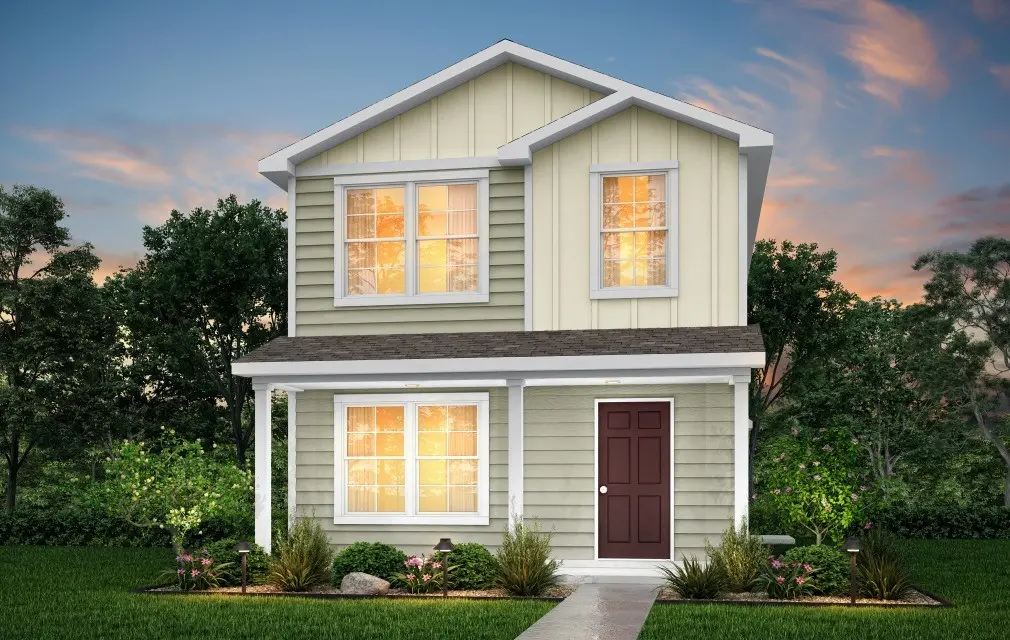
225 Dana Dr · Redland, TX
Flood risk No data
- FEMA flood zone
- —
- Chance of flooding over 30 yrs
- —
- Est. flood insurance / yr
- —
Fire risk No data
- Est. fire insurance / yr
- —
Heat risk No data
- Hot days now (above threshold)
- —
- Hot days in 30 yrs
- —
Wind risk No data
- Chance of severe wind over 30 yrs
- —
Air-quality risk No data
- Unhealthy air days now
- —
- Unhealthy air days in 30 yrs
- —
Risk factors via First Street. Map © Google.
Why this score? — see what drove the D- grade
The composite is a weighted blend of 9 inputs, each scored 0–100. Each bar is that input's sub-score; the figure is the points it added to the 100-point composite (weight × sub-score).
- Cash flow +10.2/30.0
- ARV discount +7.5/15.0
- Condition / age +4.8/5.0
- Schools +3.3/10.0
- Livability +3.3/5.0
- 1% rule +3.0/10.0
- DSCR +2.9/10.0
- Rent growth +2.5/5.0
- Appreciation +0.0/10.0
$179,990
🖨 Deal sheet 📄 Offer letter ✓ Due diligence
Listing remarks
MLS# 17326105 - Built by NHC - Ready Now! ~ The Charlotte, from our City Series is a thoughtfully designed two-story home offering 1,600 square feet of living space. Featured with 5 bedrooms and 3.5 bathrooms, this plan combines functionality with comfort. .
Key facts
- Built 2026
- Listed 22 days
Property features AI
Finance
- Other: Living area approximately 1,600; Lot measured in square feet
- Financial info: Lease not considered
- HOA & community: Association fee paid annually
Exterior
- Parking: Information not provided
- Security: Information not provided
- Utilities: Public water; Public sewer
- Home design: Residential property; New construction; 2026 construction
- Construction: Brick and cement siding exterior; Composition roof; Slab foundation; Built in 2026; Builder: NHC
- Exterior features: Located in a subdivision
Interior
- Kitchen: Dishwasher; Microwave
- Bedrooms: Information not provided
- Flooring: Carpet; Plank; Vinyl
- Bathrooms: 3 full bathrooms; 1 half bathroom
- Heating & cooling: Central heating (electric); Central air conditioning (electric)
- Interior features: Dishwasher; Microwave; No fireplaces; 7 total rooms
- Laundry & utility: Information not provided
Neighborhood map
What this means for you Summary
Snapshot
- This is a 5-bed/3.5-bath single-family listed at $180k. Condition is rated excellent.
Deal economics
- At list price, monthly cash flow is $-117 ($-1k/yr) — negative.
- The deal already cash-flows at list — no discount required.
- To meet the 1% rule (rent ≥ 1% of price), the offer needs to be $165k (8.1% below list).
- Recommended offer: $165k (8.1% below list) — sets the bar for 1% rule.
Location & tenants
- Location reads 66/100 on livability (#634 in TX) — a middle-class / working-renter tenant base. Strengths: cost of living A+, housing A+, crime A-; Watch: amenities F, commute F, health & safety D-.
- Lufkin ISD (town): math 39% / reading 39% proficiency, ranked #446 of 826 in TX (top 54%) — families likely to look elsewhere, expect single-tenant / working-renter base with shorter leases; 68% free/reduced lunch — lower-income household profile, screen leases tightly.
- Zoned schools: Brandon El (math 48% / reading 50%, grade D, #926 of 4,322 statewide, top 22%, 394 students, 71% FRL); Lufkin Middle (math 38% / reading 38%, grade F, #717 of 1,662 statewide, top 44%, 1,487 students, 89% FRL); Lufkin H S (math 49% / reading 45%, grade D-, #591 of 1,632 statewide, top 38%, 2,135 students, 85% FRL).
- Market conditions: 297 active listings in the ZIP; 120 units permitted in Angelina County in 2024 (0 in 5+ unit buildings).
- This rent runs 32% of the median local income ($63k/yr) — at the standard rent-burdened threshold; future hikes will face affordability resistance.
Forward outlook
- Local home prices are declining (-3.0%/yr); year-one equity from $1k of loan paydown is wiped out by about $6k of value loss. Plan a longer hold.
Negotiation context
- It's been on market 23 days — a 2% lower offer ($177k) is reasonable based on typical stale-listing flexibility.
- 4 sale attempts with the ask held roughly flat each time — persistent listings suggest the price (not the market) is what's stuck; bring a comps-based counter.
Questions for the listing agent
- What do current leases actually rent for vs. the listed asking? Can we see a recent rent roll and the last 12 months of T-12 income?
- Is there a deadline driving the sale (1031 exchange, divorce, estate, relocation)? That informs how much negotiation room exists.
- Schools are F-rated, which usually means shorter tenancies and higher turnover. Who's the typical renter profile here, and what's been the actual vacancy rate?
- The area grade is low — what's the realistic commute time and amenity access for the typical tenant pool here? Any planned neighborhood developments (good or bad) we should know about?
- What's the average days-on-market for RENTAL listings here right now (not sales)? A rising rental-DOM trend means longer vacancies and softer asking-rent achievability than the comps imply.
- What's the recent tenant-quality profile in this submarket — average credit score on applications, eviction rate, late-payment / NSF rate, and stable-employment percentage? A property-management company in the area should have these aggregated.
- How much new for-sale + rental construction is in the pipeline within 1–3 miles? Heavy new supply typically softens prices + rents 12–24 months out; constrained supply supports both.
Investment metrics
- 1% rule
- 0.80% ✗
- Cap rate
- 5.61%
- Cash-on-cash
- -2.43%
- DSCR
- 0.89
- GRM
- 10.4
CMA / ARV
- ARV (median comp)
- $206,031
- List price
- $179,990
- Delta
- 1.92%
- Verdict
- FAIR
- Comps
- 4 within 1.0 mi
Show comp detail 3 sales within ~0.75 mi
| Address | Dist | Beds/Ba | Sqft | Sold | Price | $/sf | Match |
|---|---|---|---|---|---|---|---|
| 140 Byrd Dr | 0.09mi | 4/2.5 (-1) | 1,686 (+5%) | 7mo | $219,900 | $130 | 72 |
| 190 Byrd Dr | 0.12mi | 4/2.5 (-1) | 1,686 (+5%) | 7mo | $219,900 | $130 | 70 |
| 379 Byrd Dr | 0.36mi | 4/2.0 (-1) | 1,595 (-0%) | 6mo | $199,900 | $125 | 67 |
Match score weights: distance 35% · size 25% · config 20% · recency 20%. Top-matched comps best support the ARV.
Projected returns pro-forma
-3.0% appreciation · 3.0% rent growth · sell at horizon
- IRR
- -20.3%
- Equity multiple
- 0.29×
- Total profit
- $-40,794
- Equity at exit
- $30,720
- IRR
- -13.4%
- Equity multiple
- 0.22×
- Total profit
- $-44,993
- Equity at exit
- $17,814
Cash invested: $57,689 (down + closing). Projections, not guarantees.
Landlord ↔ Tenant lean methodology
- Overall (STATE)
- 87 Strongly Landlord-Friendly
- State Texas
- 87 Strongly Landlord-Friendly · R+5
- County
- — inherits STATE
- City
- — inherits STATE
ZIP-level market 75901
- Home prices YoY
- -16.9%
- Active inventory
- 297
- Price-to-rent
- 9.1×
Monthly cashflow live
- Estimated rent
- $1,655 medium interval (Pro) →
- Mortgage (P&I)
- −$1,080
- Tax est. 1.5%
- −$258 /mo · $3,090/yr
- Insurance
- −$86
- HOA
- −$0
- Vacancy / Maint / Mgmt
- −$347
- Net cashflow
- $-117
Break-even live
UW: 25.0% down · 7.5% · 30yr · 1.5% tax · 5.0% vac · 8.0% maint · 8.0% mgmt
Financing live
Cash to close
- Down payment
- $51,508
- Closing costs
- $6,181
- Reserves months
- —
- Total cash needed
- —
Loan-product check · same deal, 3 products live
Conventional
25% down · 7.5% · 30yr
- Down + closing
- —
- Monthly P&I
- —
- Monthly cashflow
- —
- DSCR
- —
- Eligible?
- —
Personal DTI + credit; lowest rate.
DSCR
20% down · 8.5% · 30yr
- Down + closing
- —
- Monthly P&I
- —
- Monthly cashflow
- —
- DSCR
- —
- Eligible?
- —
No personal income docs; deal must DSCR.
Hard money
10% down · 12.0% · 12mo
- Down + closing
- —
- Monthly P&I
- —
- Monthly cashflow
- —
- DSCR
- —
- Eligible?
- —
Short-term bridge; refi at stabilization.
Listing history 25 events
-
2026-06-19days on market $179,990 Active 23 DOM
-
2026-06-18days on market $179,990 Active 22 DOM
-
2026-06-17price $179,990 Active 21 DOM
-
2026-06-17days on market $182,990 Active 21 DOM
-
2026-06-16days on market $182,990 Active 20 DOM
-
2026-06-15days on market $182,990 Active 19 DOM
-
2026-06-14days on market $182,990 Active 17 DOM
-
2026-06-13days on market $182,990 Active 16 DOM
-
2026-06-10days on market $182,990 Active 14 DOM
-
2026-06-09days on market $182,990 Active 13 DOM
-
2026-06-08days on market $182,990 Active 12 DOM
-
2026-06-07remarks 258-char remark
-
2026-06-07days on market $182,990 Active 11 DOM
-
2026-06-03days on market $182,990 Active 7 DOM
-
2026-06-03price $182,990 Active 6 DOM
-
2026-06-02days on market $184,990 Active 6 DOM
-
2026-06-01days on market $184,990 Active 5 DOM
-
2026-05-31days on market $184,990 Active 4 DOM
-
2026-05-30days on market $184,990 Active 3 DOM
-
2026-05-12historical
-
2026-04-16$209,990 Active
-
2026-04-14historical
-
2026-04-08$209,990 Active
-
2026-03-11price $209,990
-
2026-02-05$233,322 Active
ⓘ Source: listings_history table (triggers on properties + properties_extension) + one-shot
backfill from property_details.listing_events for pre-trigger history.
Nearby sold comps map
Loading sold comps map…
Walkable amenities ~0.75 mi
Loading nearby amenities…
Taxation est. · year 1
- Rental income
- $19,855
- − Mortgage interest
- −$11,541
- − Property taxes
- −$3,090
- − Insurance
- −$1,030
- − Repairs & maintenance
- −$1,588
- − Management
- −$1,588
- − Depreciation
- −$5,994
- Taxable loss
- −$4,977
- Est. tax savings @ 24.0%
- +$1,194
- After-tax cash flow
- $-206/yr
For passive investors: Depreciation is non-cash, so a rental often shows a tax loss while cash-flowing — sheltering income. Rental losses are passive: they offset passive income freely, and up to $25,000/yr can offset ordinary (W-2) income if you actively participate and your MAGI is under $100k (phasing out to $0 by $150k); unused losses carry forward. On sale, claimed depreciation is recaptured at up to 25%, and gains may owe capital-gains tax (a 1031 exchange can defer both). Figures are a year-1 estimate at your 24.0% rate — not tax advice; consult a CPA.
Condition & rehab AI · 6 photos
This home is in excellent condition with no visible repairs needed. It offers a great balance of modern amenities and curb appeal, making it an attractive investment for both resale and rental markets.
Value-add opportunities
- Both Painting the exterior and interior walls — Fresh paint enhances curb appeal and interior aesthetics.
- Both Landscaping improvements — Enhanced landscaping can increase both resale and rental value.
- Both Adding smart home features — Modern technology can increase both resale and rental appeal.
- Resale Upgrading the kitchen appliances — Modern appliances can significantly boost resale value.
- Rental Upgrading the bathrooms with smart fixtures — Smart fixtures can attract renters and increase rental value.
Renovation cost estimate screening
Value-add ROI direction
- Both Painting the exterior and interior walls — Fresh paint enhances curb appeal and interior aesthetics. ↑
- Both Landscaping improvements — Enhanced landscaping can increase both resale and rental value. ↑
- Both Adding smart home features — Modern technology can increase both resale and rental appeal. ↑
- Resale Upgrading the kitchen appliances — Modern appliances can significantly boost resale value. ↑
- Rental Upgrading the bathrooms with smart fixtures — Smart fixtures can attract renters and increase rental value. ↑
ⓘ Cost ranges are severity-bucket heuristics (US national rule-of-thumb). Get contractor quotes + a written scope before underwriting a rehab budget.
Schools (NCES district)
- District
- Lufkin ISD
- NCES district ID
- 4828550
- Math proficiency
- 39% ▼ -9.00%
- Reading proficiency
- 39% ▬ 0.00%
- Median HH income
- $41,009
- Composite
- 32.81/100
- National rank
- #5625
- State rank
- #446 of 826 in TX
Livability — Redland
- Score
- 66/100
- State rank
- #634
- US rank
- #12099
Category grades
Schools grade is shown separately in the Schools card above.
Census & demographics
- Census place
- Redland, TX
- County
- Angelina County · 62,696 people
- Metro
- Lufkin, TX
- Population (ZIP)
- 28,234
- Household income
- $62,966
- Rent vs Own
- Severe rent burden
- 930.0
Population outlook (Angelina County) Hauer SSP2
- Today (2025)
- 90,174 people
- By 2030
- 90,697 · +0.6%
- By 2040
- 91,291 · +1.2%
- By 2050
- 91,168 · +1.1%
- By 2075
- 88,961 · -1.3%
- By 2100
- 80,590 · -10.6%
Race, ethnicity, and origin ACS 2023
- Neighborhood character
- Diverse neighborhood (Simpson 0.64)
- Race & ethnicity
- White 48% Hispanic / Latino 33% Two or more races 21% Black 12% Asian 2%
- Hispanic origin (detail)
- Mexican 28%
- Common ancestry
- Lithuanian 2% Slovak 2% Italian 1%
- Foreign-born
- 14% · Canada
- Languages at home
- 72% English-only · Spanish 25% Chinese 1% Vietnamese 0%
Political lean MEDSL · Angelina
- 2024 margin
- Solid R (+52.0) · D 23.7% · R 75.7%
- 2008→2024 swing
- -17.0pp toward R · 2008: -35.0pp · 2024: -52.0pp
- All cycles
- 2024: R+52.0 2020: R+46.1 2016: R+47.3 2012: R+43.9 2008: R+35.0
Not yet ingested
- Civics
- —
Market trends
- HPI YoY
- ▼ -47.13%
- Current HPI
- 232.6282
- Rent YoY
- —
- Metro
- Lufkin, TX
- State GDP YoY
- ▲ 3.95%
- F500 in state
- 110
Industry mix (Fortune 500 HQ in TX)
| Industry | F500 HQs | Revenue |
|---|---|---|
| Energy | 16 | $1,198B |
|
||
| Technology | 5 | $198B |
|
||
| Engineering / Construction | 4 | $72B |
|
||
| Energy Services | 3 | $60B |
|
||
| Utilities | 3 | $41B |
|
||
| Healthcare | 2 | $330B |
|
||
Price history
-22.9% since first listed9 events — show timeline
- 2026-06-17 Price Changed $179,990 HARMLS
- 2026-06-02 Price Changed $182,990 HARMLS
- 2026-05-27 Listed $184,990 HARMLS
- 2026-05-12 Listing Removed — HARMLS
- 2026-04-16 Listed $209,990 HARMLS
- 2026-04-14 Listing Removed — HARMLS
- 2026-04-08 Listed $209,990 Deep East Texas MLS
- 2026-03-11 Price Changed $209,990 HARMLS
- 2026-02-05 Listed $233,322 HARMLS
Cash-flow waterfall
monthlySold comps — $/sqft
last 12 mo · ≤1 miLoading sold comps…