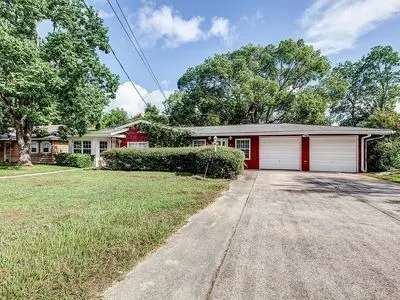
1778 Vaughn St · Biloxi, MS
Flood risk 6/10 · Moderate
- FEMA flood zone
- X (unshaded)
- Chance of flooding over 30 yrs
- 0.7%
- Est. flood insurance / yr
- $507 – $1,088
Fire risk 1/10 · Minimal
- Est. fire insurance / yr
- $1,241 – $2,305
Heat risk 10/10 · Severe
- Hot days now (above 106°F)
- 7 days/yr
- Hot days in 30 yrs
- 23 days/yr
Wind risk 9/10 · Severe
- Chance of severe wind over 30 yrs
- 99.0%
Air-quality risk 2/10 · Minimal
- Unhealthy air days now
- 1 days/yr
- Unhealthy air days in 30 yrs
- 2 days/yr
Risk factors via First Street. Map © Google.
Why this score? — see what drove the F grade
The composite is a weighted blend of 9 inputs, each scored 0–100. Each bar is that input's sub-score; the figure is the points it added to the 100-point composite (weight × sub-score).
- Cash flow +11.5/30.0
- Schools +4.5/10.0
- Livability +4.0/5.0
- DSCR +3.4/10.0
- 1% rule +2.7/10.0
- Rent growth +2.5/5.0
- Condition / age +2.5/5.0
- ARV discount +1.9/15.0
- Appreciation +0.0/10.0
$240,000
🖨 Deal sheet (PDF) 📄 Offer letter ✓ Due diligence
Listing remarks MLS
Property contains second parcel: 1210G-01-002.003. Please see attached floor plan in photo section. Huge yard and convenient location, this property has tons of potential. New paint, fixtures, appliances, carpet and some other updating. Attached two car garage and detached one car/workshop. Call today for your appointment.''Click the ''Matterport'' link below to see the floor plan and interactively walk through this home in 3D! It looks and feels like you are actually walking through the home! https://my.matterport.com/show/?m=7MxoPQq9E46&brand=0
Key facts
- Huge yard
- New carpet
- New paint
Tags
Neighborhood map
What this means for you Summary
Snapshot
- This is a 4-bed/2.0-bath single-family listed at $240k.
Deal economics
- At list price, monthly cash flow is $-80 ($-964/yr) — negative.
- To cash-flow at today's rent, offer at most $226k (5.9% below list).
- To meet the 1% rule (rent ≥ 1% of price), the offer needs to be $186k (22.7% below list).
- Recommended offer: $186k (22.7% below list) — sets the bar for 1% rule.
- Cap rate 5.9% vs local median 3.5% in Biloxi — top-decile yield for the area; either an underpriced asset or a hidden risk that comps aren't pricing in. Stress-test before assuming the spread holds.
Location & tenants
- Location reads 79/100 on livability (#6 in MS, #2,141 nationally) — a middle-class / working-renter tenant base. Strengths: crime A+, cost of living A+, housing A+; Watch: commute D+, amenities F, employment D-.
- Biloxi Public School District (urban): math 60% / reading 48% proficiency, ranked #7 of 130 in MS (top 5%) — acceptable for families but not a draw, mixed tenant base, ~2y average lease.
- Zoned schools: Back Bay Elementary School (math 51% / reading 50%, grade D+, #59 of 375 statewide, top 16%, 535 students, 99% FRL); Biloxi Junior High (math 60% / reading 43%, grade C, #27 of 179 statewide, top 16%, 881 students, 100% FRL); Biloxi High School (math 65% / reading 53%, grade C+, #7 of 197 statewide, top 3%, 1,728 students, 100% FRL) — zoned schools average 100% FRL vs 59% district-wide (40 pts higher); higher-poverty schools than district average — tighter screening recommended.
- Market conditions: Rents flat; 201 active listings in the ZIP; 10 comparable units currently listed for rent nearby; rentals lingering (median 46d on market — plan ~5-8 weeks vacancy on turnover, expect pricing pressure); 50% of comp listings sitting > 30 days — soft ceiling on asking rent; 2,194 units permitted in Harrison County in 2024 (0 in 5+ unit buildings).
- This rent runs 41% of the median local income ($54k/yr) — at the standard rent-burdened threshold; future hikes will face affordability resistance.
Forward outlook
- Local home prices are declining (-3.0%/yr); year-one equity from $2k of loan paydown is wiped out by about $7k of value loss. Plan a longer hold.
- Harrison County population projected at +27% by 2050 — long-run rental-demand tailwind backs the buy-and-hold thesis.
Negotiation context
- It's been on market 16 days — a 2% lower offer ($236k) is reasonable based on typical stale-listing flexibility.
- 3 sale attempts since 10y ago with the ask held roughly flat each time — persistent listings suggest the price (not the market) is what's stuck; bring a comps-based counter.
- Current owner paid $127k; list at $240k implies a 89% gain — meaningful room to come down on a strong offer.
Risks & watch-outs
- Watch-outs: built in 1953 — expect roof / HVAC / electrical / plumbing capex.
- Climate carrying-cost: major flood risk; severe wind risk, 99% chance of damaging wind over 30y; extreme-heat days projected 7→23/yr by 2055 (HVAC capex compounding) — expect insurance premiums to compound above CPI over the hold.
Questions for the listing agent
- What do current leases actually rent for vs. the listed asking? Can we see a recent rent roll and the last 12 months of T-12 income?
- Built in 1953 — when were the roof, HVAC, electrical panel, plumbing, and water heater last replaced?
- Is there a deadline driving the sale (1031 exchange, divorce, estate, relocation)? That informs how much negotiation room exists.
- The area grade is low — what's the realistic commute time and amenity access for the typical tenant pool here? Any planned neighborhood developments (good or bad) we should know about?
- What's the average days-on-market for RENTAL listings here right now (not sales)? A rising rental-DOM trend means longer vacancies and softer asking-rent achievability than the comps imply.
- What's the recent tenant-quality profile in this submarket — average credit score on applications, eviction rate, late-payment / NSF rate, and stable-employment percentage? A property-management company in the area should have these aggregated.
- How much new for-sale + rental construction is in the pipeline within 1–3 miles? Heavy new supply typically softens prices + rents 12–24 months out; constrained supply supports both.
Investment metrics
- 1% rule
- 0.77% ✗
- Cap rate
- 5.89%
- Cash-on-cash
- -1.44%
- DSCR
- 0.94
- GRM
- 10.8
CMA / ARV
- ARV (on-the-fly)
- $213,375
- Comps found
- 12
Show comp detail 12 sales within ~0.75 mi
| Address | Dist | Beds/Ba | Sqft | Sold | Price | $/sf | Match |
|---|---|---|---|---|---|---|---|
| 1775 Currie St | 0.09mi | 3/2.0 (-1) | 1,630 (-4%) | 6mo | $145,000 | $89 | 78 |
| 1713 James Madison Dr | 0.36mi | 3/2.0 (-1) | 1,600 (-6%) | 1mo | $211,000 | $132 | 67 |
| 1732 Thomas Jefferson Dr | 0.27mi | 3/2.0 (-1) | 1,768 (+4%) | 12mo | $215,000 | $122 | 66 |
| 257 Beeman Dr | 0.33mi | 3/2.0 (-1) | 1,600 (-6%) | 6mo | $199,000 | $124 | 64 |
| 1616 Saint Ann Ave | 0.57mi | 3/2.0 (-1) | 1,645 (-4%) | 2mo | $219,900 | $134 | 61 |
| 266 Beeman Dr | 0.31mi | 3/1.0 (-1) | 1,636 (-4%) | 12mo | $189,500 | $116 | 59 |
| 1604 Lewis Ave | 0.61mi | 4/2.0 | 1,635 (-4%) | 6mo | $204,000 | $125 | 59 |
| 313 Hiller Dr | 0.48mi | 4/1.5 | 1,576 (-8%) | 7mo | $178,000 | $113 | 57 |
| 1752 James Buchanan Dr | 0.14mi | 3/2.0 (-1) | 1,488 (-13%) | 16mo | $198,000 | $133 | 54 |
| 1618 Gordon Ave | 0.59mi | 3/2.0 (-1) | 1,796 (+5%) | 11mo | $159,900 | $89 | 50 |
| 1736 Thomas Jefferson Dr | 0.26mi | 3/2.0 (-1) | 1,482 (-13%) | 13mo | $187,000 | $126 | 50 |
| 1648 Hollywood Blvd | 0.52mi | 3/2.0 (-1) | 1,489 (-13%) | 4mo | $189,000 | $127 | 46 |
Match score weights: distance 35% · size 25% · config 20% · recency 20%. Top-matched comps best support the ARV.
Projected returns pro-forma
-3.0% appreciation · 0.05% rent growth · sell at horizon
- IRR
- -21.8%
- Equity multiple
- 0.26×
- Total profit
- $-49,401
- Equity at exit
- $35,785
- IRR
- -24.1%
- Equity multiple
- -0.05×
- Total profit
- $-70,477
- Equity at exit
- $20,751
Cash invested: $67,200 (down + closing). Projections, not guarantees.
Landlord ↔ Tenant lean methodology
- Overall (STATE)
- 90 Strongly Landlord-Friendly
- State Mississippi
- 90 Strongly Landlord-Friendly · R+11
- County
- — inherits STATE
- City
- — inherits STATE
ZIP-level market 39531
- Home prices YoY
- -13.0%
- Rents YoY
- 0.1%
- Active inventory
- 201
- Price-to-rent
- 10.8×
Monthly cashflow live
- Estimated rent
- $1,856 high interval (Pro) →
- Mortgage (P&I)
- −$1,259
- Tax from tax record
- −$188 /mo · $2,258/yr
- Insurance
- −$100
- HOA
- −$0
- Vacancy / Maint / Mgmt
- −$390
- Net cashflow
- $-80
Break-even live
Sensitivity live
| Price | -10% $55 | -5% $-12 | +0% $-80 | +5% $-148 | +10% $-216 |
|---|---|---|---|---|---|
| Rent | -10% $-227 | -5% $-154 | +0% $-80 | +5% $-7 | +10% $66 |
| Rate | -1.0pp $41 | -0.5pp $-19 | base $-80 | +0.5pp $-143 | +1.0pp $-206 |
UW: 25.0% down · 7.5% · 30yr · 1.5% tax · 5.0% vac · 8.0% maint · 8.0% mgmt
Financing live
Cash to close
- Down payment
- $60,000
- Closing costs
- $7,200
- Reserves months
- —
- Total cash needed
- —
Loan-product check · same deal, 3 products live
Conventional
25% down · 7.5% · 30yr
- Down + closing
- —
- Monthly P&I
- —
- Monthly cashflow
- —
- DSCR
- —
- Eligible?
- —
Personal DTI + credit; lowest rate.
DSCR
20% down · 8.5% · 30yr
- Down + closing
- —
- Monthly P&I
- —
- Monthly cashflow
- —
- DSCR
- —
- Eligible?
- —
No personal income docs; deal must DSCR.
Hard money
10% down · 12.0% · 12mo
- Down + closing
- —
- Monthly P&I
- —
- Monthly cashflow
- —
- DSCR
- —
- Eligible?
- —
Short-term bridge; refi at stabilization.
Rent comps 10 comps
| Address | Beds | Baths | Sqft | Rent | $/sqft | DOM | Units | Dist |
|---|---|---|---|---|---|---|---|---|
| 1737 James Buchanan Dr Biloxi, MS | 3.0 | 2.0 | 1328 | $1,650 | $1.24 | 45d | 1 | 0.18mi |
| 270 Rodenberg Ave Biloxi, MS | 3.0 | 2.0 | 1180 | $1,100 | $0.93 | 45d | 1 | 0.48mi |
| 340 Hiller Dr Biloxi, MS | 3.0 | 2.0 | 1447 | $1,749 | $1.21 | 22d | 1 | 0.51mi |
| 1713 Stevens St Unit A Biloxi, MS | 3.0 | 2.0 | 1100 | $1,300 | $1.18 | 22d | 1 | 0.58mi |
| 1805 Irish Hill Dr #4 Biloxi, MS | 3.0 | 2.0 | 1600 | $2,400 | $1.50 | 45d | 1 | 0.61mi |
| 187 Bilmarsan Dr Biloxi, MS | 3.0 | 2.0 | 1850 | $2,670 | $1.44 | 45d | 1 | 0.80mi |
| 1623 Cayman Cv Biloxi, MS | 3.0 | 2.0 | 1397 | $3,700 | $2.65 | 15d | 1 | 1.02mi |
| 310 Abbey Ct Biloxi, MS | 2.0–3.0 | 1.0–2.0 | 1062 | $1,275 | $1.20 | 22d | 17 | 1.28mi |
| 630 Bay Cove Dr Biloxi, MS | 2.0–3.0 | 2.0 | 1780 | $3,450 | $1.94 | 45d | 2 | 1.37mi |
| 2611 Heidi LN Biloxi, MS | 3.0 | 2.5 | 1550 | $1,775 | $1.15 | 22d | 1 | 1.39mi |
Listing history 11 events
-
2026-06-21days on market $240,000 Active 16 DOM
-
2026-06-18days on market $240,000 Active 13 DOM
-
2026-06-17days on market $240,000 Active 12 DOM
-
2026-06-16days on market $240,000 Active 11 DOM
-
2026-06-15days on market $240,000 Active 10 DOM
-
2026-06-14days on market $240,000 Active 8 DOM
-
2026-06-13days on market $240,000 Active 7 DOM
-
2026-06-09days on market $240,000 Active 4 DOM
-
2026-06-08days on market $240,000 Active 3 DOM
-
2026-06-07remarks 221-char remark
-
2026-06-07$240,000 Active 2 DOM
ⓘ Source: listings_history table (triggers on properties + properties_extension) + one-shot
backfill from property_details.listing_events for pre-trigger history.
Tax reassessment forecast MS · Resets to sale price
- Current annual tax
- $2,258 · $188/mo
- Projected year-2 tax
- $2,258 · $188/mo
- Expected delta
- $0/yr ($0/mo · 0.0%)
ⓘ Screening estimate from a state-policy table — verify with the county assessor before closing.
Climate risk First Street
- Flood 6/10 Major FEMA zone X (unshaded) · 70% chance over 30 yrs
- Wildfire 1/10 Low
- Heat 10/10 Extreme 7 d/yr ≥106°F today · 23 d/yr by 30 yrs out
- Wind 9/10 Extreme 99% chance of damaging wind over 30 yrs
- Air quality 2/10 Low 1 unhealthy d/yr today · 2 by 30 yrs out
Nearby sold comps map
Loading sold comps map…
Walkable amenities ~0.75 mi
Loading nearby amenities…
Taxation est. · year 1
- Rental income
- $22,274
- − Mortgage interest
- −$13,444
- − Property taxes
- −$2,258
- − Insurance
- −$1,200
- − Repairs & maintenance
- −$1,782
- − Management
- −$1,782
- − Depreciation
- −$6,982
- Taxable loss
- −$5,173
- Est. tax savings @ 24.0%
- +$1,242
- After-tax cash flow
- $277/yr
For passive investors: Depreciation is non-cash, so a rental often shows a tax loss while cash-flowing — sheltering income. Rental losses are passive: they offset passive income freely, and up to $25,000/yr can offset ordinary (W-2) income if you actively participate and your MAGI is under $100k (phasing out to $0 by $150k); unused losses carry forward. On sale, claimed depreciation is recaptured at up to 25%, and gains may owe capital-gains tax (a 1031 exchange can defer both). Figures are a year-1 estimate at your 24.0% rate — not tax advice; consult a CPA.
Schools (NCES district)
- District
- Biloxi Public School District
- NCES district ID
- 2800630
- Math proficiency
- 60% ▼ -7.00%
- Reading proficiency
- 48% ▼ -3.00%
- Median HH income
- $40,608
- Composite
- 45.26/100
- National rank
- #2657
- State rank
- #7 of 130 in MS
Livability — Biloxi
- Score
- 79/100
- State rank
- #6
- US rank
- #2141
Category grades
Schools grade is shown separately in the Schools card above.
Census & demographics
- Census place
- Biloxi, MS
- County
- Harrison County · 178,171 people
- City population
- 63,281
- Metro
- Gulfport-Biloxi, MS
- Population (ZIP)
- 18,918
- Household income
- $54,218
- Rent vs Own
- Severe rent burden
- 1110.0
Population outlook (Harrison County) Hauer SSP2
- Today (2025)
- 228,444 people
- By 2030
- 241,942 · +5.9%
- By 2040
- 267,531 · +17.1%
- By 2050
- 291,062 · +27.4%
- By 2075
- 346,711 · +51.8%
- By 2100
- 378,165 · +65.5%
Race, ethnicity, and origin ACS 2023
- Neighborhood character
- Diverse neighborhood (Simpson 0.60)
- Race & ethnicity
- White 60% Black 18% Two or more races 12% Hispanic / Latino 11% Asian 2%
- Hispanic origin (detail)
- Mexican 5%
- Common ancestry
- Lithuanian 6% Slovak 2% Serbian 1%
- Foreign-born
- 8% · Canada, Vietnam
- Languages at home
- 89% English-only · Spanish 6% Arabic 1% Other Indo-European 1%
Political lean MEDSL · Harrison
- 2024 margin
- Strong R (+28.9) · D 35.0% · R 63.9% · Other 1.1%
- 2008→2024 swing
- -2.9pp toward R · 2008: -26.0pp · 2024: -28.9pp
- All cycles
- 2024: R+28.9 2020: R+25.2 2016: R+30.7 2012: R+26.6 2008: R+26.0
Not yet ingested
- Civics
- —
Market trends
- HPI YoY
- ▼ -28.97%
- Current HPI
- 193.4018
- Rent YoY
- ▬ 0.05%
- Metro
- Gulfport-Biloxi, MS
- State GDP YoY
- —
- F500 in state
- 0
Price history
+286.5% since first listed7 events — show timeline
- 2026-06-06 Listed $240,000 FSBO.com
- 2018-10-04 Sold (Public Records) $126,800 Public Records
- 2018-10-01 Sold (MLS) — MLSU
- 2018-08-05 Listed $135,000 MLSU
- 2017-01-31 Sold (Public Records) $55,000 Public Records
- 2017-01-27 Sold (MLS) — MLSU
- 2016-08-01 Listed $62,100 MLSU
Property tax history
+33.3%/yrLatest (2025): $2,258 · +11.0% YoY. Source: county tax records.
Cash-flow waterfall
monthlySold comps — $/sqft
last 12 mo · ≤1 miLoading sold comps…