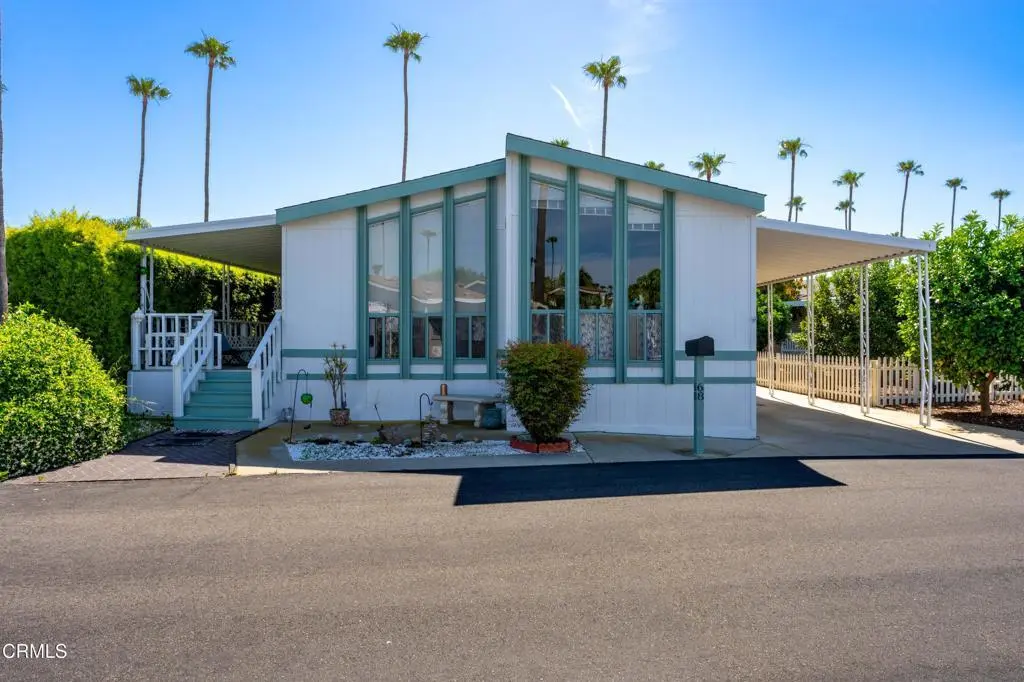
1215 Anchors Way Dr #68 · San Buenaventura (Ventura), CA
Flood risk 1/10 · Minimal
- FEMA flood zone
- X (unshaded)
- Chance of flooding over 30 yrs
- 0.0%
- Est. flood insurance / yr
- $507 – $1,088
Fire risk 4/10 · Minor
- Est. fire insurance / yr
- $659 – $1,223
Heat risk 4/10 · Minor
- Hot days now (above 85°F)
- 7 days/yr
- Hot days in 30 yrs
- 17 days/yr
Wind risk 1/10 · Minimal
- Chance of severe wind over 30 yrs
- —
Air-quality risk 7/10 · Major
- Unhealthy air days now
- 12 days/yr
- Unhealthy air days in 30 yrs
- 12 days/yr
Risk factors via First Street. Map © Google.
Why this score? — see what drove the D grade
The composite is a weighted blend of 9 inputs, each scored 0–100. Each bar is that input's sub-score; the figure is the points it added to the 100-point composite (weight × sub-score).
- ARV discount +15.0/15.0
- Cash flow +9.3/30.0
- Schools +3.7/10.0
- Rent growth +3.2/5.0
- 1% rule +2.8/10.0
- DSCR +2.6/10.0
- Livability +2.5/5.0
- Condition / age +2.5/5.0
- Appreciation +0.0/10.0
$485,000
🖨 Deal sheet (PDF) 📄 Offer letter ✓ Due diligence
Listing remarks
Enjoy the Ventura Marina Lifestyle in this 2 bedroom plus den/office and 2 bathrooms. * * Recently installed wood laminate flooring for that easy care lifestyle * * Includes refrigerator, washer and dryer and Outdoor storage shed * * If you are looking for quiet community with relaxed living, great weather and an ocean breeze come see for yourself. You will also find that Rent Control is in effect to help keep costs down. The park amenities include a large clubhouse, billiards room, card rooms, shuffle board, heated pool & jacuzzi and a coming soon fitness room * *
Key facts
- Shuffle board
- Billiards room
- Card rooms
Tags
Property features AI
Finance
- Other: Rent includes pool and sewer (for leased arrangements)
- Financial info: Monthly land lease amount (seller-provided)
- HOA & community: Located in a senior community; Suburban neighborhood; Land lease community (land lease paid monthly)
Exterior
- Parking: Carport parking (2 spaces); Driveway-level access; Total 2 parking spaces; Park name: Ventura Marina MHP
- Utilities: Public/district water (connected/available); Public sewer (connected/available); Electricity connected and available; Natural gas connected and available
- Home design: Mobile home (model SC525A3) on site; Double body type; Single story; Faces north; Entry level: 1
- Construction: Wood construction; Composition roof; Mobile dimensions approximately 12' x 56'
- Exterior features: Deck; Association in-ground heated exercise pool; No fencing; Sprinklers: none
Interior
- Kitchen: Corian counters; Gas range; Microwave; Refrigerator; Dishwasher; Water heater unit
- Bedrooms: Primary bedroom on main floor; All bedrooms on lower/main level
- Flooring: Laminated flooring
- Bathrooms: One full bath on main floor; One 3/4 bath with bathtub and shower
- Heating & cooling: Central furnace
- Interior features: Corian counters; Formica counters; Blinds; One-level home; Entry on main level; Association in-ground spa
- Laundry & utility: Inside laundry room; Washer and dryer included; Washer hookup
Neighborhood map
What this means for you Summary
Snapshot
- This is a 2-bed/2.0-bath manufactured listed at $485k.
Deal economics
- At list price, monthly cash flow is $-356 ($-4k/yr) — negative.
- To cash-flow at today's rent, offer at most $433k (10.6% below list).
- To meet the 1% rule (rent ≥ 1% of price), the offer needs to be $379k (21.8% below list).
- Recommended offer: $379k (21.8% below list) — sets the bar for 1% rule.
- Cap rate 5.4% vs local median 2.4% in San Buenaventura (Ventura) — top-decile yield for the area; either an underpriced asset or a hidden risk that comps aren't pricing in. Stress-test before assuming the spread holds.
Location & tenants
- Location reads: area grade D — affects rentability + tenant quality, not the cash-flow math above.
- Ventura Unified (urban): math 33% / reading 48% proficiency, ranked #218 of 517 in CA (top 42%) — families likely to look elsewhere, expect single-tenant / working-renter base with shorter leases.
- Zoned schools: Pierpont Elementary (math 47% / reading 57%, grade C-, #354 of 1,571 statewide, top 24%, 289 students, 35% FRL); Cabrillo Middle (math 37% / reading 55%, grade D+, #122 of 498 statewide, top 25%, 801 students, 40% FRL); Ventura High (math 27% / reading 62%, grade F, #434 of 1,170 statewide, top 39%, 2,095 students, 56% FRL) — zoned schools at 44% FRL track the district average.
- Market conditions: Rents rising (+2.8%/yr); 119 active listings in the ZIP; 23 comparable units currently listed for rent nearby; rentals at typical pace (median 26d on market — plan ~3-4 weeks tenant-placement turnaround); 48% of comp listings sitting > 30 days — soft ceiling on asking rent; solid renter incomes; 1,759 units permitted in Ventura County in 2024 (1,196 in 5+ unit buildings).
- At $3,792/mo this rent would consume 52% of the median local household income ($88k/yr) (locally 1724% of renters already pay >50% of income on rent) — very limited rent-growth headroom before tenants either downsize or default.
Forward outlook
- Local home prices are declining (-3.0%/yr); year-one equity from $3k of loan paydown is wiped out by about $15k of value loss. Plan a longer hold.
- Ventura County population projected at +4% by 2050 — modest demand growth; plan on rents tracking national, not racing it.
Negotiation context
- It's been on market 65 days — a 6% lower offer ($456k) is reasonable based on typical stale-listing flexibility.
- 4 sale attempts since 24y ago with the ask held roughly flat each time — persistent listings suggest the price (not the market) is what's stuck; bring a comps-based counter.
Questions for the listing agent
- What do current leases actually rent for vs. the listed asking? Can we see a recent rent roll and the last 12 months of T-12 income?
- It's been on market 65 days. Have you received any prior offers? Is the seller open to a 22% concession, seller financing, or rate buy-down credit?
- Why hasn't it sold? Are there any deal-killer items the seller is aware of (foundation, flood, title, zoning, code violations)?
- Is there a deadline driving the sale (1031 exchange, divorce, estate, relocation)? That informs how much negotiation room exists.
- The area grade is low — what's the realistic commute time and amenity access for the typical tenant pool here? Any planned neighborhood developments (good or bad) we should know about?
- What's the average days-on-market for RENTAL listings here right now (not sales)? A rising rental-DOM trend means longer vacancies and softer asking-rent achievability than the comps imply.
- What's the recent tenant-quality profile in this submarket — average credit score on applications, eviction rate, late-payment / NSF rate, and stable-employment percentage? A property-management company in the area should have these aggregated.
- How much new for-sale + rental construction is in the pipeline within 1–3 miles? Heavy new supply typically softens prices + rents 12–24 months out; constrained supply supports both.
Investment metrics
- 1% rule
- 0.78% ✗
- Cap rate
- 5.41%
- Cash-on-cash
- -3.15%
- DSCR
- 0.86
- GRM
- 10.7
CMA / ARV
- ARV (median comp)
- $605,000
- List price
- $485,000
- Delta
- -19.83%
- Verdict
- UNDERPRICED
- Comps
- 9 within 1.0 mi
Show comp detail 12 sales within ~0.75 mi
| Address | Dist | Beds/Ba | Sqft | Sold | Price | $/sf | Match |
|---|---|---|---|---|---|---|---|
| 1215 Anchors Way Dr #42 | 0.07mi | 2/2.0 | 1,300 (+0%) | 4mo | $605,000 | $465 | 93 |
| 1215 Anchors Way Dr #124 | 0.05mi | 3/2.0 (+1) | 1,344 (+4%) | 7mo | $495,000 | $368 | 81 |
| 1215 Anchors Way Dr #202 | 0.22mi | 2/2.0 | 1,344 (+4%) | 5mo | $520,000 | $387 | 80 |
| 1215 Anchors Way #104 | 0.12mi | 2/2.0 | 1,248 (-4%) | 14mo | $624,000 | $500 | 76 |
| 1215 Anchors Way #32 | 0.06mi | 2/2.0 | 1,344 (+4%) | 19mo | $525,000 | $391 | 75 |
| 1215 Anchors Way #26 | 0.08mi | 2/2.0 | 1,466 (+13%) | 1mo | $605,000 | $413 | 73 |
| 1215 Anchors Way Dr. Spc 289 | 0.16mi | 2/2.0 | 1,400 (+8%) | 8mo | $500,000 | $357 | 72 |
| 1215 Anchors Way Dr #65 | 0.03mi | 3/2.0 (+1) | 1,460 (+13%) | 6mo | $647,000 | $443 | 68 |
| 1215 Anchors Way Dr #307 | 0.20mi | 2/2.0 | 1,250 (-4%) | 22mo | $565,000 | $452 | 66 |
| 1215 Anchors Way Dr #187 | 0.19mi | 2/2.0 | 1,368 (+6%) | 19mo | $415,000 | $303 | 66 |
| 1215 Anchors Way Dr #1 | 0.10mi | 2/2.0 | 1,484 (+14%) | 14mo | $613,305 | $413 | 60 |
| 1215 Anchors Way Dr #15 | 0.12mi | 2/2.0 | 1,440 (+11%) | 24mo | $630,000 | $438 | 56 |
Match score weights: distance 35% · size 25% · config 20% · recency 20%. Top-matched comps best support the ARV.
Projected returns pro-forma
-3.0% appreciation · 2.8% rent growth · sell at horizon
- IRR
- -21.8%
- Equity multiple
- 0.25×
- Total profit
- $-101,979
- Equity at exit
- $72,315
- IRR
- -16.0%
- Equity multiple
- 0.11×
- Total profit
- $-120,890
- Equity at exit
- $41,934
Cash invested: $135,800 (down + closing). Projections, not guarantees.
Landlord ↔ Tenant lean methodology
- Overall (STATE)
- 18 Strongly Tenant-Friendly
- State California
- 18 Strongly Tenant-Friendly · D+13
- County
- — inherits STATE
- City
- — inherits STATE
ZIP-level market 93001
- Rents YoY
- 2.8%
- Active inventory
- 119
- Price-to-rent
- 10.7×
Monthly cashflow live
- Estimated rent
- $3,792 high interval (Pro) →
- Mortgage (P&I)
- −$2,543
- Tax est. 1.5%
- −$606 /mo · $7,275/yr
- Insurance
- −$202
- HOA
- −$0
- Vacancy / Maint / Mgmt
- −$796
- Net cashflow
- $-356
Break-even live
Sensitivity live
| Price | -10% $-21 | -5% $-189 | +0% $-356 | +5% $-524 | +10% $-691 |
|---|---|---|---|---|---|
| Rent | -10% $-656 | -5% $-506 | +0% $-356 | +5% $-206 | +10% $-57 |
| Rate | -1.0pp $-112 | -0.5pp $-233 | base $-356 | +0.5pp $-482 | +1.0pp $-610 |
UW: 25.0% down · 7.5% · 30yr · 1.5% tax · 5.0% vac · 8.0% maint · 8.0% mgmt
Financing live
Cash to close
- Down payment
- $121,250
- Closing costs
- $14,550
- Reserves months
- —
- Total cash needed
- —
Loan-product check · same deal, 3 products live
Conventional
25% down · 7.5% · 30yr
- Down + closing
- —
- Monthly P&I
- —
- Monthly cashflow
- —
- DSCR
- —
- Eligible?
- —
Personal DTI + credit; lowest rate.
DSCR
20% down · 8.5% · 30yr
- Down + closing
- —
- Monthly P&I
- —
- Monthly cashflow
- —
- DSCR
- —
- Eligible?
- —
No personal income docs; deal must DSCR.
Hard money
10% down · 12.0% · 12mo
- Down + closing
- —
- Monthly P&I
- —
- Monthly cashflow
- —
- DSCR
- —
- Eligible?
- —
Short-term bridge; refi at stabilization.
Rent comps 23 comps
| Address | Beds | Baths | Sqft | Rent | $/sqft | DOM | Units | Dist |
|---|---|---|---|---|---|---|---|---|
| 1196 Portside Dr Ventura, CA | 1.0–2.0 | 1.0–2.5 | 1475 | $4,372 | $2.96 | 3d | 13 | 0.20mi |
| 3135 Harbor Blvd Ventura, CA | 2.0 | 1.5 | 1741 | $3,500 | $2.01 | 3d | 1 | 0.23mi |
| 928 Seaside Ct Ventura, CA | 3.0 | 2.0 | 1584 | $5,000 | $3.16 | 45d | 1 | 0.62mi |
| 2767 Harbor Blvd Ventura, CA | 2.0 | 1.5 | 1046 | $3,500 | $3.35 | 45d | 1 | 0.63mi |
| 1251 Devon Ln Ventura, CA | 3.0 | 2.0 | 1532 | $5,500 | $3.59 | 45d | 1 | 0.74mi |
| 2598 Seahorse Ave Unit A Ventura, CA | 3.0 | 2.0 | 1400 | $3,950 | $2.82 | 45d | 1 | 0.79mi |
| 3098 Channel Dr Ventura, CA | 2.0 | 1.0 | 995 | $2,795 | $2.81 | 3d | 1 | 0.82mi |
| 517 Valmore Ave Ventura, CA | 3.0 | 1.5 | 1225 | $3,900 | $3.18 | 5d | 1 | 0.98mi |
| 2407 Pierpont Blvd Ventura, CA | 2.0 | 1.0 | 902 | $4,750 | $5.27 | 45d | 1 | 1.03mi |
| 2393 Pierpont Blvd Ventura, CA | 3.0 | 2.5 | 1512 | $5,800 | $3.84 | 25d | 1 | 1.04mi |
| 3357 Rexford St Ventura, CA | 2.0 | 2.0 | 1050 | $2,675 | $2.55 | 4d | 1 | 1.06mi |
| 3357 Rexford St Ventura, CA | 2.0 | 2.0 | 1050 | $2,675 | $2.55 | 5d | 1 | 1.06mi |
| 3357 Rexford St Ventura, CA | 2.0 | 2.0 | 1050 | $2,795 | $2.66 | 45d | 1 | 1.06mi |
| 3351 Rexford St Ventura, CA | 2.0 | 2.0 | 1050 | $2,675 | $2.55 | 5d | 1 | 1.06mi |
| 3364 Preble Ave Ventura, CA | 2.0 | 2.0 | 930 | $2,895 | $3.11 | 45d | 1 | 1.09mi |
| 401 Rancho Dr Ventura, CA | 3.0 | 2.0 | 1093 | $5,500 | $5.03 | 45d | 1 | 1.16mi |
| 618 Kirk Ave Unit 618 Ventura, CA | 2.0 | 1.0 | 910 | $2,395 | $2.63 | 25d | 1 | 1.18mi |
| 1083 Montauk Ln Unit 2 Ventura, CA | 1.0 | 1.0 | 1000 | $3,550 | $3.55 | 45d | 1 | 1.19mi |
| 1088 Bangor Ln Ventura, CA | 3.0 | 1.5 | 1390 | $4,995 | $3.59 | 18d | 1 | 1.28mi |
| 1089 Belfast Ln Ventura, CA | 3.0 | 2.0 | 1024 | $5,500 | $5.37 | 18d | 1 | 1.34mi |
| 1089 Belfast Ln Ventura, CA | 3.0 | 2.0 | 1024 | $5,900 | $5.76 | 45d | 1 | 1.34mi |
| 3700 Dean Dr Ventura, CA | 2.0 | 2.0 | 1178 | $2,900 | $2.46 | 5d | 2 | 1.44mi |
| 3700 Dean Dr Ventura, CA | 2.0 | 2.0 | 1173 | $2,925 | $2.49 | 45d | 2 | 1.44mi |
Listing history 30 events
-
2026-06-21days on market $485,000 Active 65 DOM
-
2026-06-18days on market $485,000 Active 62 DOM
-
2026-06-17days on market $485,000 Active 61 DOM
-
2026-06-16days on market $485,000 Active 60 DOM
-
2026-06-15days on market $485,000 Active 59 DOM
-
2026-06-13days on market $485,000 Active 57 DOM
-
2026-06-13days on market $485,000 Active 56 DOM
-
2026-06-10days on market $485,000 Active 54 DOM
-
2026-06-09days on market $485,000 Active 53 DOM
-
2026-06-08days on market $485,000 Active 52 DOM
-
2026-06-07days on market $485,000 Active 51 DOM
-
2026-06-05days on market $485,000 Active 48 DOM
-
2026-06-03days on market $485,000 Active 47 DOM
-
2026-06-02days on market $485,000 Active 46 DOM
-
2026-06-01days on market $485,000 Active 45 DOM
-
2026-05-31days on market $485,000 Active 44 DOM
-
2026-04-17$485,000 Active 590-char remark
-
2025-09-18historical
-
2025-08-01price $449,000
-
2025-05-29$469,000 Active
-
2025-01-29status Pending Sale
-
2025-01-29historical
-
2024-12-17historical Active Under Contract
-
2024-10-07price $495,000
-
2024-09-16price $515,000
-
2024-08-17price $529,000
-
2024-07-02price $569,000
-
2024-06-07$589,900 Active
-
2024-06-05historical
-
2002-01-04
ⓘ Source: listings_history table (triggers on properties + properties_extension) + one-shot
backfill from property_details.listing_events for pre-trigger history.
Climate risk First Street
- Flood 1/10 Low FEMA zone X (unshaded) · 0% chance over 30 yrs
- Wildfire 4/10 Moderate
- Heat 4/10 Moderate 7 d/yr ≥85°F today · 17 d/yr by 30 yrs out
- Wind 1/10 Low
- Air quality 7/10 Severe 12 unhealthy d/yr today · 12 by 30 yrs out
Nearby sold comps map
Loading sold comps map…
Walkable amenities ~0.75 mi
Loading nearby amenities…
Taxation est. · year 1
- Rental income
- $45,502
- − Mortgage interest
- −$27,168
- − Property taxes
- −$7,275
- − Insurance
- −$2,425
- − Repairs & maintenance
- −$3,640
- − Management
- −$3,640
- − Depreciation
- −$14,109
- Taxable loss
- −$12,755
- Est. tax savings @ 24.0%
- +$3,061
- After-tax cash flow
- $-1,213/yr
For passive investors: Depreciation is non-cash, so a rental often shows a tax loss while cash-flowing — sheltering income. Rental losses are passive: they offset passive income freely, and up to $25,000/yr can offset ordinary (W-2) income if you actively participate and your MAGI is under $100k (phasing out to $0 by $150k); unused losses carry forward. On sale, claimed depreciation is recaptured at up to 25%, and gains may owe capital-gains tax (a 1031 exchange can defer both). Figures are a year-1 estimate at your 24.0% rate — not tax advice; consult a CPA.
Schools (NCES district)
- District
- Ventura Unified
- NCES district ID
- 0640980
- Math proficiency
- 33% ▼ -11.00%
- Reading proficiency
- 48% ▼ -7.00%
- Median HH income
- $67,362
- Composite
- 36.51/100
- National rank
- #4646
- State rank
- #218 of 517 in CA
Livability — San Buenaventura (Ventura)
No livability data for this city. (Only ~50 U.S. cities are tracked.)
Census & demographics
- Census place
- San Buenaventura (Ventura), CA
- County
- Ventura County · 829,955 people
- City population
- 83,837
- Metro
- Oxnard-Thousand Oaks-Ventura, CA
- Population (ZIP)
- 32,026
- Household income
- $88,078
- Rent vs Own
- Severe rent burden
- 1724.0
Population outlook (Ventura County) Hauer SSP2
- Today (2025)
- 895,754 people
- By 2030
- 912,134 · +1.8%
- By 2040
- 931,454 · +4.0%
- By 2050
- 934,609 · +4.3%
- By 2075
- 924,899 · +3.3%
- By 2100
- 864,712 · -3.5%
Race, ethnicity, and origin ACS 2023
- Neighborhood character
- Diverse neighborhood (Simpson 0.60)
- Race & ethnicity
- White 50% Hispanic / Latino 39% Two or more races 18% Asian 3% Native American 1%
- Hispanic origin (detail)
- Mexican 34%
- Common ancestry
- Italian 4% Lithuanian 3% Slovak 3%
- Foreign-born
- 17% · Canada, China
- Languages at home
- 70% English-only · Spanish 26% Other Indo-European 1% Chinese 1%
Political lean MEDSL · Ventura
- 2024 margin
- D (+15.1) · D 56.1% · R 41.0% · Other 2.9%
- 2008→2024 swing
- +2.8pp toward D · 2008: 12.3pp · 2024: 15.1pp
- All cycles
- 2024: D+15.1 2020: D+21.1 2016: D+16.8 2012: D+5.3 2008: D+12.3
Not yet ingested
- Civics
- —
Market trends
- HPI YoY
- ▼ -1033.39%
- Current HPI
- 349.0527
- Rent YoY
- ▲ 2.80%
- Metro
- Oxnard-Thousand Oaks-Ventura, CA
- State GDP YoY
- ▲ 3.21%
- F500 in state
- 116
Industry mix (Fortune 500 HQ in CA)
| Industry | F500 HQs | Revenue |
|---|---|---|
| Technology | 27 | $1,492B |
|
||
| Financial Services | 3 | $174B |
|
||
| Retail | 3 | $44B |
|
||
| Insurance | 3 | $26B |
|
||
| Media / Entertainment | 2 | $115B |
|
||
| Pharmaceuticals / Biotech | 2 | $62B |
|
||
Price history
-17.8% since first listed14 events — show timeline
- 2026-04-17 Listed $485,000 CRMLS
- 2025-09-18 Listing Removed — CRMLS
- 2025-08-01 Price Changed $449,000 CRMLS
- 2025-05-29 Listed $469,000 CRMLS
- 2025-01-29 Pending — CRMLS
- 2025-01-29 Listing Removed — CRMLS
- 2024-12-17 Contingent — CRMLS
- 2024-10-07 Price Changed $495,000 CRMLS
- 2024-09-16 Price Changed $515,000 CRMLS
- 2024-08-17 Price Changed $529,000 CRMLS
- 2024-07-02 Price Changed $569,000 CRMLS
- 2024-06-07 Listed $589,900 CRMLS
- 2024-06-05 Coming Soon — CRMLS
- 2002-01-04 Listed — CRMLS
Property tax history
+3.4%/yrLatest (2025): $318 · +3.3% YoY. Source: county tax records.
Cash-flow waterfall
monthlySold comps — $/sqft
last 12 mo · ≤1 miLoading sold comps…