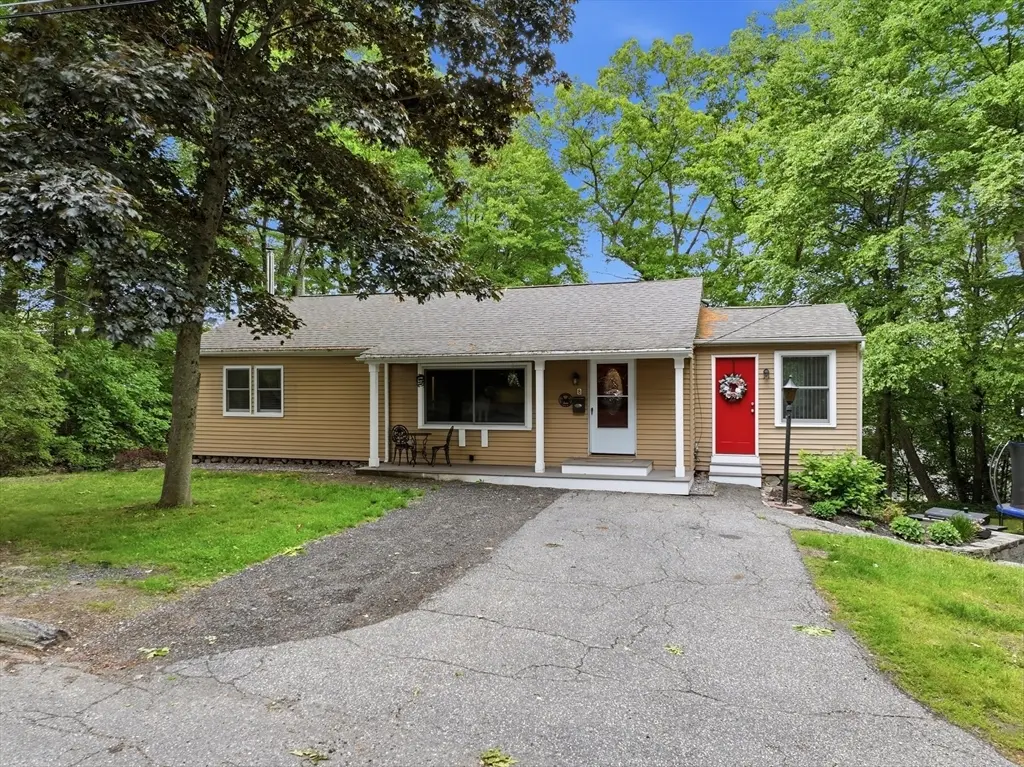
8 Woodside Ter · Auburn, MA
Flood risk 1/10 · Minimal
- FEMA flood zone
- X (unshaded)
- Chance of flooding over 30 yrs
- 0.0%
- Est. flood insurance / yr
- $507 – $1,088
Fire risk 1/10 · Minimal
- Est. fire insurance / yr
- $915 – $1,699
Heat risk 4/10 · Minor
- Hot days now (above 94°F)
- 7 days/yr
- Hot days in 30 yrs
- 17 days/yr
Wind risk 6/10 · Moderate
- Chance of severe wind over 30 yrs
- 27.0%
Air-quality risk 2/10 · Minimal
- Unhealthy air days now
- 1 days/yr
- Unhealthy air days in 30 yrs
- 2 days/yr
Risk factors via First Street. Map © Google.
Why this score? — see what drove the F grade
The composite is a weighted blend of 9 inputs, each scored 0–100. Each bar is that input's sub-score; the figure is the points it added to the 100-point composite (weight × sub-score).
- Cash flow +14.5/30.0
- DSCR +4.4/10.0
- Schools +4.4/10.0
- 1% rule +3.5/10.0
- Rent growth +2.5/5.0
- Livability +2.5/5.0
- Condition / age +2.5/5.0
- ARV discount +0.0/15.0
- Appreciation +0.0/10.0
$480,000
🖨 Deal sheet (PDF) 📄 Offer letter ✓ Due diligence
Listing remarks MLS
BRAND NEW LISTING -- VALUE-PRICED!!! Excellent opportunity to own, in desirable AUBURN, MA! Great Ranch Home on DOUBLE LOT!!! CENTRAL AIR CONDITIONING! --- Open House SUNDAY 7/1, 11-NOON --- 3br 1ba Single Level of Living, with NEW KITCHEN CABS & COUNTERS, Stainless Appliances (Neg., not included) Formal Dining Room with large windows that pour in LIGHT! Single vehicle garage, under, with walk-out lower level, newer heating system, poured concrete floor, windows, could be finished for more living space! Hardwood floors in bedrooms, & living room! Incredibly convenient commuter location! Near to schools, shopping mall, dining/restaurants, golf, parks, ponds, & MORE. $244,000! Don't Wait! Come see us SUNDAY!
Key facts
- One-level living
- Tiled bathroom
- Window seat
Tags
Property features AI
Finance
- Other: Listing exclusions: 2 wall-mounted TVs and wall-mounted shelving excluded; riding mower & snowblower negotiable
- HOA & community: Community features include public transportation, shopping, tennis courts, parks, walk/jog trails, golf, medical facility, laundromat, highway access, house of worship and public schools; Not a senior community
Exterior
- Parking: Attached garage (1 garage space); 1 covered space; 5 open parking spaces; Total of 6 parking spaces; Under-cover parking, paved driveway and off-street paved parking
- Utilities: Public water; Public sewer; Electric service: 100 Amp, 110 Volts, circuit breakers; Wired for electric range, electric oven and electric dryer; Water heater (electric)
- Home design: Single family residence; Beige exterior; Shingle roof; Frame construction
- Construction: Stone foundation
- Exterior features: Porch; Patio; Rain gutters; Stone wall; Gentle sloping lot; 170 ft frontage; Paved road frontage on a public dead-end road; Publicly maintained road
Interior
- Kitchen: Pendant lighting; Ceiling fan; Laminate flooring; Range; Dishwasher; Microwave; Refrigerator; Wine refrigerator
- Bedrooms: Master bedroom on the first floor with ceiling fan, closet, hardwood flooring and attic access; Second bedroom on the first floor with closet and hardwood flooring; Third bedroom on the first floor with hardwood flooring and crown molding
- Flooring: Wood; Tile; Laminate
- Bathrooms: One full bathroom on the first floor with tiled tub/shower and stone/ceramic tile flooring
- Heating & cooling: Forced air heating; Heat pump; Oil heating; Central air conditioning; Thermostat (energy efficient)
- Interior features: Open floorplan; Ceiling fans; Crown molding; Insulated doors; Insulated windows with screens; 6 total rooms; Attic access
- Laundry & utility: Washer and dryer present; Washer hookup and electric dryer hookup in the basement; Exterior access from laundry area; Laundry located in the basement
Neighborhood map
What this means for you Summary
Snapshot
- This is a 3-bed/1.0-bath single-family listed at $480k.
Deal economics
- At list price, monthly cash flow is $107 ($1k/yr) — positive.
- The deal already cash-flows at list — no discount required.
- To meet the 1% rule (rent ≥ 1% of price), the offer needs to be $406k (15.3% below list).
- Recommended offer: $406k (15.3% below list) — sets the bar for 1% rule.
Location & tenants
- Location reads: area grade F — affects rentability + tenant quality, not the cash-flow math above.
- Auburn (suburban): math 45% / reading 54% proficiency, ranked #127 of 302 in MA (top 42%) — families likely to look elsewhere, expect single-tenant / working-renter base with shorter leases; only 18% free/reduced lunch — higher-income household profile.
- Zoned schools: Swanson Road Intermediate School (math 40% / reading 56%, grade D, #367 of 938 statewide, top 39%, 554 students, 0% FRL); Auburn Middle (math 42% / reading 48%, grade D, #113 of 305 statewide, top 38%, 652 students, 0% FRL); Auburn Senior High (math 67% / reading 67%, grade B, #97 of 343 statewide, top 30%, 841 students, 0% FRL) — zoned schools average 0% FRL vs 18% district-wide (18 pts lower); this property's tenant base skews higher-income than the district average.
- Market conditions: 32 active listings in the ZIP; 2 comparable units currently listed for rent nearby; 2,293 units permitted in Worcester County in 2024 (1,205 in 5+ unit buildings).
Forward outlook
- Local home prices are declining (-3.0%/yr); year-one equity from $3k of loan paydown is wiped out by about $14k of value loss. Plan a longer hold.
Negotiation context
- It's been on market 18 days — a 2% lower offer ($473k) is reasonable based on typical stale-listing flexibility.
- 4 sale attempts since 12y ago with the ask held roughly flat each time — persistent listings suggest the price (not the market) is what's stuck; bring a comps-based counter.
- Current owner paid $244k; list at $480k implies a 97% gain — meaningful room to come down on a strong offer.
Risks & watch-outs
- Climate carrying-cost: major wind risk, 27% chance of damaging wind over 30y — expect insurance premiums to compound above CPI over the hold.
Questions for the listing agent
- Built in 1965 — when were the roof, HVAC, electrical panel, plumbing, and water heater last replaced?
- Is there a deadline driving the sale (1031 exchange, divorce, estate, relocation)? That informs how much negotiation room exists.
- The area grade is low — what's the realistic commute time and amenity access for the typical tenant pool here? Any planned neighborhood developments (good or bad) we should know about?
- What's the average days-on-market for RENTAL listings here right now (not sales)? A rising rental-DOM trend means longer vacancies and softer asking-rent achievability than the comps imply.
- What's the recent tenant-quality profile in this submarket — average credit score on applications, eviction rate, late-payment / NSF rate, and stable-employment percentage? A property-management company in the area should have these aggregated.
- How much new for-sale + rental construction is in the pipeline within 1–3 miles? Heavy new supply typically softens prices + rents 12–24 months out; constrained supply supports both.
Investment metrics
- 1% rule
- 0.85% ✗
- Cap rate
- 6.56%
- Cash-on-cash
- 0.95%
- DSCR
- 1.04
- GRM
- 9.8
CMA / ARV
- ARV (on-the-fly)
- $403,700
- Comps found
- 9
Show comp detail 9 sales within ~0.75 mi
| Address | Dist | Beds/Ba | Sqft | Sold | Price | $/sf | Match |
|---|---|---|---|---|---|---|---|
| 15 Waterman | 0.42mi | 3/1.0 | 1,164 (+6%) | 0mo | $427,000 | $367 | 70 |
| 57 Appleton Rd | 0.27mi | 3/2.0 | 1,176 (+7%) | 8mo | $470,000 | $400 | 65 |
| 35 Waterman Rd | 0.54mi | 3/1.0 | 1,157 (+5%) | 3mo | $425,000 | $367 | 64 |
| 24 Phoenix Rd | 0.44mi | 3/1.0 | 1,072 (-2%) | 18mo | $415,000 | $387 | 60 |
| 73 Appleton Rd | 0.37mi | 3/1.0 | 972 (-12%) | 13mo | $417,000 | $429 | 53 |
| 8 Waterman Rd | 0.40mi | 3/1.5 | 1,176 (+7%) | 22mo | $490,000 | $417 | 49 |
| 14 Elbridge Rd | 0.38mi | 3/1.0 | 1,215 (+10%) | 21mo | $350,000 | $288 | 48 |
| 41 Hill St | 0.73mi | 2/1.0 (-1) | 1,076 (-2%) | 12mo | $333,000 | $309 | 47 |
| 305 Bryn Mawr Ave | 0.60mi | 4/1.0 (+1) | 1,200 (+9%) | 12mo | $385,000 | $321 | 42 |
Match score weights: distance 35% · size 25% · config 20% · recency 20%. Top-matched comps best support the ARV.
Projected returns pro-forma
-3.0% appreciation · 3.0% rent growth · sell at horizon
- IRR
- -14.8%
- Equity multiple
- 0.47×
- Total profit
- $-71,042
- Equity at exit
- $71,570
- IRR
- -6.2%
- Equity multiple
- 0.60×
- Total profit
- $-53,379
- Equity at exit
- $41,502
Cash invested: $134,400 (down + closing). Projections, not guarantees.
Landlord ↔ Tenant lean methodology
- Overall (STATE)
- 20 Strongly Tenant-Friendly
- State Massachusetts
- 20 Strongly Tenant-Friendly · D+15
- County
- — inherits STATE
- City
- — inherits STATE
ZIP-level market 01501
- Active inventory
- 32
- Price-to-rent
- 9.8×
Monthly cashflow live
- Estimated rent
- $4,065 medium interval (Pro) →
- Mortgage (P&I)
- −$2,517
- Tax from tax record
- −$387 /mo · $4,645/yr
- Insurance
- −$200
- HOA
- −$0
- Vacancy / Maint / Mgmt
- −$854
- Net cashflow
- $107
Break-even live
Sensitivity live
| Price | -10% $379 | -5% $243 | +0% $107 | +5% $-29 | +10% $-165 |
|---|---|---|---|---|---|
| Rent | -10% $-214 | -5% $-54 | +0% $107 | +5% $267 | +10% $428 |
| Rate | -1.0pp $349 | -0.5pp $229 | base $107 | +0.5pp $-17 | +1.0pp $-144 |
UW: 25.0% down · 7.5% · 30yr · 1.5% tax · 5.0% vac · 8.0% maint · 8.0% mgmt
Financing live
Cash to close
- Down payment
- $120,000
- Closing costs
- $14,400
- Reserves months
- —
- Total cash needed
- —
Loan-product check · same deal, 3 products live
Conventional
25% down · 7.5% · 30yr
- Down + closing
- —
- Monthly P&I
- —
- Monthly cashflow
- —
- DSCR
- —
- Eligible?
- —
Personal DTI + credit; lowest rate.
DSCR
20% down · 8.5% · 30yr
- Down + closing
- —
- Monthly P&I
- —
- Monthly cashflow
- —
- DSCR
- —
- Eligible?
- —
No personal income docs; deal must DSCR.
Hard money
10% down · 12.0% · 12mo
- Down + closing
- —
- Monthly P&I
- —
- Monthly cashflow
- —
- DSCR
- —
- Eligible?
- —
Short-term bridge; refi at stabilization.
Rent comps 2 comps
| Address | Beds | Baths | Sqft | Rent | $/sqft | DOM | Units | Dist |
|---|---|---|---|---|---|---|---|---|
| 1 Ridge RD Auburn, MA | 1.0–3.0 | 1.0–2.0 | 900 | $3,350 | $3.72 | 15d | 46 | 1.10mi |
| 404 Oxford St N Auburn, MA | 2.0 | 1.0 | 1200 | $4,895 | $4.08 | 16d | 1 | 1.43mi |
Listing history 12 events
-
2026-06-21statusdays on market $480,000 Active 18 DOM
-
2026-06-18days on market $480,000 Price Changed 15 DOM
-
2026-06-17days on market $480,000 Price Changed 14 DOM
-
2026-06-16pricestatusdays on market $480,000 Price Changed 13 DOM
-
2026-06-15days on market $490,000 Active 12 DOM
-
2026-06-14days on market $490,000 Active 10 DOM
-
2026-06-10days on market $490,000 Active 7 DOM
-
2026-06-09days on market $490,000 Active 6 DOM
-
2026-06-08days on market $490,000 Active 5 DOM
-
2026-06-07statusdays on market $490,000 Active 4 DOM
-
2026-06-03remarks 699-char remark
-
2026-06-03$490,000 New 1 DOM
ⓘ Source: listings_history table (triggers on properties + properties_extension) + one-shot
backfill from property_details.listing_events for pre-trigger history.
Tax reassessment forecast MA · Partial reset (capped growth)
- Current annual tax
- $4,645 · $387/mo
- Projected year-2 tax
- $5,274 · $440/mo
- Expected delta
- +$630/yr (+$52/mo · 13.6%)
ⓘ Screening estimate from a state-policy table — verify with the county assessor before closing.
Climate risk First Street
- Flood 1/10 Low FEMA zone X (unshaded) · 0% chance over 30 yrs
- Wildfire 1/10 Low
- Heat 4/10 Moderate 7 d/yr ≥94°F today · 17 d/yr by 30 yrs out
- Wind 6/10 Major 27% chance of damaging wind over 30 yrs
- Air quality 2/10 Low 1 unhealthy d/yr today · 2 by 30 yrs out
Nearby sold comps map
Loading sold comps map…
Walkable amenities ~0.75 mi
Loading nearby amenities…
Taxation est. · year 1
- Rental income
- $48,777
- − Mortgage interest
- −$26,887
- − Property taxes
- −$4,645
- − Insurance
- −$2,400
- − Repairs & maintenance
- −$3,902
- − Management
- −$3,902
- − Depreciation
- −$13,964
- Taxable loss
- −$6,924
- Est. tax savings @ 24.0%
- +$1,662
- After-tax cash flow
- $2,944/yr
For passive investors: Depreciation is non-cash, so a rental often shows a tax loss while cash-flowing — sheltering income. Rental losses are passive: they offset passive income freely, and up to $25,000/yr can offset ordinary (W-2) income if you actively participate and your MAGI is under $100k (phasing out to $0 by $150k); unused losses carry forward. On sale, claimed depreciation is recaptured at up to 25%, and gains may owe capital-gains tax (a 1031 exchange can defer both). Figures are a year-1 estimate at your 24.0% rate — not tax advice; consult a CPA.
Schools (NCES district)
- District
- Auburn
- NCES district ID
- 2502220
- Math proficiency
- 45% ▼ -12.00%
- Reading proficiency
- 54% ▼ -10.00%
- Median HH income
- $72,258
- Composite
- 44.47/100
- National rank
- #2801
- State rank
- #127 of 302 in MA
Livability — Auburn
No livability data for this city. (Only ~50 U.S. cities are tracked.)
Census & demographics
- Population (ZIP)
- 16,780
Population outlook (Worcester County) Hauer SSP2
- Today (2025)
- 850,858 people
- By 2030
- 860,403 · +1.1%
- By 2040
- 869,902 · +2.2%
- By 2050
- 869,110 · +2.1%
- By 2075
- 870,120 · +2.3%
- By 2100
- 829,703 · -2.5%
Race, ethnicity, and origin ACS 2023
- Neighborhood character
- Predominantly White (88%)
- Race & ethnicity
- White 88% Hispanic / Latino 5% Two or more races 5% Asian 3%
- Hispanic origin (detail)
- Puerto Rican 3%
- Common ancestry
- Lithuanian 12% Romanian 8% Slovak 2%
- Foreign-born
- 7% · Canada, Vietnam, China
- Languages at home
- 90% English-only · Spanish 3% Other Indo-European 2% Vietnamese 1%
Political lean MEDSL · Worcester
- 2024 margin
- D (+10.0) · D 53.9% · R 43.9% · Other 2.2%
- 2008→2024 swing
- -3.8pp toward R · 2008: 13.8pp · 2024: 10.0pp
- All cycles
- 2024: D+10.0 2020: D+17.8 2016: D+10.5 2012: D+9.2 2008: D+13.8
Not yet ingested
- Civics
- —
Market trends
- HPI YoY
- ▼ -225.04%
- Current HPI
- 270.6131
- Rent YoY
- —
- Metro
- —
- State GDP YoY
- ▲ 2.28%
- F500 in state
- 38
Industry mix (Fortune 500 HQ in MA)
| Industry | F500 HQs | Revenue |
|---|---|---|
| Technology | 3 | $17B |
|
||
| Insurance | 2 | $84B |
|
||
| Retail | 2 | $76B |
|
||
| Life Sciences | 1 | $43B |
|
||
| Energy Technology | 1 | $31B |
|
||
| Aerospace / Defense | 1 | $18B |
|
||
Price history
+965.2% since first listed14 events — show timeline
- 2026-06-03 Listed $490,000 MLS PIN
- 2018-08-28 Sold (MLS) $244,000 MLS PIN
- 2018-07-05 Pending — MLS PIN
- 2018-06-28 Listed $244,000 MLS PIN
- 2014-12-30 Sold (MLS) $168,000 MLS PIN
- 2014-11-19 Contingent — MLS PIN
- 2014-11-14 Price Changed $174,900 MLS PIN
- 2014-09-30 Price Changed $189,900 MLS PIN
- 2014-09-15 Price Changed $194,900 MLS PIN
- 2014-09-09 Relisted — MLS PIN
- 2014-07-16 Contingent — MLS PIN
- 2014-06-27 Price Changed $199,900 MLS PIN
- 2014-06-09 Listed $209,900 MLS PIN
- 1983-10-20 Sold (Public Records) $46,000 Public Records
Property tax history
+4.4%/yrLatest (2023): $4,645 · +12.6% YoY. Source: county tax records.
Cash-flow waterfall
monthlySold comps — $/sqft
last 12 mo · ≤1 miLoading sold comps…