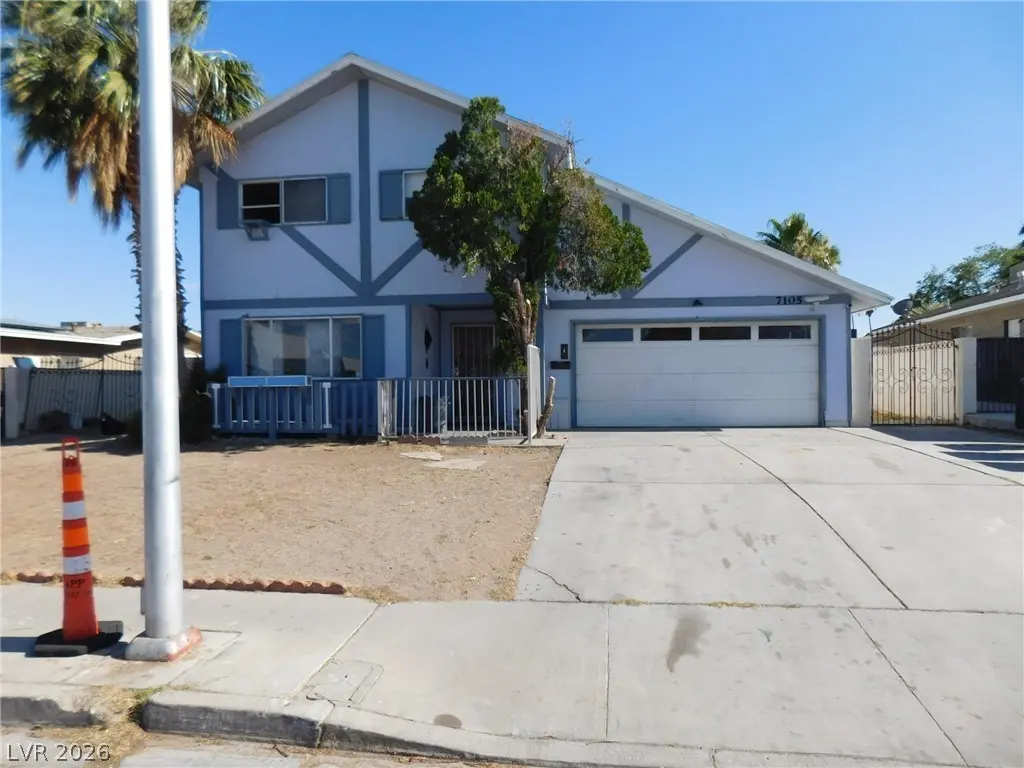
7105 Pinelake Rd · Las Vegas, NV
Flood risk 1/10 · Minimal
- FEMA flood zone
- X (unshaded)
- Chance of flooding over 30 yrs
- 0.0%
- Est. flood insurance / yr
- $507 – $1,088
Fire risk 1/10 · Minimal
- Est. fire insurance / yr
- $490 – $910
Heat risk 8/10 · Major
- Hot days now (above 105°F)
- 7 days/yr
- Hot days in 30 yrs
- 17 days/yr
Wind risk 1/10 · Minimal
- Chance of severe wind over 30 yrs
- —
Air-quality risk 2/10 · Minimal
- Unhealthy air days now
- 2 days/yr
- Unhealthy air days in 30 yrs
- 2 days/yr
Risk factors via First Street. Map © Google.
Why this score? — see what drove the D grade
The composite is a weighted blend of 9 inputs, each scored 0–100. Each bar is that input's sub-score; the figure is the points it added to the 100-point composite (weight × sub-score).
- Cash flow +15.4/30.0
- ARV discount +7.5/15.0
- DSCR +4.7/10.0
- Livability +4.0/5.0
- 1% rule +3.3/10.0
- Schools +2.6/10.0
- Rent growth +2.5/5.0
- Condition / age +2.5/5.0
- Appreciation +0.0/10.0
$294,000
🖨 Deal sheet (PDF) 📄 Offer letter ✓ Due diligence
Listing remarks
Great two-story home located in the highly desirable northwest Las Vegas area with NO HOA and an oversized lot offering extra space, flexibility, and privacy. This 4-bedroom, 2-bath home features a functional layout with generous living areas, natural light, and room to make it your own. Step outside to your private backyard retreat complete with a sparkling pool, perfect for relaxing, entertaining, or enjoying those warm Las Vegas evenings. The oversized lot provides endless possibilities for outdoor living, RV parking potential, storage, or future customization. Conveniently located near shopping, dining, parks, and freeway access while still tucked into an established neighborhood. A rar
Key facts
- Future customization
- Rv parking potential
- Oversized lot
Tags
Property features AI
Exterior
- Parking: Attached private garage; 2 garage spaces
- Utilities: Underground utilities; Public water; Public sewer
- Home design: Two-story single family home; Faces north; Resale property; Tile roof
- Construction: Tile roof; Resale construction status
- Exterior features: Private yard; Block fencing in back yard; Desert landscaping; Landscaped; Less than quarter acre lot; In-ground private pool; Solar energy system
Interior
- Kitchen: Gas cooktop; Disposal; Garden window in kitchen
- Bedrooms: Up to 4 bedrooms possible; Bedroom with closet (10 x 10); Additional bedroom/room with closet (11 x 10)
- Flooring: Carpet
- Bathrooms: 2 full bathrooms
- Heating & cooling: Gas heating with multiple heating units; Central air conditioning (two units)
- Interior features: Unfurnished; Gas fireplace in the living room; Front living room
- Laundry & utility: Laundry room; Gas dryer hookup; Washer; Dryer
Neighborhood map
What this means for you Summary
Snapshot
- This is a 4-bed/2.0-bath single-family listed at $294k.
Deal economics
- At list price, monthly cash flow is $112 ($1k/yr) — positive.
- The deal already cash-flows at list — no discount required.
- To meet the 1% rule (rent ≥ 1% of price), the offer needs to be $243k (17.3% below list).
- Recommended offer: $243k (17.3% below list) — sets the bar for 1% rule.
Location & tenants
- Location reads 80/100 on livability (#2 in NV, #1,723 nationally) — a professional / high-income tenant draw. Strengths: amenities A+, commute A+, housing A+; Watch: crime F.
- Clark County School District (urban): math 21% / reading 39% proficiency, ranked #11 of 17 in NV (top 65%) — families likely to look elsewhere, expect single-tenant / working-renter base with shorter leases.
- Zoned schools: Smith Helen M Es (math 18% / reading 42%, grade F, #187 of 402 statewide, top 48%, 492 students, 100% FRL); Johnson Walter Jhs Academy of Int'L Studies (math 26% / reading 46%, grade F, #28 of 109 statewide, top 28%, 1,356 students, 100% FRL); Bonanza Hs (math 10% / reading 24%, grade F, #103 of 131 statewide, top 81%, 2,035 students, 100% FRL) — zoned schools average 100% FRL vs 52% district-wide (48 pts higher); higher-poverty schools than district average — tighter screening recommended.
- Market conditions: Rents soft (-0.0%/yr); 178 active listings in the ZIP; 40 comparable units currently listed for rent nearby; rentals lingering (median 46d on market — plan ~5-8 weeks vacancy on turnover, expect pricing pressure); 55% of comp listings sitting > 30 days — soft ceiling on asking rent; 14,754 units permitted in Clark County in 2024 (2,301 in 5+ unit buildings).
- This rent runs 39% of the median local income ($75k/yr) — at the standard rent-burdened threshold; future hikes will face affordability resistance.
Forward outlook
- Local home prices are declining (-3.0%/yr); year-one equity from $2k of loan paydown is wiped out by about $9k of value loss. Plan a longer hold.
- Clark County population projected at +36% by 2050 — long-run rental-demand tailwind backs the buy-and-hold thesis.
Negotiation context
- Only 6 days on market — expect competitive offers; lowballing is unlikely to land.
- 3 sale attempts with the ask held roughly flat each time — persistent listings suggest the price (not the market) is what's stuck; bring a comps-based counter.
Risks & watch-outs
- Climate carrying-cost: extreme-heat days projected 7→17/yr by 2055 (HVAC capex compounding) — expect insurance premiums to compound above CPI over the hold.
Questions for the listing agent
- Built in 1971 — when were the roof, HVAC, electrical panel, plumbing, and water heater last replaced?
- Is there a deadline driving the sale (1031 exchange, divorce, estate, relocation)? That informs how much negotiation room exists.
- Crime grade is F in this area — have there been break-ins, vandalism, or insurance claims at this property in the last 3 years? What carrier currently insures it and at what premium?
- The area grade is low — what's the realistic commute time and amenity access for the typical tenant pool here? Any planned neighborhood developments (good or bad) we should know about?
- What's the average days-on-market for RENTAL listings here right now (not sales)? A rising rental-DOM trend means longer vacancies and softer asking-rent achievability than the comps imply.
- What's the recent tenant-quality profile in this submarket — average credit score on applications, eviction rate, late-payment / NSF rate, and stable-employment percentage? A property-management company in the area should have these aggregated.
- How much new for-sale + rental construction is in the pipeline within 1–3 miles? Heavy new supply typically softens prices + rents 12–24 months out; constrained supply supports both.
Investment metrics
- 1% rule
- 0.83% ✗
- Cap rate
- 6.75%
- Cash-on-cash
- 1.63%
- DSCR
- 1.07
- GRM
- 10.1
CMA / ARV
No comps found within radius.
Projected returns pro-forma
-3.0% appreciation · 0.0% rent growth · sell at horizon
- IRR
- -16.8%
- Equity multiple
- 0.42×
- Total profit
- $-47,735
- Equity at exit
- $43,836
- IRR
- -14.6%
- Equity multiple
- 0.27×
- Total profit
- $-60,320
- Equity at exit
- $25,420
Cash invested: $82,320 (down + closing). Projections, not guarantees.
Landlord ↔ Tenant lean methodology
- Overall (STATE)
- 71 Landlord-Friendly
- State Nevada
- 71 Landlord-Friendly · R+1
- County
- — inherits STATE
- City
- — inherits STATE
ZIP-level market 89145
- Home prices YoY
- -14.7%
- Rents YoY
- -0.0%
- Active inventory
- 178
- Price-to-rent
- 10.1×
Monthly cashflow live
- Estimated rent
- $2,430 high interval (Pro) →
- Mortgage (P&I)
- −$1,542
- Tax from tax record
- −$144 /mo · $1,723/yr
- Insurance
- −$122
- HOA
- −$0
- Vacancy / Maint / Mgmt
- −$510
- Net cashflow
- $112
Break-even live
Sensitivity live
| Price | -10% $278 | -5% $195 | +0% $112 | +5% $29 | +10% $-55 |
|---|---|---|---|---|---|
| Rent | -10% $-80 | -5% $16 | +0% $112 | +5% $208 | +10% $304 |
| Rate | -1.0pp $260 | -0.5pp $187 | base $112 | +0.5pp $36 | +1.0pp $-42 |
UW: 25.0% down · 7.5% · 30yr · 1.5% tax · 5.0% vac · 8.0% maint · 8.0% mgmt
Financing live
Cash to close
- Down payment
- $73,500
- Closing costs
- $8,820
- Reserves months
- —
- Total cash needed
- —
Loan-product check · same deal, 3 products live
Conventional
25% down · 7.5% · 30yr
- Down + closing
- —
- Monthly P&I
- —
- Monthly cashflow
- —
- DSCR
- —
- Eligible?
- —
Personal DTI + credit; lowest rate.
DSCR
20% down · 8.5% · 30yr
- Down + closing
- —
- Monthly P&I
- —
- Monthly cashflow
- —
- DSCR
- —
- Eligible?
- —
No personal income docs; deal must DSCR.
Hard money
10% down · 12.0% · 12mo
- Down + closing
- —
- Monthly P&I
- —
- Monthly cashflow
- —
- DSCR
- —
- Eligible?
- —
Short-term bridge; refi at stabilization.
Rent comps 40 comps
| Address | Beds | Baths | Sqft | Rent | $/sqft | DOM | Units | Dist |
|---|---|---|---|---|---|---|---|---|
| 608 Greenhurst Rd Las Vegas, NV | 4.0 | 3.0 | 1437 | $2,399 | $1.67 | 45d | 1 | 0.14mi |
| 7400 Alta Dr Las Vegas, NV | 4.0 | 2.0 | 1663 | $2,000 | $1.20 | 45d | 1 | 0.26mi |
| 7221 Frank Borman Ave Las Vegas, NV | 3.0 | 3.0 | 1620 | $2,295 | $1.42 | 16d | 1 | 0.45mi |
| 109 Fig Ct Las Vegas, NV | 3.0 | 2.0 | 1482 | $1,776 | $1.20 | 45d | 1 | 0.51mi |
| 1410 S Monte Cristo Way Las Vegas, NV | 4.0 | 3.5 | 2513 | $5,500 | $2.19 | 18d | 1 | 0.77mi |
| 8020 James Grayson Dr Las Vegas, NV | 3.0 | 2.0 | 1322 | $2,200 | $1.66 | 45d | 1 | 0.88mi |
| 313 Beethoven St Las Vegas, NV | 3.0 | 3.5 | 2072 | $2,172 | $1.05 | 45d | 1 | 0.90mi |
| 7401 W Washington Ave Las Vegas, NV | 2.0–3.0 | 2.0 | 1198 | $2,075 | $1.73 | 45d | 14 | 0.93mi |
| 500 Hidden Ct Las Vegas, NV | 3.0 | 2.0 | 1692 | $2,200 | $1.30 | 45d | 1 | 0.96mi |
| 413 Norwood Ln Las Vegas, NV | 4.0 | 2.5 | 2114 | $2,450 | $1.16 | 25d | 1 | 0.98mi |
| 528 S Tomsik St Las Vegas, NV | 3.0 | 2.5 | 1671 | $2,150 | $1.29 | 45d | 1 | 1.01mi |
| 8144 Autumn Star Ave Las Vegas, NV | 3.0 | 2.5 | 1408 | $1,899 | $1.35 | 45d | 1 | 1.02mi |
| 8215 Grassy Point Cir Las Vegas, NV | 4.0 | 2.5 | 1668 | $2,220 | $1.33 | 25d | 1 | 1.10mi |
| 8220 James Grayson Dr Las Vegas, NV | 3.0 | 2.0 | 1533 | $2,200 | $1.44 | 22d | 1 | 1.13mi |
| 8305 Aspenbrook Ave Las Vegas, NV | 3.0 | 2.5 | 1715 | $2,250 | $1.31 | 45d | 1 | 1.16mi |
| 308 S Crestline Dr Las Vegas, NV | 4.0 | 3.0 | 2238 | $650 | $0.29 | 45d | 1 | 1.17mi |
| 104 Escada Ln Las Vegas, NV | 3.0 | 2.5 | 1870 | $2,345 | $1.25 | 3d | 1 | 1.17mi |
| 8313 Eugene Grayson Ct Las Vegas, NV | 4.0 | 2.5 | 1901 | $2,250 | $1.18 | 25d | 1 | 1.18mi |
| 8316 Vantare Ct Las Vegas, NV | 3.0 | 3.0 | 2281 | $2,495 | $1.09 | 4d | 1 | 1.19mi |
| 6320 Shawnee Ave Las Vegas, NV | 4.0 | 2.0 | 1770 | $2,595 | $1.47 | 14d | 1 | 1.20mi |
| 112 Golf Course St Las Vegas, NV | 3.0 | 2.0 | 1702 | $2,145 | $1.26 | 45d | 1 | 1.21mi |
| 112 Golf Course St Las Vegas, NV | 3.0 | 2.0 | 1702 | $2,245 | $1.32 | 25d | 1 | 1.21mi |
| 8301 Boseck Dr #115 Las Vegas, NV | 3.0 | 2.0 | 1521 | $1,897 | $1.25 | 45d | 1 | 1.25mi |
| 6760 W Oakey Blvd Las Vegas, NV | 3.0 | 2.5 | 2562 | $3,250 | $1.27 | 25d | 1 | 1.26mi |
| 8348 Granite Peak Ct Las Vegas, NV | 4.0 | 4.0 | 1924 | $2,250 | $1.17 | 22d | 1 | 1.26mi |
| 8348 Granite Peak Ct Unit n/a Las Vegas, NV | 4.0 | 3.0 | 1924 | $2,250 | $1.17 | 23d | 1 | 1.26mi |
| 7917 Copper Canyon Rd Las Vegas, NV | 4.0 | 3.0 | 1450 | $2,475 | $1.71 | 25d | 1 | 1.26mi |
| 7015 El Parque Ave Las Vegas, NV | 3.0 | 3.0 | 2382 | $3,200 | $1.34 | 45d | 1 | 1.28mi |
| 8417 Granite Peak Ct Las Vegas, NV | 3.0 | 2.0 | 1310 | $1,950 | $1.49 | 45d | 1 | 1.31mi |
| 8413 Dunphy Ct Las Vegas, NV | 3.0 | 2.0 | 1245 | $1,850 | $1.49 | 45d | 1 | 1.31mi |
| 8420 Aspenbrook Ave Las Vegas, NV | 3.0 | 3.0 | 1660 | $2,250 | $1.36 | 6d | 1 | 1.32mi |
| 8420 Aspenbrook Ave Las Vegas, NV | 3.0 | 3.0 | 1660 | $2,300 | $1.39 | 16d | 1 | 1.32mi |
| 8400 W Charleston Blvd Las Vegas, NV | 2.0–3.0 | 2.0 | 1220 | $1,950 | $1.60 | 45d | 2 | 1.32mi |
| 1401 Sycamore Spring Ct Las Vegas, NV | 3.0 | 2.5 | 1393 | $1,850 | $1.33 | 45d | 1 | 1.34mi |
| 8452 Boseck Dr #146 Las Vegas, NV | 3.0 | 2.0 | 1258 | $1,700 | $1.35 | 45d | 1 | 1.34mi |
| 8305 Windrush Ave Las Vegas, NV | 4.0 | 2.5 | 1970 | $2,650 | $1.35 | 19d | 1 | 1.36mi |
| 1360 Pacific Terrace Dr Las Vegas, NV | 4.0 | 2.5 | 2080 | $2,170 | $1.04 | 45d | 1 | 1.37mi |
| 1963 Casa Vista Dr Las Vegas, NV | 3.0 | 2.0 | 1811 | $3,650 | $2.02 | 18d | 1 | 1.37mi |
| 1401 Seward St #103 Las Vegas, NV | 3.0 | 2.0 | 1344 | $1,700 | $1.26 | 45d | 1 | 1.41mi |
| 1020 Allure Dr Las Vegas, NV | 3.0 | 2.5 | 1330 | $1,795 | $1.35 | 45d | 1 | 1.42mi |
Listing history 10 events
-
2026-06-02statusdays on market $294,000 Pending 6 DOM
-
2026-06-01days on market $294,000 Active 5 DOM
-
2026-05-31days on market $294,000 Active 4 DOM
-
2026-05-27$294,000 Active
-
2025-12-01historical
-
2025-11-21status Active
-
2025-06-16$320,000 Active
-
2024-01-24soldstatus $289,000
-
1989-12-21soldstatus $100,500
-
1971-11-22soldstatus $34,000
ⓘ Source: listings_history table (triggers on properties + properties_extension) + one-shot
backfill from property_details.listing_events for pre-trigger history.
Tax reassessment forecast NV · Resets to sale price
- Current annual tax
- $1,723 · $144/mo
- Projected year-2 tax
- $1,735 · $145/mo
- Expected delta
- +$11/yr (+$1/mo · 0.7%)
ⓘ Screening estimate from a state-policy table — verify with the county assessor before closing.
Climate risk First Street
- Flood 1/10 Low FEMA zone X (unshaded) · 0% chance over 30 yrs
- Wildfire 1/10 Low
- Heat 8/10 Severe 7 d/yr ≥105°F today · 17 d/yr by 30 yrs out
- Wind 1/10 Low
- Air quality 2/10 Low 2 unhealthy d/yr today · 2 by 30 yrs out
Nearby sold comps map
Loading sold comps map…
Walkable amenities ~0.75 mi
Loading nearby amenities…
Taxation est. · year 1
- Rental income
- $29,161
- − Mortgage interest
- −$16,469
- − Property taxes
- −$1,723
- − Insurance
- −$1,470
- − Repairs & maintenance
- −$2,333
- − Management
- −$2,333
- − Depreciation
- −$8,553
- Taxable loss
- −$3,719
- Est. tax savings @ 24.0%
- +$893
- After-tax cash flow
- $2,236/yr
For passive investors: Depreciation is non-cash, so a rental often shows a tax loss while cash-flowing — sheltering income. Rental losses are passive: they offset passive income freely, and up to $25,000/yr can offset ordinary (W-2) income if you actively participate and your MAGI is under $100k (phasing out to $0 by $150k); unused losses carry forward. On sale, claimed depreciation is recaptured at up to 25%, and gains may owe capital-gains tax (a 1031 exchange can defer both). Figures are a year-1 estimate at your 24.0% rate — not tax advice; consult a CPA.
Schools (NCES district)
- District
- Clark County School District
- NCES district ID
- 3200060
- Math proficiency
- 21% ▼ -13.00%
- Reading proficiency
- 39% ▼ -8.00%
- Median HH income
- $53,611
- Composite
- 26.48/100
- National rank
- #7211
- State rank
- #11 of 17 in NV
Livability — Las Vegas
- Score
- 80/100
- State rank
- #2
- US rank
- #1723
Category grades
Schools grade is shown separately in the Schools card above.
Census & demographics
- Census place
- Las Vegas, NV
- County
- Clark County · 2,306,105 people
- City population
- 1,643,591
- Metro
- Las Vegas-Henderson-Paradise, NV
- Population (ZIP)
- 26,891
- Household income
- $74,529
- Rent vs Own
- Severe rent burden
- 1022.0
Population outlook (Clark County) Hauer SSP2
- Today (2025)
- 2,504,101 people
- By 2030
- 2,693,770 · +7.6%
- By 2040
- 3,061,208 · +22.2%
- By 2050
- 3,400,072 · +35.8%
- By 2075
- 4,139,522 · +65.3%
- By 2100
- 4,596,916 · +83.6%
Race, ethnicity, and origin ACS 2023
- Neighborhood character
- Diverse neighborhood (Simpson 0.66)
- Race & ethnicity
- White 46% Hispanic / Latino 35% Two or more races 18% Asian 8% Black 5% Pacific Islander 1%
- Hispanic origin (detail)
- Mexican 24% Puerto Rican 2% Cuban 3%
- Common ancestry
- Lithuanian 2% Scotch-Irish 2% Romanian 1%
- Foreign-born
- 24% · Canada, Vietnam, China
- Languages at home
- 63% English-only · Spanish 26% Tagalog/Filipino 2% Other Indo-European 2%
Political lean MEDSL · Clark
- 2024 margin
- Toss-up / Even · D 50.4% · R 47.8% · Other 1.7%
- 2008→2024 swing
- -16.5pp toward R · 2008: 19.1pp · 2024: 2.6pp
- All cycles
- 2024: D+2.6 2020: D+9.3 2016: D+10.7 2012: D+14.5 2008: D+19.1
Not yet ingested
- Civics
- —
Market trends
- HPI YoY
- ▼ -53.73%
- Current HPI
- 312.3636
- Rent YoY
- ▬ -0.03%
- Metro
- Las Vegas-Henderson-Paradise, NV
- State GDP YoY
- ▲ 3.08%
- F500 in state
- 6
Industry mix (Fortune 500 HQ in NV)
| Industry | F500 HQs | Revenue |
|---|---|---|
| Hotels / Casinos | 3 | $36B |
|
||
Price history
+764.7% since first listed7 events — show timeline
- 2026-05-27 Listed $294,000 GLVAR
- 2025-12-01 Listing Removed — GLVAR
- 2025-11-21 Relisted — GLVAR
- 2025-06-16 Listed $320,000 GLVAR
- 2024-01-24 Sold (Public Records) $289,000 Public Records
- 1989-12-21 Sold (Public Records) $100,500 Public Records
- 1971-11-22 Sold (Public Records) $34,000 Public Records
Property tax history
+2.1%/yrLatest (2025): $1,723 · -13.2% YoY. Source: county tax records.
Cash-flow waterfall
monthlySold comps — $/sqft
last 12 mo · ≤1 miLoading sold comps…