 Duplex
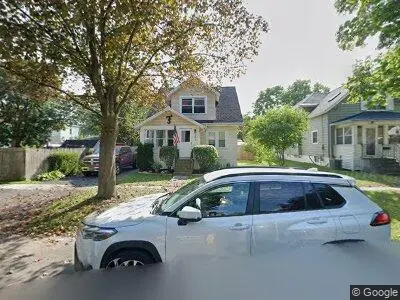
101 W Irving St · East Syracuse, NY
Flood risk 1/10 · Minimal
- FEMA flood zone
- X (unshaded)
- Chance of flooding over 30 yrs
- 0.0%
- Est. flood insurance / yr
- $473 – $860
Fire risk 1/10 · Minimal
- Est. fire insurance / yr
- $691 – $1,283
Heat risk 3/10 · Minor
- Hot days now (above 95°F)
- 7 days/yr
- Hot days in 30 yrs
- 16 days/yr
Wind risk 1/10 · Minimal
- Chance of severe wind over 30 yrs
- 1.0%
Air-quality risk 2/10 · Minimal
- Unhealthy air days now
- 0 days/yr
- Unhealthy air days in 30 yrs
- 1 days/yr
Risk factors via First Street. Map © Google.
Why this score? — see what drove the B- grade
The composite is a weighted blend of 9 inputs, each scored 0–100. Each bar is that input's sub-score; the figure is the points it added to the 100-point composite (weight × sub-score).
- Cash flow +30.0/30.0
- 1% rule +10.0/10.0
- DSCR +10.0/10.0
- ARV discount +4.6/15.0
- Livability +4.5/5.0
- Schools +4.3/10.0
- Rent growth +2.5/5.0
- Condition / age +2.5/5.0
- Appreciation +0.0/10.0
$215,000
🖨 Deal sheet (PDF) 📄 Offer letter ✓ Due diligence
Multi-family units
County records classify this as Multi-Family (2-4 Unit). Listing-text estimate: 2 units. confirmed
Listing remarks
* PHENOMENAL INVESTOR OPPORTUNITY! * Located on a quiet street in the sought after village of East Syracuse in ES-M school district! This 2 family home has a cozy first floor apartment which includes 2 bedrooms and a full bathroom, an enclosed front porch, CENTRAL AIR CONDITIONING, a partially finished basement with storage, washer and dryer hookups, a full bathroom and a central vacuum system and a detached garage with electricity. The second floor apartment includes 2 bedrooms and an Eat in kitchen, full bathroom and is ready for a custom update. Off street rear parking for 4 vehicles. A fully fenced yard and extended lot attached to the property.
Key facts
- Fully fenced yard
- Extended lot
- Built 1925
Tags
Neighborhood map
What this means for you Summary
Snapshot
- This is a 2 × 2-bed/1.5-bath units multifamily listed at $215k.
Deal economics
- At list price, monthly cash flow is $1k ($13k/yr) — positive. Per door: $527/mo.
- The deal already cash-flows at list — no discount required.
- Meets the 1% rule at list price ($4k rent vs $215k).
- Recommended offer: $212k (1.5% below list) — sets the bar for market timing.
- Cap rate 12.2% vs local median 7.0% in East Syracuse — top-decile yield for the area; either an underpriced asset or a hidden risk that comps aren't pricing in. Stress-test before assuming the spread holds.
Location & tenants
- Location reads 90/100 on livability (#4 in NY, #81 nationally) — a professional / high-income tenant draw. Strengths: amenities A+, commute A+, cost of living A+.
- East Syracuse Minoa Central School District (rural): math 46% / reading 53% proficiency, ranked #379 of 590 in NY (top 64%) — families likely to look elsewhere, expect single-tenant / working-renter base with shorter leases.
- Zoned schools: East Syracuse Elementary School (math 27% / reading 42%, grade F, #1,577 of 2,108 statewide, top 77%, 363 students, 70% FRL); Pine Grove Middle School (math 29% / reading 49%, grade F, #433 of 729 statewide, top 60%, 672 students, 43% FRL); East Syracuse Minoa Central High School (math 97% / reading 87%, grade A+, #171 of 1,100 statewide, top 18%, 1,183 students, 60% FRL) — zoned schools average 58% FRL vs 29% district-wide (29 pts higher); higher-poverty schools than district average — tighter screening recommended.
- Market conditions: 59 active listings in the ZIP; 3 comparable units currently listed for rent nearby; rentals at typical pace (median 23d on market — plan ~3-4 weeks tenant-placement turnaround); solid renter incomes; 616 units permitted in Onondaga County in 2024 (256 in 5+ unit buildings).
- At $3,518/mo this rent would consume 52% of the median local household income ($81k/yr) (locally 250% of renters already pay >50% of income on rent) — very limited rent-growth headroom before tenants either downsize or default.
Forward outlook
- Local home prices are declining (-3.0%/yr); year-one equity from $1k of loan paydown is wiped out by about $6k of value loss. Plan a longer hold.
- Onondaga County population projected to shrink 9% by 2050 — rents likely to lag national; underwrite the cash flow, not the appreciation.
- At projected returns (-3.0% appreciation + 3.0% rent growth), your $60k cash investment doubles in ~6 years — after that, you're playing with house money.
Negotiation context
- It's been on market 15 days — a 2% lower offer ($212k) is reasonable based on typical stale-listing flexibility.
- Current owner paid $96k; list at $215k implies a 125% gain — meaningful room to come down on a strong offer.
Risks & watch-outs
- Watch-outs: property tax is 2.8% of price; built in 1925 — expect roof / HVAC / electrical / plumbing capex.
Questions for the listing agent
- Can we see the unit-by-unit rent roll, current vacancy, and any below-market leases? What's the average tenancy length?
- What capital expenditures (roof, boiler, parking lot, exteriors) have been made in the last 5 years, and what's planned in the next 2?
- Built in 1925 — when were the roof, HVAC, electrical panel, plumbing, and water heater last replaced?
- Property tax is high relative to price — has the assessment been appealed recently, and will the sale trigger a re-assessment?
- Is there a deadline driving the sale (1031 exchange, divorce, estate, relocation)? That informs how much negotiation room exists.
- Schools are D-rated, which usually means shorter tenancies and higher turnover. Who's the typical renter profile here, and what's been the actual vacancy rate?
- What's the average days-on-market for RENTAL listings here right now (not sales)? A rising rental-DOM trend means longer vacancies and softer asking-rent achievability than the comps imply.
- What's the recent tenant-quality profile in this submarket — average credit score on applications, eviction rate, late-payment / NSF rate, and stable-employment percentage? A property-management company in the area should have these aggregated.
- How much new apartment / multifamily construction is in the pipeline within 1–3 miles? Heavy new supply (>2% of stock underway) typically softens rents 12–24 months out; light construction supports rent growth.
Investment metrics
- 1% rule
- 1.64% ✓
- Cap rate
- 12.17%
- Cash-on-cash
- 21.00%
- DSCR
- 1.93
- GRM
- 5.1
CMA / ARV
- ARV (on-the-fly)
- $202,080
- Comps found
- 2
Show comp detail 2 sales within ~0.75 mi
| Address | Dist | Beds/Ba | Sqft | Sold | Price | $/sf | Match |
|---|---|---|---|---|---|---|---|
| 308 Mccool Ave | 0.25mi | 4/2.0 | 1,536 (-9%) | 6mo | $185,000 | $120 | 66 |
| 624 W Manlius St | 0.49mi | 4/2.0 | 1,928 (+14%) | 15mo | $182,000 | $94 | 38 |
Match score weights: distance 35% · size 25% · config 20% · recency 20%. Top-matched comps best support the ARV.
Projected returns pro-forma
-3.0% appreciation · 3.0% rent growth · sell at horizon
- IRR
- 13.5%
- Equity multiple
- 1.54×
- Total profit
- $32,459
- Equity at exit
- $32,057
- IRR
- 22.4%
- Equity multiple
- 2.92×
- Total profit
- $115,478
- Equity at exit
- $18,589
Cash invested: $60,200 (down + closing). Projections, not guarantees.
Landlord ↔ Tenant lean methodology
- Overall (STATE)
- 15 Strongly Tenant-Friendly
- State New York
- 15 Strongly Tenant-Friendly · D+10
- County
- — inherits STATE
- City
- — inherits STATE
ZIP-level market 13057
- Home prices YoY
- -11.1%
- Active inventory
- 59
- Price-to-rent
- 10.2×
Monthly cashflow live
- Estimated rent
- $3,518 medium interval (Pro) →
- Mortgage (P&I)
- −$1,127
- Tax from tax record
- −$509 /mo · $6,104/yr
- Insurance
- −$90
- HOA
- −$0
- Vacancy / Maint / Mgmt
- −$739
- Net cashflow
- $1,053
Break-even live
Sensitivity live
| Price | -10% $1,175 | -5% $1,114 | +0% $1,053 | +5% $993 | +10% $932 |
|---|---|---|---|---|---|
| Rent | -10% $776 | -5% $915 | +0% $1,053 | +5% $1,192 | +10% $1,331 |
| Rate | -1.0pp $1,162 | -0.5pp $1,108 | base $1,053 | +0.5pp $998 | +1.0pp $941 |
2-unit breakdown (identical units grouped — click to expand)
| Units | Beds | Baths | Est. rent |
|---|---|---|---|
| 2× units | 2 | 1.5 | $3,518 |
| #1 | 2 | 1.5 | $1,759 |
| #2 | 2 | 1.5 | $1,759 |
| Total (2 units) | $3,518 | ||
UW: 25.0% down · 7.5% · 30yr · 1.5% tax · 5.0% vac · 8.0% maint · 8.0% mgmt
Financing live
Cash to close
- Down payment
- $53,750
- Closing costs
- $6,450
- Reserves months
- —
- Total cash needed
- —
Loan-product check · same deal, 3 products live
Conventional
25% down · 7.5% · 30yr
- Down + closing
- —
- Monthly P&I
- —
- Monthly cashflow
- —
- DSCR
- —
- Eligible?
- —
Personal DTI + credit; lowest rate.
DSCR
20% down · 8.5% · 30yr
- Down + closing
- —
- Monthly P&I
- —
- Monthly cashflow
- —
- DSCR
- —
- Eligible?
- —
No personal income docs; deal must DSCR.
Hard money
10% down · 12.0% · 12mo
- Down + closing
- —
- Monthly P&I
- —
- Monthly cashflow
- —
- DSCR
- —
- Eligible?
- —
Short-term bridge; refi at stabilization.
Rent comps 3 comps
| Address | Beds | Baths | Sqft | Rent | $/sqft | DOM | Units | Dist |
|---|---|---|---|---|---|---|---|---|
| 116 Stillwater Dr East Syracuse, NY | 3.0 | 2.5 | 1692 | $3,000 | $1.77 | 22d | 1 | 0.68mi |
| 99 Alpine Dr Unit 107-2 Syracuse, NY | 3.0 | 1.0 | 1100 | $1,700 | $1.55 | 45d | 1 | 1.10mi |
| 6463 Wells Dr Unit 6465 East Syracuse, NY | 3.0 | 2.0 | 1519 | $1,800 | $1.18 | 22d | 1 | 1.18mi |
Listing history 3 events
-
2026-05-12$215,000 Active
-
2007-05-21soldstatus $95,500
-
2004-04-08soldstatus $82,500
ⓘ Source: listings_history table (triggers on properties + properties_extension) + one-shot
backfill from property_details.listing_events for pre-trigger history.
Tax reassessment forecast NY · Partial reset (capped growth)
- Current annual tax
- $6,104 · $509/mo
- Projected year-2 tax
- $6,104 · $509/mo
- Expected delta
- $0/yr ($0/mo · 0.0%)
ⓘ Screening estimate from a state-policy table — verify with the county assessor before closing.
Climate risk First Street
- Flood 1/10 Low FEMA zone X (unshaded) · 0% chance over 30 yrs
- Wildfire 1/10 Low
- Heat 3/10 Moderate 7 d/yr ≥95°F today · 16 d/yr by 30 yrs out
- Wind 1/10 Low 100% chance of damaging wind over 30 yrs
- Air quality 2/10 Low 0 unhealthy d/yr today · 1 by 30 yrs out
Nearby sold comps map
Loading sold comps map…
Walkable amenities ~0.75 mi
Loading nearby amenities…
Taxation est. · year 1
- Rental income
- $42,216
- − Mortgage interest
- −$12,043
- − Property taxes
- −$6,104
- − Insurance
- −$1,075
- − Repairs & maintenance
- −$3,377
- − Management
- −$3,377
- − Depreciation
- −$6,255
- Taxable income
- $9,985
- Est. tax owed @ 24.0%
- −$2,396
- After-tax cash flow
- $10,246/yr
For passive investors: Depreciation is non-cash, so a rental often shows a tax loss while cash-flowing — sheltering income. Rental losses are passive: they offset passive income freely, and up to $25,000/yr can offset ordinary (W-2) income if you actively participate and your MAGI is under $100k (phasing out to $0 by $150k); unused losses carry forward. On sale, claimed depreciation is recaptured at up to 25%, and gains may owe capital-gains tax (a 1031 exchange can defer both). Figures are a year-1 estimate at your 24.0% rate — not tax advice; consult a CPA.
Schools (NCES district)
- District
- East Syracuse Minoa Central School District
- NCES district ID
- 3609990
- Math proficiency
- 46% ▼ -6.00%
- Reading proficiency
- 53% ▲ 9.00%
- Median HH income
- $55,801
- Composite
- 42.9/100
- National rank
- #3122
- State rank
- #379 of 590 in NY
Livability — East Syracuse
- Score
- 90/100
- State rank
- #4
- US rank
- #81
Category grades
Schools grade is shown separately in the Schools card above.
Census & demographics
- Census place
- East Syracuse, NY
- County
- Onondaga County · 247,257 people
- City population
- 14,253
- Metro
- Syracuse, NY
- Population (ZIP)
- 14,253
- Household income
- $80,900
- Rent vs Own
- Severe rent burden
- 250.0
Population outlook (Onondaga County) Hauer SSP2
- Today (2025)
- 467,894 people
- By 2030
- 463,381 · -1.0%
- By 2040
- 447,697 · -4.3%
- By 2050
- 426,399 · -8.9%
- By 2075
- 373,661 · -20.1%
- By 2100
- 307,967 · -34.2%
Race, ethnicity, and origin ACS 2023
- Neighborhood character
- Predominantly White (88%)
- Race & ethnicity
- White 88% Two or more races 5% Hispanic / Latino 3% Asian 2% Black 2%
- Common ancestry
- Romanian 5% Lithuanian 4% American 3%
- Foreign-born
- 6% · Canada, Vietnam
- Languages at home
- 92% English-only · Russian/Polish/Slavic 3% Spanish 1% Other Indo-European 1%
Political lean MEDSL · Onondaga
- 2024 margin
- D (+17.3) · D 58.6% · R 41.4%
- 2008→2024 swing
- -3.0pp toward R · 2008: 20.3pp · 2024: 17.3pp
- All cycles
- 2024: D+17.3 2020: D+20.6 2016: D+12.8 2012: D+21.1 2008: D+20.3
Not yet ingested
- Civics
- —
Market trends
- HPI YoY
- ▼ -39.50%
- Current HPI
- 316.8595
- Rent YoY
- —
- Metro
- Syracuse, NY
- State GDP YoY
- ▲ 2.60%
- F500 in state
- 92
Industry mix (Fortune 500 HQ in NY)
| Industry | F500 HQs | Revenue |
|---|---|---|
| Financial Services | 10 | $950B |
|
||
| Consumer Goods | 9 | $162B |
|
||
| Insurance | 4 | $225B |
|
||
| Telecommunications | 2 | $144B |
|
||
| Pharmaceuticals | 2 | $112B |
|
||
| Media / Entertainment | 2 | $69B |
|
||
Price history
+160.6% since first listed3 events — show timeline
- 2026-05-12 Listed $215,000 FSBO.com
- 2007-05-21 Sold (Public Records) $95,500 Public Records
- 2004-04-08 Sold (Public Records) $82,500 Public Records
Property tax history
+4.3%/yrLatest (2025): $6,104 · +14.2% YoY. Source: county tax records.
Cash-flow waterfall
monthlySold comps — $/sqft
last 12 mo · ≤1 miLoading sold comps…