Xxxx W Game Trl · Seligman, AZ
Flood risk 1/10 · Minimal
- FEMA flood zone
- D
- Chance of flooding over 30 yrs
- 0.0%
- Est. flood insurance / yr
- $544 – $1,084
Fire risk 4/10 · Minor
- Est. fire insurance / yr
- $610 – $1,132
Heat risk 4/10 · Minor
- Hot days now (above 94°F)
- 7 days/yr
- Hot days in 30 yrs
- 18 days/yr
Wind risk 1/10 · Minimal
- Chance of severe wind over 30 yrs
- —
Air-quality risk 1/10 · Minimal
- Unhealthy air days now
- 0 days/yr
- Unhealthy air days in 30 yrs
- 0 days/yr
Risk factors via First Street. Map © Google.
Why this score? — see what drove the D- grade
The composite is a weighted blend of 9 inputs, each scored 0–100. Each bar is that input's sub-score; the figure is the points it added to the 100-point composite (weight × sub-score).
- Cash flow +10.9/30.0
- ARV discount +7.5/15.0
- Appreciation +4.0/10.0
- 1% rule +3.3/10.0
- DSCR +3.2/10.0
- Livability +3.1/5.0
- Rent growth +2.5/5.0
- Schools +2.4/10.0
- Condition / age +1.0/5.0
$160,000
🖨 Deal sheet 📄 Offer letter ✓ Due diligence
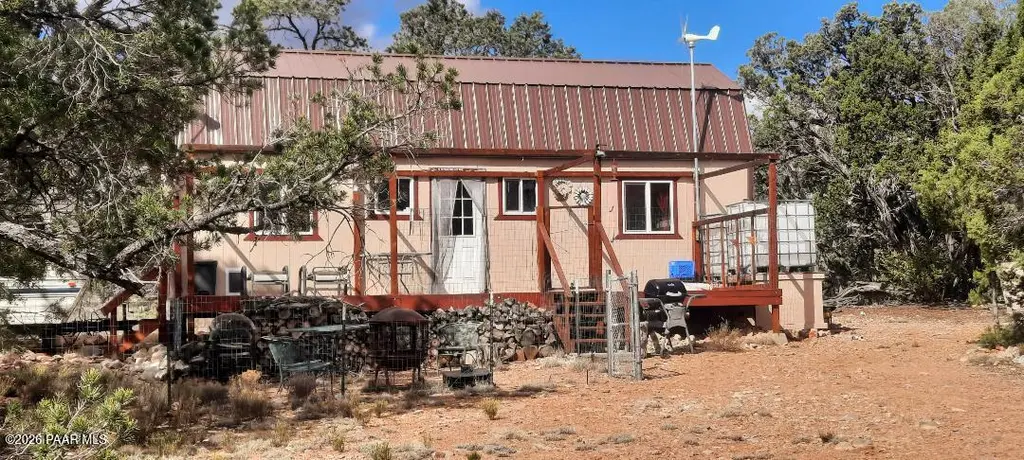
Listing remarks
Nice 16x32 homestead/hunting cabin with sleeping loft. 1-bedroom and 1-bathroom with composite toilet downstairs. Solar system along with water storage tanks. Kitchen appliances, wood stove, and furniture included. Outside consists of shed, chicken coop, and greenhouse. South side property abuts about 80% of state land. Plenty of wildlife there! Hunt 18A for Elk, Deer, Javelina, and bear. ONLY 2 miles from asphalt and 15 minutes from town.
Key facts
- Furniture included
- Kitchen appliances
- Wood stove
Tags
Property features AI
Finance
- Other: Lot approximately 38.29 acres; Topography includes borders with State/BLM, hillside, juniper/pinon, gentle slopes and views; Zoning: RCU-2A; Subdivision maintained road; road frontage includes easement, Forest Service and unimproved; road surfaces dirt/gravel/unimproved; Subdivision: Sierra Verde Ranch
- HOA & community: Subdivision association (annual fee $181.88); Not a senior community
Exterior
- Parking: RV parking/garage (other)
- Utilities: Hauled water; No on-site water source listed
- Home design: Single family residence; Residential property; Multi/split levels; 2 stories
- Construction: Frame construction; Metal roof; Piers basement
- Exterior features: Deck; Driveway: dirt and gravel; Shed(s); Rainwater harvesting; Greenhouse; Workshop; Partial fencing; Other outdoor structures
Interior
- Kitchen: Oven; Range; Refrigerator
- Bedrooms: 2 possible bedrooms
- Flooring: Laminate; Wood
- Bathrooms: 1 bathroom (total)
- Heating & cooling: Propane heating; Wood stove; Ceiling fan(s)
- Interior features: Laminate counters; Loft
- Laundry & utility: Propane water heater
Neighborhood map
What this means for you Summary
Snapshot
- This is a 1-bed/1.0-bath single-family listed at $160k. Condition is rated poor.
Deal economics
- At list price, monthly cash flow is $-70 ($-839/yr) — negative.
- To cash-flow at today's rent, offer at most $150k (6.3% below list).
- To meet the 1% rule (rent ≥ 1% of price), the offer needs to be $133k (16.9% below list).
- Recommended offer: $133k (16.9% below list) — sets the bar for 1% rule.
- Cap rate 5.8% vs local median 4.0% in Seligman — top-decile yield for the area; either an underpriced asset or a hidden risk that comps aren't pricing in. Stress-test before assuming the spread holds.
Location & tenants
- Location reads 62/100 on livability (#127 in AZ) — a middle-class / working-renter tenant base. Strengths: employment A+, cost of living A+; Watch: schools F, crime F, amenities F.
- Seligman Unified District (4472) (rural): math 20% / reading 30% proficiency, ranked #339 of 501 in AZ (top 68%) — low school quality limits family demand, transient renter base, plan for 1-2y turnover.
- Market conditions: 293 active listings in the ZIP; 2,062 units permitted in Yavapai County in 2024 (98 in 5+ unit buildings).
Forward outlook
- Local home prices are declining (-2.0%/yr); year-one equity from $1k of loan paydown is wiped out by about $3k of value loss. Plan a longer hold.
- Yavapai County population projected at +10% by 2050 — modest demand growth; plan on rents tracking national, not racing it.
Negotiation context
- It's been on market 18 days — a 2% lower offer ($158k) is reasonable based on typical stale-listing flexibility.
Questions for the listing agent
- What do current leases actually rent for vs. the listed asking? Can we see a recent rent roll and the last 12 months of T-12 income?
- Have any recent inspections been done? Can we get a copy of the seller's disclosures and any deferred-maintenance estimates?
- What does the HOA fee cover, when was the last increase, and are there any pending special assessments or reserve-fund shortfalls?
- Is there a deadline driving the sale (1031 exchange, divorce, estate, relocation)? That informs how much negotiation room exists.
- Schools are F-rated, which usually means shorter tenancies and higher turnover. Who's the typical renter profile here, and what's been the actual vacancy rate?
- Crime grade is F in this area — have there been break-ins, vandalism, or insurance claims at this property in the last 3 years? What carrier currently insures it and at what premium?
- The area grade is low — what's the realistic commute time and amenity access for the typical tenant pool here? Any planned neighborhood developments (good or bad) we should know about?
- What's the average days-on-market for RENTAL listings here right now (not sales)? A rising rental-DOM trend means longer vacancies and softer asking-rent achievability than the comps imply.
- What's the recent tenant-quality profile in this submarket — average credit score on applications, eviction rate, late-payment / NSF rate, and stable-employment percentage? A property-management company in the area should have these aggregated.
- How much new for-sale + rental construction is in the pipeline within 1–3 miles? Heavy new supply typically softens prices + rents 12–24 months out; constrained supply supports both.
Investment metrics
- 1% rule
- 0.83% ✗
- Cap rate
- 5.77%
- Cash-on-cash
- -1.87%
- DSCR
- 0.92
- GRM
- 10.0
CMA / ARV
No comps found within radius.
Projected returns pro-forma
-2.0% appreciation · 3.0% rent growth · sell at horizon
- IRR
- -13.4%
- Equity multiple
- 0.47×
- Total profit
- $-23,572
- Equity at exit
- $31,069
- IRR
- -5.8%
- Equity multiple
- 0.55×
- Total profit
- $-20,098
- Equity at exit
- $26,546
Cash invested: $44,800 (down + closing). Projections, not guarantees.
Landlord ↔ Tenant lean methodology
- Overall (STATE)
- 87 Strongly Landlord-Friendly
- State Arizona
- 87 Strongly Landlord-Friendly · R+3
- County
- — inherits STATE
- City
- — inherits STATE
ZIP-level market 86337
- Home prices YoY
- -1.0%
- Active inventory
- 293
- Price-to-rent
- 10.0×
Monthly cashflow live
- Estimated rent
- $1,330 medium interval (Pro) →
- Mortgage (P&I)
- −$839
- Tax est. 1.5%
- −$200 /mo · $2,400/yr
- Insurance
- −$67
- HOA
- −$15
- Vacancy / Maint / Mgmt
- −$279
- Net cashflow
- $-70
Break-even live
UW: 25.0% down · 7.5% · 30yr · 1.5% tax · 5.0% vac · 8.0% maint · 8.0% mgmt
Financing live
Cash to close
- Down payment
- $40,000
- Closing costs
- $4,800
- Reserves months
- —
- Total cash needed
- —
Loan-product check · same deal, 3 products live
Conventional
25% down · 7.5% · 30yr
- Down + closing
- —
- Monthly P&I
- —
- Monthly cashflow
- —
- DSCR
- —
- Eligible?
- —
Personal DTI + credit; lowest rate.
DSCR
20% down · 8.5% · 30yr
- Down + closing
- —
- Monthly P&I
- —
- Monthly cashflow
- —
- DSCR
- —
- Eligible?
- —
No personal income docs; deal must DSCR.
Hard money
10% down · 12.0% · 12mo
- Down + closing
- —
- Monthly P&I
- —
- Monthly cashflow
- —
- DSCR
- —
- Eligible?
- —
Short-term bridge; refi at stabilization.
HOA detail
- Monthly dues
- $15 · $180/yr
- Likely covers
- water
Listing history 14 events
-
2026-06-19days on market $160,000 Active 18 DOM
-
2026-06-18days on market $160,000 Active 17 DOM
-
2026-06-17days on market $160,000 Active 16 DOM
-
2026-06-16days on market $160,000 Active 15 DOM
-
2026-06-15days on market $160,000 Active 14 DOM
-
2026-06-14days on market $160,000 Active 12 DOM
-
2026-06-13days on market $160,000 Active 11 DOM
-
2026-06-10days on market $160,000 Active 9 DOM
-
2026-06-09days on market $160,000 Active 8 DOM
-
2026-06-08days on market $160,000 Active 7 DOM
-
2026-06-07days on market $160,000 Active 6 DOM
-
2026-06-03days on market $160,000 Active 2 DOM
-
2026-06-02remarks 443-char remark
-
2026-06-02$160,000 Active 1 DOM
ⓘ Source: listings_history table (triggers on properties + properties_extension) + one-shot
backfill from property_details.listing_events for pre-trigger history.
Climate risk First Street
- Flood 1/10 Low FEMA zone D · 0% chance over 30 yrs
- Wildfire 4/10 Moderate
- Heat 4/10 Moderate 7 d/yr ≥94°F today · 18 d/yr by 30 yrs out
- Wind 1/10 Low
- Air quality 1/10 Low 0 unhealthy d/yr today · 0 by 30 yrs out
Nearby sold comps map
Loading sold comps map…
Walkable amenities ~0.75 mi
Loading nearby amenities…
Taxation est. · year 1
- Rental income
- $15,961
- − Mortgage interest
- −$8,962
- − Property taxes
- −$2,400
- − Insurance
- −$800
- − Repairs & maintenance
- −$1,277
- − Management
- −$1,277
- − HOA
- −$180
- − Depreciation
- −$4,655
- Taxable loss
- −$3,590
- Est. tax savings @ 24.0%
- +$861
- After-tax cash flow
- $22/yr
For passive investors: Depreciation is non-cash, so a rental often shows a tax loss while cash-flowing — sheltering income. Rental losses are passive: they offset passive income freely, and up to $25,000/yr can offset ordinary (W-2) income if you actively participate and your MAGI is under $100k (phasing out to $0 by $150k); unused losses carry forward. On sale, claimed depreciation is recaptured at up to 25%, and gains may owe capital-gains tax (a 1031 exchange can defer both). Figures are a year-1 estimate at your 24.0% rate — not tax advice; consult a CPA.
Condition & rehab AI · 6 photos
This property requires extensive repairs and maintenance, including a new roof and siding, to become move-in ready and increase its value.
Repairs flagged
- Major roof — Significant rust and damage
- Major exterior siding — Peeling paint and exposed wood
- Major foundation — No visible foundation, but exposed wood suggests potential issues
Value-add opportunities
- Both Replace roof and siding — Both resale and rental value would be significantly increased by a new roof and siding
- Both Paint exterior siding — Improves curb appeal and value
- Both Replace HVAC system — Improves comfort and energy efficiency
Renovation cost estimate screening
| Repair item | Severity | Est. cost |
|---|---|---|
| roof · Significant rust and damage | Major | $15,000–50,000 |
| exterior siding · Peeling paint and exposed wood | Major | $15,000–50,000 |
| foundation · No visible foundation, but exposed wood suggests potential issues | Major | $15,000–50,000 |
| Total estimated repair cost · 3 items | $45,000–150,000 |
Value-add ROI direction
- Both Replace roof and siding — Both resale and rental value would be significantly increased by a new roof and siding ↑
- Both Paint exterior siding — Improves curb appeal and value ↑
- Both Replace HVAC system — Improves comfort and energy efficiency ↑
ⓘ Cost ranges are severity-bucket heuristics (US national rule-of-thumb). Get contractor quotes + a written scope before underwriting a rehab budget.
Schools (NCES district)
- District
- Seligman Unified District (4472)
- NCES district ID
- 0407630
- Math proficiency
- 20% ▬ 0.00%
- Reading proficiency
- 30% ▬ 0.00%
- Median HH income
- $35,531
- Composite
- 23.7/100
- National rank
- #13238
- State rank
- #339 of 501 in AZ
Livability — Seligman
- Score
- 62/100
- State rank
- #127
- US rank
- #16174
Category grades
Schools grade is shown separately in the Schools card above.
Census & demographics
- Population (ZIP)
- 1,827
Population outlook (Yavapai County) Hauer SSP2
- Today (2025)
- 241,389 people
- By 2030
- 249,523 · +3.4%
- By 2040
- 259,966 · +7.7%
- By 2050
- 264,736 · +9.7%
- By 2075
- 269,334 · +11.6%
- By 2100
- 256,505 · +6.3%
Race, ethnicity, and origin ACS 2023
- Neighborhood character
- Predominantly White (70%)
- Race & ethnicity
- White 70% Hispanic / Latino 19% Two or more races 9% Native American 4% Asian 1%
- Hispanic origin (detail)
- Mexican 18%
- Common ancestry
- Slovak 7% Lithuanian 4% Serbian 3%
- Foreign-born
- 1% · Canada
- Languages at home
- 94% English-only · Spanish 5% Other Asian/Pacific 1%
Political lean MEDSL · Yavapai
- 2024 margin
- Solid R (+33.9) · D 32.6% · R 66.5%
- 2008→2024 swing
- -9.5pp toward R · 2008: -24.4pp · 2024: -33.9pp
- All cycles
- 2024: R+33.9 2020: R+29.3 2016: R+31.4 2012: R+30.7 2008: R+24.4
Not yet ingested
- Civics
- —
Market trends
- HPI YoY
- ▼ -2.00%
- Current HPI
- 196.1506
- Rent YoY
- —
- Metro
- —
- State GDP YoY
- ▲ 4.54%
- F500 in state
- 20
Industry mix (Fortune 500 HQ in AZ)
| Industry | F500 HQs | Revenue |
|---|---|---|
| Technology | 2 | $13B |
|
||
| Mining / Metals | 1 | $23B |
|
||
| Environmental Services | 1 | $16B |
|
||
| Metals / Steel | 1 | $14B |
|
||
| Technology Distribution | 1 | $9B |
|
||
| Homebuilding | 1 | $8B |
|
||
Price history
1 event — show timeline
- 2026-06-01 Listed $160,000 PAARMLS as Distributed by MLS Grid
Cash-flow waterfall
monthlySold comps — $/sqft
last 12 mo · ≤1 miLoading sold comps…