110134 4696 Rd · Muldrow, OK
Flood risk No data
- FEMA flood zone
- —
- Chance of flooding over 30 yrs
- —
- Est. flood insurance / yr
- —
Fire risk No data
- Est. fire insurance / yr
- —
Heat risk No data
- Hot days now (above threshold)
- —
- Hot days in 30 yrs
- —
Wind risk No data
- Chance of severe wind over 30 yrs
- —
Air-quality risk No data
- Unhealthy air days now
- —
- Unhealthy air days in 30 yrs
- —
Risk factors via First Street. Map © Google.
Why this score? — see what drove the C grade
The composite is a weighted blend of 9 inputs, each scored 0–100. Each bar is that input's sub-score; the figure is the points it added to the 100-point composite (weight × sub-score).
- Cash flow +18.1/30.0
- Appreciation +10.0/10.0
- ARV discount +7.5/15.0
- DSCR +5.7/10.0
- 1% rule +3.8/10.0
- Livability +2.8/5.0
- Condition / age +2.8/5.0
- Rent growth +2.5/5.0
- Schools +2.2/10.0
$134,997
🖨 Deal sheet (PDF) 📄 Offer letter ✓ Due diligence
Listing remarks
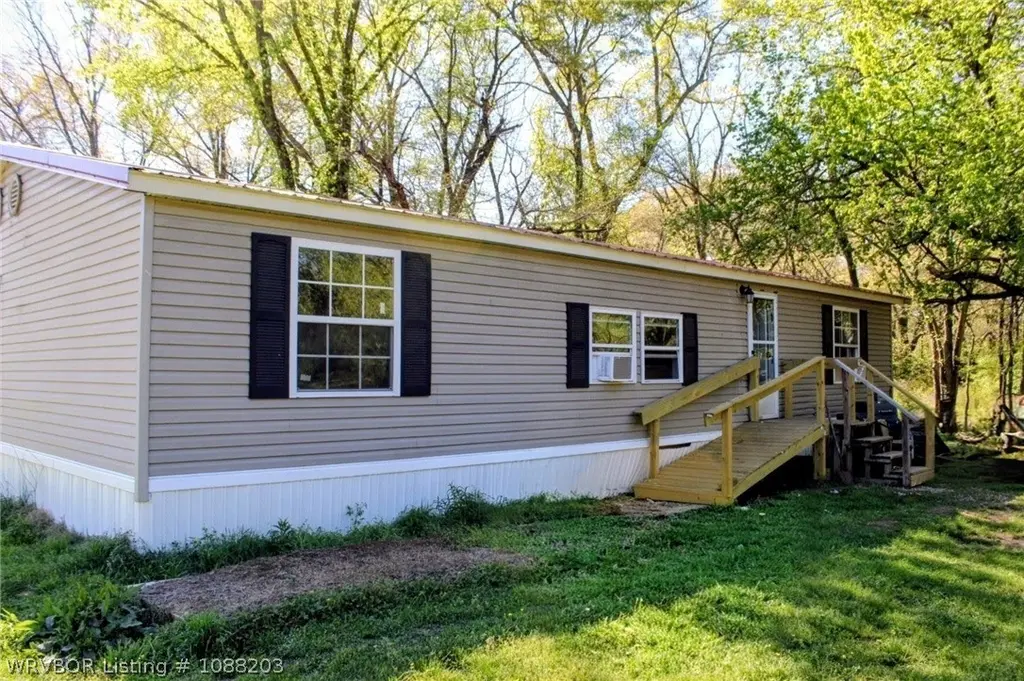
Seller offering up to $3,000 toward buyer's closing costs, prepaids, and lender-approved expenses at closing with an acceptable offer. Peaceful 5-acre property located on a quiet dead-end road, offering privacy, mature shade trees, and a calm country setting. The land includes pecan, walnut, mulberry, and chestnut trees, a private creek, and frequent wildlife. The 3 bedroom, 2 bathroom, 1,456 sq ft home features several important updates: all-new plumbing, new electric, an aerobic septic system, and a metal roof installed in 2022. Three window air units are included, with one being brand-new and unused this season. Washer and dryer remain with the home. A culvert drain was added in recent y
Key facts
- 19x20 metal shed
- Private creek
- Mature shade trees
Tags
Property features AI
Exterior
- Security: Smoke detector(s)
- Utilities: Public water; Septic tank; Electricity available; Phone available; Water available
- Home design: Residential mobile home; Single-story (one level)
- Construction: Aluminum siding; Block foundation; Metal roof; Manufactured home (Spirit)
- Exterior features: Fenced yard (full); Cleared and wooded areas; Corner lot; Workshop; Outbuilding
Interior
- Kitchen: Dishwasher; Oven; Range; Range hood; Refrigerator; Water heater
- Flooring: Laminate
- Bathrooms: 2 full bathrooms
- Heating & cooling: Window unit cooling; Ceiling fan cooling
- Interior features: Ceiling fans; Walk-in closets; Smoke detectors
- Laundry & utility: Washer; Dryer; Washer hookup; Electric dryer hookup
Neighborhood map
What this means for you Summary
Snapshot
- This is a 3-bed/2.0-bath manufactured listed at $135k. Condition is rated average.
Deal economics
- At list price, monthly cash flow is $118 ($1k/yr) — positive.
- The deal already cash-flows at list — no discount required.
- To meet the 1% rule (rent ≥ 1% of price), the offer needs to be $119k (11.6% below list).
- Recommended offer: $119k (11.6% below list) — sets the bar for 1% rule.
- Cap rate 7.3% vs local median 3.8% in Muldrow — top-decile yield for the area; either an underpriced asset or a hidden risk that comps aren't pricing in. Stress-test before assuming the spread holds.
Location & tenants
- Location reads 56/100 on livability (#505 in OK) — a working-class tenant base; expect higher turnover. Strengths: cost of living A+, housing A; Watch: crime F, amenities F, commute F.
- Gans (rural): math 20% / reading 25% proficiency, ranked #379 of 513 in OK (top 74%) — low school quality limits family demand, transient renter base, plan for 1-2y turnover; 69% free/reduced lunch — lower-income household profile, screen leases tightly.
- Zoned schools: Gans Es (math 17% / reading 22%, grade F, #479 of 845 statewide, top 63%, 239 students, 0% FRL); Gans Hs (math 10% / reading 10%, grade F, #361 of 447 statewide, top 94%, 107 students, 0% FRL) — zoned schools average 0% FRL vs 69% district-wide (69 pts lower); this property's tenant base skews higher-income than the district average.
- Market conditions: 109 active listings in the ZIP; 125 units permitted in Sequoyah County in 2024 (0 in 5+ unit buildings).
Forward outlook
- In year one you build about $14k of equity ($934 loan paydown + $14k appreciation (10.0% local appreciation)).
- Sequoyah County population projected at -16% by 2050 — secular population decline; favor cash flow + early exit over multi-decade hold.
- At projected returns (10.0% appreciation + 3.0% rent growth), your $38k cash investment doubles in ~3 years — after that, you're playing with house money.
- By year 3, paydown + projected appreciation supports a ~$37k cash-out refi (75% LTV) — recoverable capital for the next deal without selling this one.
Negotiation context
- It's been on market 72 days — a 6% lower offer ($127k) is reasonable based on typical stale-listing flexibility.
- 3 sale attempts with the ask held roughly flat each time — persistent listings suggest the price (not the market) is what's stuck; bring a comps-based counter.
Questions for the listing agent
- It's been on market 72 days. Have you received any prior offers? Is the seller open to a 12% concession, seller financing, or rate buy-down credit?
- Why hasn't it sold? Are there any deal-killer items the seller is aware of (foundation, flood, title, zoning, code violations)?
- Is there a deadline driving the sale (1031 exchange, divorce, estate, relocation)? That informs how much negotiation room exists.
- Schools are F-rated, which usually means shorter tenancies and higher turnover. Who's the typical renter profile here, and what's been the actual vacancy rate?
- Crime grade is F in this area — have there been break-ins, vandalism, or insurance claims at this property in the last 3 years? What carrier currently insures it and at what premium?
- What's the average days-on-market for RENTAL listings here right now (not sales)? A rising rental-DOM trend means longer vacancies and softer asking-rent achievability than the comps imply.
- What's the recent tenant-quality profile in this submarket — average credit score on applications, eviction rate, late-payment / NSF rate, and stable-employment percentage? A property-management company in the area should have these aggregated.
- How much new for-sale + rental construction is in the pipeline within 1–3 miles? Heavy new supply typically softens prices + rents 12–24 months out; constrained supply supports both.
Investment metrics
- 1% rule
- 0.88% ✗
- Cap rate
- 7.35%
- Cash-on-cash
- 3.76%
- DSCR
- 1.17
- GRM
- 9.4
CMA / ARV
No comps found within radius.
Projected returns pro-forma
10.0% appreciation · 3.0% rent growth · sell at horizon
- IRR
- 27.0%
- Equity multiple
- 3.14×
- Total profit
- $81,013
- Equity at exit
- $121,616
- IRR
- 23.6%
- Equity multiple
- 7.15×
- Total profit
- $232,545
- Equity at exit
- $262,269
Cash invested: $37,799 (down + closing). Projections, not guarantees.
Landlord ↔ Tenant lean methodology
- Overall (STATE)
- 83 Strongly Landlord-Friendly
- State Oklahoma
- 83 Strongly Landlord-Friendly · R+20
- County
- — inherits STATE
- City
- — inherits STATE
ZIP-level market 74948
- Home prices YoY
- 17.6%
- Active inventory
- 109
- Price-to-rent
- 9.4×
Monthly cashflow live
- Estimated rent
- $1,194 medium interval (Pro) →
- Mortgage (P&I)
- −$708
- Tax from tax record
- −$60 /mo · $726/yr
- Insurance
- −$56
- HOA
- −$0
- Vacancy / Maint / Mgmt
- −$251
- Net cashflow
- $118
Break-even live
Sensitivity live
| Price | -10% $195 | -5% $157 | +0% $118 | +5% $80 | +10% $42 |
|---|---|---|---|---|---|
| Rent | -10% $24 | -5% $71 | +0% $118 | +5% $166 | +10% $213 |
| Rate | -1.0pp $186 | -0.5pp $153 | base $118 | +0.5pp $83 | +1.0pp $48 |
UW: 25.0% down · 7.5% · 30yr · 1.5% tax · 5.0% vac · 8.0% maint · 8.0% mgmt
Financing live
Cash to close
- Down payment
- $33,749
- Closing costs
- $4,050
- Reserves months
- —
- Total cash needed
- —
Loan-product check · same deal, 3 products live
Conventional
25% down · 7.5% · 30yr
- Down + closing
- —
- Monthly P&I
- —
- Monthly cashflow
- —
- DSCR
- —
- Eligible?
- —
Personal DTI + credit; lowest rate.
DSCR
20% down · 8.5% · 30yr
- Down + closing
- —
- Monthly P&I
- —
- Monthly cashflow
- —
- DSCR
- —
- Eligible?
- —
No personal income docs; deal must DSCR.
Hard money
10% down · 12.0% · 12mo
- Down + closing
- —
- Monthly P&I
- —
- Monthly cashflow
- —
- DSCR
- —
- Eligible?
- —
Short-term bridge; refi at stabilization.
Listing history 21 events
-
2026-06-18days on market $134,997 Active 72 DOM
-
2026-06-17days on market $134,997 Active 71 DOM
-
2026-06-16days on market $134,997 Active 70 DOM
-
2026-06-15days on market $134,997 Active 69 DOM
-
2026-06-13days on market $134,997 Active 67 DOM
-
2026-06-12remarks 699-char remark
-
2026-06-12pricedays on market $134,997 Active 66 DOM
-
2026-06-09days on market $139,000 Active 63 DOM
-
2026-06-08days on market $139,000 Active 62 DOM
-
2026-06-08days on market $139,000 Active 61 DOM
-
2026-06-05days on market $139,000 Active 59 DOM
-
2026-06-04days on market $139,000 Active 57 DOM
-
2026-06-02days on market $139,000 Active 56 DOM
-
2026-06-01days on market $139,000 Active 55 DOM
-
2026-05-31days on market $139,000 Active 54 DOM
-
2026-04-08$139,000 Active
-
2026-03-30price $130,000
-
2026-02-13price $135,000
-
2025-11-15$140,000 Active
-
2025-07-21price $140,000
-
2025-05-16$149,900 Active
ⓘ Source: listings_history table (triggers on properties + properties_extension) + one-shot
backfill from property_details.listing_events for pre-trigger history.
Tax reassessment forecast OK · Resets to sale price
- Current annual tax
- $726 · $60/mo
- Projected year-2 tax
- $1,215 · $101/mo
- Expected delta
- +$489/yr (+$41/mo · 67.4%)
ⓘ Screening estimate from a state-policy table — verify with the county assessor before closing.
Nearby sold comps map
Loading sold comps map…
Walkable amenities ~0.75 mi
Loading nearby amenities…
Taxation est. · year 1
- Rental income
- $14,325
- − Mortgage interest
- −$7,562
- − Property taxes
- −$726
- − Insurance
- −$675
- − Repairs & maintenance
- −$1,146
- − Management
- −$1,146
- − Depreciation
- −$3,927
- Taxable loss
- −$857
- Est. tax savings @ 24.0%
- +$206
- After-tax cash flow
- $1,626/yr
For passive investors: Depreciation is non-cash, so a rental often shows a tax loss while cash-flowing — sheltering income. Rental losses are passive: they offset passive income freely, and up to $25,000/yr can offset ordinary (W-2) income if you actively participate and your MAGI is under $100k (phasing out to $0 by $150k); unused losses carry forward. On sale, claimed depreciation is recaptured at up to 25%, and gains may owe capital-gains tax (a 1031 exchange can defer both). Figures are a year-1 estimate at your 24.0% rate — not tax advice; consult a CPA.
Condition & rehab AI · 12 photos
A moderately rehabbed home with average condition, requiring exterior updates and landscaping to boost its resale and rental value.
Repairs flagged
- Moderate Exterior siding — Weathered appearance
- Minor Landscaping — Overgrown grass and weeds
Value-add opportunities
- Both Paint interior walls — Fresh paint enhances curb appeal and interior aesthetics
- Both Replace exterior siding — New siding improves curb appeal and durability
- Both Landscaping and yard maintenance — Well-maintained landscaping enhances curb appeal and property value
Renovation cost estimate screening
| Repair item | Severity | Est. cost |
|---|---|---|
| Exterior siding · Weathered appearance | Moderate | $3,000–15,000 |
| Landscaping · Overgrown grass and weeds | Minor | $500–3,000 |
| Total estimated repair cost · 2 items | $3,500–18,000 |
Value-add ROI direction
- Both Paint interior walls — Fresh paint enhances curb appeal and interior aesthetics ↑
- Both Replace exterior siding — New siding improves curb appeal and durability ↑
- Both Landscaping and yard maintenance — Well-maintained landscaping enhances curb appeal and property value ↑
ⓘ Cost ranges are severity-bucket heuristics (US national rule-of-thumb). Get contractor quotes + a written scope before underwriting a rehab budget.
Schools (NCES district)
- District
- Gans
- NCES district ID
- 4012390
- Math proficiency
- 20% ▲ 5.00%
- Reading proficiency
- 25% ▬ 0.00%
- Median HH income
- $39,614
- Composite
- 22.13/100
- National rank
- #13526
- State rank
- #379 of 513 in OK
Livability — Muldrow
- Score
- 56/100
- State rank
- #505
- US rank
- #22502
Category grades
Schools grade is shown separately in the Schools card above.
Census & demographics
- Population (ZIP)
- 11,946
Population outlook (Sequoyah County) Hauer SSP2
- Today (2025)
- 39,398 people
- By 2030
- 38,215 · -3.0%
- By 2040
- 35,625 · -9.6%
- By 2050
- 32,943 · -16.4%
- By 2075
- 27,805 · -29.4%
- By 2100
- 23,311 · -40.8%
Race, ethnicity, and origin ACS 2023
- Neighborhood character
- Diverse neighborhood (Simpson 0.59)
- Race & ethnicity
- White 64% Native American 16% Two or more races 15% Hispanic / Latino 6% Asian 1%
- Hispanic origin (detail)
- Mexican 5%
- Common ancestry
- Italian 1% Slovak 1% Serbian 1%
- Foreign-born
- 3% · Canada
- Languages at home
- 92% English-only · Spanish 5% Tagalog/Filipino 1%
Political lean MEDSL · Sequoyah
- 2024 margin
- Solid R (+61.5) · D 18.6% · R 80.2% · Other 1.2%
- 2008→2024 swing
- -25.5pp toward R · 2008: -36.0pp · 2024: -61.5pp
- All cycles
- 2024: R+61.5 2020: R+59.0 2016: R+54.2 2012: R+39.1 2008: R+36.0
Not yet ingested
- Civics
- —
Market trends
- HPI YoY
- ▲ 38.01%
- Current HPI
- 253.7544
- Rent YoY
- —
- Metro
- —
- State GDP YoY
- ▲ 1.55%
- F500 in state
- 6
Industry mix (Fortune 500 HQ in OK)
| Industry | F500 HQs | Revenue |
|---|---|---|
| Energy | 3 | $48B |
|
||
Price history
-7.3% since first listed6 events — show timeline
- 2026-04-08 Listed $139,000 WRVBOR
- 2026-03-30 Price Changed $130,000 WRVBOR
- 2026-02-13 Price Changed $135,000 WRVBOR
- 2025-11-15 Listed $140,000 WRVBOR
- 2025-07-21 Price Changed $140,000 WRVBOR
- 2025-05-16 Listed $149,900 WRVBOR
Property tax history
+983.6%/yrLatest (2025): $726 · +983.6% YoY. Source: county tax records.
Cash-flow waterfall
monthlySold comps — $/sqft
last 12 mo · ≤1 miLoading sold comps…