 Triplex
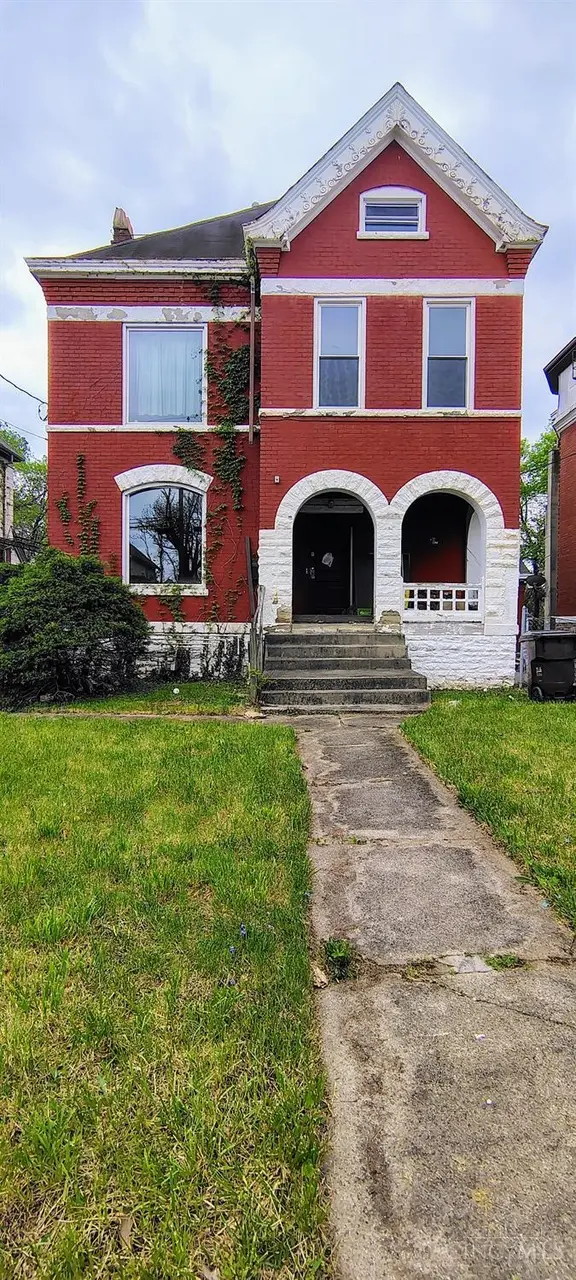
837 Hutchins Ave · Cincinnati, OH
Flood risk 1/10 · Minimal
- FEMA flood zone
- X (unshaded)
- Chance of flooding over 30 yrs
- 0.0%
- Est. flood insurance / yr
- $473 – $860
Fire risk 1/10 · Minimal
- Est. fire insurance / yr
- $713 – $1,323
Heat risk 4/10 · Minor
- Hot days now (above 103°F)
- 7 days/yr
- Hot days in 30 yrs
- 18 days/yr
Wind risk 2/10 · Minimal
- Chance of severe wind over 30 yrs
- 1.0%
Air-quality risk 3/10 · Minor
- Unhealthy air days now
- 2 days/yr
- Unhealthy air days in 30 yrs
- 3 days/yr
Risk factors via First Street. Map © Google.
Why this score? — see what drove the C grade
The composite is a weighted blend of 9 inputs, each scored 0–100. Each bar is that input's sub-score; the figure is the points it added to the 100-point composite (weight × sub-score).
- Cash flow +29.1/30.0
- DSCR +10.0/10.0
- 1% rule +7.9/10.0
- Livability +4.0/5.0
- Rent growth +3.9/5.0
- Schools +2.5/10.0
- Condition / age +2.5/5.0
- ARV discount +0.0/15.0
- Appreciation +0.0/10.0
$260,000
🖨 Deal sheet (PDF) 📄 Offer letter ✓ Due diligence
Multi-family units
County records classify this as Multi-Family (2-4 Unit). Listing-text estimate: 3 units. confirmed
Listing remarks MLS
Fantastic opportunity! 3 2bedroom units and 1 1bedroom. Utilities are separate to each unit. Great income ability, ready to rehab.
Key facts
- Strong rental pool
- 7,275 sq ft lot
- 4 parking spots
Tags
Property features AI
Finance
- Financial info: Property is a 3-unit income building; Two 2-bedroom units rented at $1,200 each; One 3-bedroom unit rented at $1,500; Currently listed as vacant
Exterior
- Parking: 4 open parking spaces; Concrete driveway; Off-street parking; On-street parking; Private parking areas; Gravel parking
- Utilities: Public water; Public sewer; Natural gas
- Home design: Triplex; Three+ levels; Faces Reading Road vicinity
- Construction: Stone foundation; Stone and brick exterior; Shingle roof
- Exterior features: Front porch; Metal fence; Busline nearby; Handyman special
Interior
- Bedrooms: Unit 1: 3 bedrooms; Unit 2: 2 bedrooms; Unit 3: 2 bedrooms
- Bathrooms: Unit 1: 2 full bathrooms; Unit 2: 1 full bathroom; Unit 3: 1 full bathroom
- Heating & cooling: Forced air heating (gas); Window unit cooling; Tenants pay heat
- Interior features: Full basement; Individual laundry; Smoke alarm; Dehumidifier; Spiral staircase
- Laundry & utility: Individual laundry (on-site); Separate furnace for units; Separate A/C for units; Separate gas/electric for units
Neighborhood map
What this means for you Summary
Snapshot
- This is a 3 × 2-bed/1.3-bath units multifamily listed at $260k.
Deal economics
- At list price, monthly cash flow is $901 ($11k/yr) — positive. Per door: $300/mo.
- The deal already cash-flows at list — no discount required.
- Meets the 1% rule at list price ($3k rent vs $260k).
- Recommended offer: $244k (6.0% below list) — sets the bar for market timing.
- Cap rate 10.5% vs local median 3.9% in Cincinnati — top-decile yield for the area; either an underpriced asset or a hidden risk that comps aren't pricing in. Stress-test before assuming the spread holds.
Location & tenants
- Location reads 80/100 on livability (#130 in OH, #1,856 nationally) — a professional / high-income tenant draw. Strengths: amenities A+, commute A+, cost of living A+; Watch: employment D, crime F.
- Cincinnati Public Schools (urban): math 25% / reading 36% proficiency, ranked #581 of 656 in OH (top 89%) — families likely to look elsewhere, expect single-tenant / working-renter base with shorter leases; 70% free/reduced lunch — lower-income household profile, screen leases tightly.
- Zoned schools: Sands Montessori School (math 70% / reading 77%, grade A, #311 of 1,584 statewide, top 20%, 683 students, 22% FRL); Hartwell School (math 17% / reading 31%, grade F, #593 of 654 statewide, top 91%, 447 students, 0% FRL); Walnut Hills High School (math 79% / reading 89%, grade A, #17 of 781 statewide, top 2%, 2,582 students, 14% FRL) — zoned schools average 12% FRL vs 70% district-wide (59 pts lower); this property's tenant base skews higher-income than the district average.
- Zoned-school proficiency averages 60% at this address vs 30% district-wide (+30 pts) — the actual schools serving this property are materially stronger than the Cincinnati Public Schools average implies; a family-tenant draw the district grade alone would hide.
- Market conditions: Rents rising fast (+5.5%/yr); 49 active listings in the ZIP; 2 comparable units currently listed for rent nearby; lower-income renter base — watch delinquency; 801 units permitted in Hamilton County in 2024 (190 in 5+ unit buildings).
- At $3,342/mo this rent would consume 124% of the median local household income ($32k/yr) (locally 1730% of renters already pay >50% of income on rent) — very limited rent-growth headroom before tenants either downsize or default.
Forward outlook
- Local home prices are declining (-3.0%/yr); year-one equity from $2k of loan paydown is wiped out by about $8k of value loss. Plan a longer hold.
- At projected returns (-3.0% appreciation + 5.5% rent growth), your $73k cash investment doubles in ~7 years — after that, you're playing with house money.
Negotiation context
- It's been on market 63 days — a 6% lower offer ($244k) is reasonable based on typical stale-listing flexibility.
- 6 sale attempts since 12y ago; this cycle's ask has dropped $15k (5%) from the opening price — seller is motivated, your offer sets the floor, not the list.
- Current owner paid $1k; list at $260k implies a 25900% gain — meaningful room to come down on a strong offer.
Risks & watch-outs
- Watch-outs: built in 1890 — expect roof / HVAC / electrical / plumbing capex.
Questions for the listing agent
- It's been on market 63 days. Have you received any prior offers? Is the seller open to a 6% concession, seller financing, or rate buy-down credit?
- Can we see the unit-by-unit rent roll, current vacancy, and any below-market leases? What's the average tenancy length?
- What capital expenditures (roof, boiler, parking lot, exteriors) have been made in the last 5 years, and what's planned in the next 2?
- Built in 1890 — when were the roof, HVAC, electrical panel, plumbing, and water heater last replaced?
- Why hasn't it sold? Are there any deal-killer items the seller is aware of (foundation, flood, title, zoning, code violations)?
- Is there a deadline driving the sale (1031 exchange, divorce, estate, relocation)? That informs how much negotiation room exists.
- Schools are B-rated — typically a magnet for longer-tenancy family renters. What's the average tenant stay here, and is there a school-zone premium baked into asking?
- Crime grade is F in this area — have there been break-ins, vandalism, or insurance claims at this property in the last 3 years? What carrier currently insures it and at what premium?
- What's the average days-on-market for RENTAL listings here right now (not sales)? A rising rental-DOM trend means longer vacancies and softer asking-rent achievability than the comps imply.
- What's the recent tenant-quality profile in this submarket — average credit score on applications, eviction rate, late-payment / NSF rate, and stable-employment percentage? A property-management company in the area should have these aggregated.
- How much new apartment / multifamily construction is in the pipeline within 1–3 miles? Heavy new supply (>2% of stock underway) typically softens rents 12–24 months out; light construction supports rent growth.
Investment metrics
- 1% rule
- 1.29% ✓
- Cap rate
- 10.45%
- Cash-on-cash
- 14.85%
- DSCR
- 1.66
- GRM
- 6.5
CMA / ARV
- ARV (on-the-fly)
- $194,880
- Comps found
- 8
Show comp detail 8 sales within ~0.75 mi
| Address | Dist | Beds/Ba | Sqft | Sold | Price | $/sf | Match |
|---|---|---|---|---|---|---|---|
| 988 Cleveland Ave | 0.22mi | 5/— (-1) | 2,797 (+0%) | 10mo | $195,000 | $70 | 76 |
| 848 Windham Ave | 0.13mi | 5/3.0 (-1) | 2,752 (-1%) | 24mo | $289,000 | $105 | 67 |
| 844 Windham Ave | 0.14mi | 5/2.5 (-1) | 2,487 (-11%) | 7mo | $241,000 | $97 | 63 |
| 3322 Perkins Ave | 0.34mi | 6/3.0 | 3,080 (+11%) | 21mo | $82,000 | $27 | 49 |
| 518 Forest Ave | 0.49mi | 6/— | 3,028 (+9%) | 19mo | $167,400 | $55 | 47 |
| 571 Blair Ave | 0.47mi | 7/3.0 (+1) | 3,092 (+11%) | 10mo | $240,000 | $78 | 46 |
| 521 Carplin Pl | 0.67mi | 5/3.0 (-1) | 3,037 (+9%) | 11mo | $88,500 | $29 | 40 |
| 1560 Dixmont Ave | 0.73mi | 6/2.0 | 2,506 (-10%) | 19mo | $107,250 | $43 | 29 |
Match score weights: distance 35% · size 25% · config 20% · recency 20%. Top-matched comps best support the ARV.
Projected returns pro-forma
-3.0% appreciation · 5.55% rent growth · sell at horizon
- IRR
- 8.2%
- Equity multiple
- 1.33×
- Total profit
- $24,070
- Equity at exit
- $38,767
- IRR
- 19.5%
- Equity multiple
- 2.83×
- Total profit
- $132,942
- Equity at exit
- $22,480
Cash invested: $72,800 (down + closing). Projections, not guarantees.
Landlord ↔ Tenant lean methodology
- Overall (STATE)
- 73 Landlord-Friendly
- State Ohio
- 73 Landlord-Friendly · R+6
- County
- — inherits STATE
- City
- — inherits STATE
ZIP-level market 45229
- Home prices YoY
- -24.0%
- Rents YoY
- 5.5%
- Active inventory
- 49
- Price-to-rent
- 19.4×
Monthly cashflow live
- Estimated rent
- $3,342 high interval (Pro) →
- Mortgage (P&I)
- −$1,363
- Tax from tax record
- −$267 /mo · $3,207/yr
- Insurance
- −$108
- HOA
- −$0
- Vacancy / Maint / Mgmt
- −$702
- Net cashflow
- $901
Break-even live
Sensitivity live
| Price | -10% $1,048 | -5% $975 | +0% $901 | +5% $828 | +10% $754 |
|---|---|---|---|---|---|
| Rent | -10% $637 | -5% $769 | +0% $901 | +5% $1,033 | +10% $1,165 |
| Rate | -1.0pp $1,032 | -0.5pp $967 | base $901 | +0.5pp $834 | +1.0pp $765 |
3-unit breakdown (identical units grouped — click to expand)
| Units | Beds | Baths | Est. rent |
|---|---|---|---|
| 3× units | 2 | 1.3 | $3,342 |
| #1 | 2 | 1.3 | $1,114 |
| #2 | 2 | 1.3 | $1,114 |
| #3 | 2 | 1.3 | $1,114 |
| Total (3 units) | $3,342 | ||
UW: 25.0% down · 7.5% · 30yr · 1.5% tax · 5.0% vac · 8.0% maint · 8.0% mgmt
Financing live
Cash to close
- Down payment
- $65,000
- Closing costs
- $7,800
- Reserves months
- —
- Total cash needed
- —
Loan-product check · same deal, 3 products live
Conventional
25% down · 7.5% · 30yr
- Down + closing
- —
- Monthly P&I
- —
- Monthly cashflow
- —
- DSCR
- —
- Eligible?
- —
Personal DTI + credit; lowest rate.
DSCR
20% down · 8.5% · 30yr
- Down + closing
- —
- Monthly P&I
- —
- Monthly cashflow
- —
- DSCR
- —
- Eligible?
- —
No personal income docs; deal must DSCR.
Hard money
10% down · 12.0% · 12mo
- Down + closing
- —
- Monthly P&I
- —
- Monthly cashflow
- —
- DSCR
- —
- Eligible?
- —
Short-term bridge; refi at stabilization.
Rent comps 2 comps
| Address | Beds | Baths | Sqft | Rent | $/sqft | DOM | Units | Dist |
|---|---|---|---|---|---|---|---|---|
| 3028 Gilbert Ave Cincinnati, OH | 5.0 | 1.5 | 1936 | $1,700 | $0.88 | 22d | 1 | 0.69mi |
| 1768 Williams Ave Cincinnati, OH | 6.0 | 3.0 | 2594 | $3,000 | $1.16 | 46d | 1 | 1.26mi |
Listing history 31 events
-
2026-06-21days on market $260,000 Active 63 DOM
-
2026-06-18days on market $260,000 Active 60 DOM
-
2026-06-17days on market $260,000 Active 59 DOM
-
2026-06-16days on market $260,000 Active 58 DOM
-
2026-06-15days on market $260,000 Active 57 DOM
-
2026-06-13days on market $260,000 Active 55 DOM
-
2026-06-13days on market $260,000 Active 54 DOM
-
2026-06-09days on market $260,000 Active 51 DOM
-
2026-06-08days on market $260,000 Active 50 DOM
-
2026-06-07days on market $260,000 Active 49 DOM
-
2026-06-03days on market $260,000 Active 45 DOM
-
2026-06-02days on market $260,000 Active 44 DOM
-
2026-06-01days on market $260,000 Active 43 DOM
-
2026-05-31days on market $260,000 Active 42 DOM
-
2026-04-30price $260,000
-
2026-04-19$275,000 Active
-
2016-03-17soldstatus $1,000 Sold 130-char remark
Show marketing remark (130 chars)
Fantastic opportunity! 3 2bedroom units and 1 1bedroom. Utilities are separate to each unit. Great income ability, ready to rehab.
-
2016-03-15historical Accept Backup Offers 130-char remark
Show marketing remark (130 chars)
Fantastic opportunity! 3 2bedroom units and 1 1bedroom. Utilities are separate to each unit. Great income ability, ready to rehab.
-
2015-12-02$24,000 Active 130-char remark
Show marketing remark (130 chars)
Fantastic opportunity! 3 2bedroom units and 1 1bedroom. Utilities are separate to each unit. Great income ability, ready to rehab.
-
2015-11-22historical
-
2015-10-08status Active
-
2015-09-04historical Accept Backup Offers
-
2015-07-02status Active
-
2015-06-23historical Accept Backup Offers
-
2015-05-27$24,000 Active
-
2015-04-03historical
-
2015-03-17soldstatus $7,000 Sold
-
2015-02-13status Pending
-
2014-11-11$9,900 Active
-
2006-04-28soldstatus $137,500
-
2002-05-30soldstatus $65,000
ⓘ Source: listings_history table (triggers on properties + properties_extension) + one-shot
backfill from property_details.listing_events for pre-trigger history.
Tax reassessment forecast OH · Partial reset (capped growth)
- Current annual tax
- $3,207 · $267/mo
- Projected year-2 tax
- $3,631 · $303/mo
- Expected delta
- +$425/yr (+$35/mo · 13.2%)
ⓘ Screening estimate from a state-policy table — verify with the county assessor before closing.
Climate risk First Street
- Flood 1/10 Low FEMA zone X (unshaded) · 0% chance over 30 yrs
- Wildfire 1/10 Low
- Heat 4/10 Moderate 7 d/yr ≥103°F today · 18 d/yr by 30 yrs out
- Wind 2/10 Low 100% chance of damaging wind over 30 yrs
- Air quality 3/10 Moderate 2 unhealthy d/yr today · 3 by 30 yrs out
Nearby sold comps map
Loading sold comps map…
Walkable amenities ~0.75 mi
Loading nearby amenities…
Taxation est. · year 1
- Rental income
- $40,104
- − Mortgage interest
- −$14,564
- − Property taxes
- −$3,207
- − Insurance
- −$1,300
- − Repairs & maintenance
- −$3,208
- − Management
- −$3,208
- − Depreciation
- −$7,564
- Taxable income
- $7,053
- Est. tax owed @ 24.0%
- −$1,693
- After-tax cash flow
- $9,121/yr
For passive investors: Depreciation is non-cash, so a rental often shows a tax loss while cash-flowing — sheltering income. Rental losses are passive: they offset passive income freely, and up to $25,000/yr can offset ordinary (W-2) income if you actively participate and your MAGI is under $100k (phasing out to $0 by $150k); unused losses carry forward. On sale, claimed depreciation is recaptured at up to 25%, and gains may owe capital-gains tax (a 1031 exchange can defer both). Figures are a year-1 estimate at your 24.0% rate — not tax advice; consult a CPA.
Schools (NCES district)
- District
- Cincinnati Public Schools
- NCES district ID
- 3904375
- Math proficiency
- 25% ▼ -19.00%
- Reading proficiency
- 36% ▼ -14.00%
- Median HH income
- $35,743
- Composite
- 25.21/100
- National rank
- #7508
- State rank
- #581 of 656 in OH
Livability — Cincinnati
- Score
- 80/100
- State rank
- #130
- US rank
- #1856
Category grades
Schools grade is shown separately in the Schools card above.
Census & demographics
- Census place
- Cincinnati, OH
- County
- Hamilton County · 701,295 people
- City population
- 505,555
- Metro
- Cincinnati, OH-KY-IN
- Population (ZIP)
- 13,529
- Household income
- $32,263
- Rent vs Own
- Severe rent burden
- 1730.0
Population outlook (Hamilton County) Hauer SSP2
- Today (2025)
- 826,054 people
- By 2030
- 830,947 · +0.6%
- By 2040
- 832,319 · +0.8%
- By 2050
- 822,428 · -0.4%
- By 2075
- 788,688 · -4.5%
- By 2100
- 710,674 · -14.0%
Race, ethnicity, and origin ACS 2023
- Neighborhood character
- Predominantly Black (65%)
- Race & ethnicity
- Black 65% White 24% Two or more races 5% Hispanic / Latino 4% Asian 1%
- Common ancestry
- Italian 2% Iranian 1% Lithuanian 1%
- Foreign-born
- 5% · Canada
- Languages at home
- 93% English-only · Spanish 4% Russian/Polish/Slavic 1% Other Indo-European 1%
Political lean MEDSL · Hamilton
- 2024 margin
- D (+14.9) · D 57.0% · R 42.1%
- 2008→2024 swing
- +7.9pp toward D · 2008: 7.0pp · 2024: 14.9pp
- All cycles
- 2024: D+14.9 2020: D+15.9 2016: D+9.5 2012: D+4.9 2008: D+7.0
Not yet ingested
- Civics
- —
Market trends
- HPI YoY
- ▼ -80.34%
- Current HPI
- 254.492
- Rent YoY
- ▲ 5.55%
- Metro
- Cincinnati, OH-KY-IN
- State GDP YoY
- ▲ 1.98%
- F500 in state
- 48
Industry mix (Fortune 500 HQ in OH)
| Industry | F500 HQs | Revenue |
|---|---|---|
| Insurance | 3 | $145B |
|
||
| Industrial Machinery | 3 | $49B |
|
||
| Financial Services | 3 | $24B |
|
||
| Consumer Goods | 2 | $93B |
|
||
| Aerospace / Defense | 2 | $47B |
|
||
| Utilities | 2 | $33B |
|
||
Price history
+300.0% since first listed17 events — show timeline
- 2026-04-30 Price Changed $260,000 Cincy MLS
- 2026-04-19 Listed $275,000 Cincy MLS
- 2016-03-17 Sold (MLS) $1,000 Cincy MLS
- 2016-03-15 Contingent — Cincy MLS
- 2015-12-02 Listed $24,000 Cincy MLS
- 2015-11-22 Listing Removed — Cincy MLS
- 2015-10-08 Relisted — Cincy MLS
- 2015-09-04 Contingent — Cincy MLS
- 2015-07-02 Relisted — Cincy MLS
- 2015-06-23 Contingent — Cincy MLS
- 2015-05-27 Listed $24,000 Cincy MLS
- 2015-04-03 Listing Removed — Cincy MLS
- 2015-03-17 Sold (MLS) $7,000 Cincy MLS
- 2015-02-13 Pending — Cincy MLS
- 2014-11-11 Listed $9,900 Cincy MLS
- 2006-04-28 Sold (Public Records) $137,500 Public Records
- 2002-05-30 Sold (Public Records) $65,000 Public Records
Property tax history
+2.7%/yrLatest (2025): $3,207 · +0.1% YoY. Source: county tax records.
Cash-flow waterfall
monthlySold comps — $/sqft
last 12 mo · ≤1 miLoading sold comps…