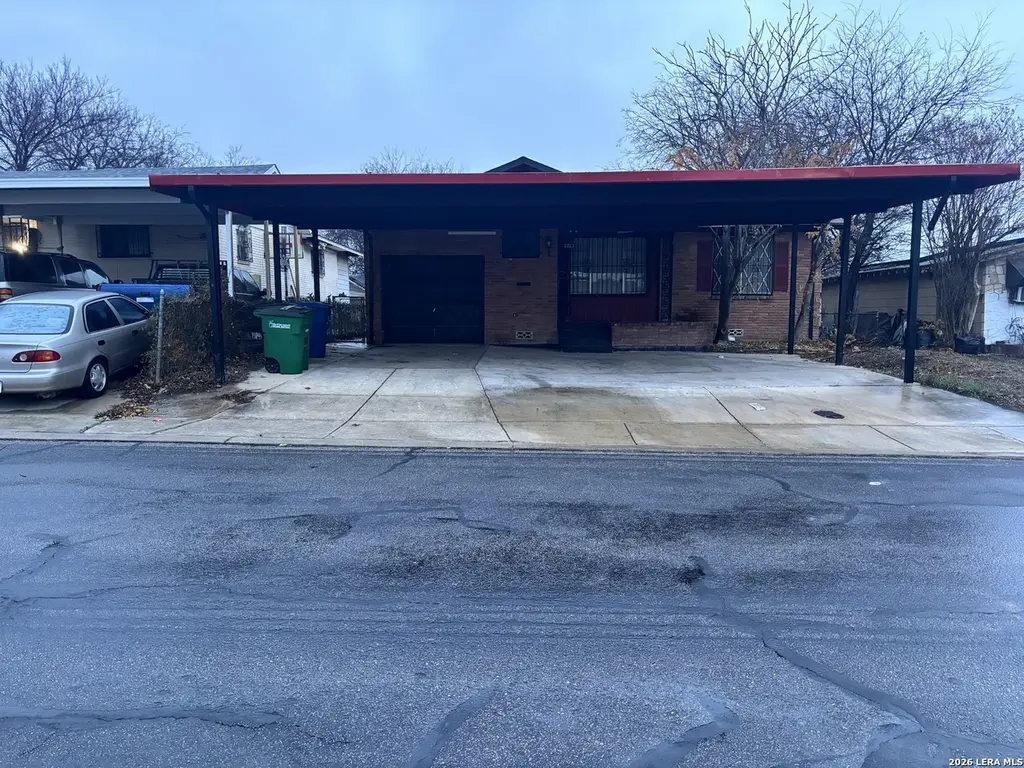
2223 Hays · San Antonio, TX
Flood risk 1/10 · Minimal
- FEMA flood zone
- X (unshaded)
- Chance of flooding over 30 yrs
- 0.0%
- Est. flood insurance / yr
- $507 – $1,088
Fire risk 1/10 · Minimal
- Est. fire insurance / yr
- $1,222 – $2,270
Heat risk 8/10 · Major
- Hot days now (above 108°F)
- 7 days/yr
- Hot days in 30 yrs
- 20 days/yr
Wind risk 8/10 · Major
- Chance of severe wind over 30 yrs
- 80.0%
Air-quality risk 2/10 · Minimal
- Unhealthy air days now
- 0 days/yr
- Unhealthy air days in 30 yrs
- 2 days/yr
Risk factors via First Street. Map © Google.
Why this score? — see what drove the C grade
The composite is a weighted blend of 9 inputs, each scored 0–100. Each bar is that input's sub-score; the figure is the points it added to the 100-point composite (weight × sub-score).
- ARV discount +13.9/15.0
- Cash flow +11.6/30.0
- Appreciation +10.0/10.0
- 1% rule +4.9/10.0
- Rent growth +4.5/5.0
- Livability +4.0/5.0
- DSCR +3.4/10.0
- Condition / age +2.5/5.0
- Schools +1.4/10.0
$174,900
🖨 Deal sheet (PDF) 📄 Offer letter ✓ Due diligence
Listing remarks MLS
Great Location - 5 minutes from Downtown! Nearby shopping & restaurants. This 4-bedroom, 2-bathroom, 2-living room home features hardwood flooring throughout, fresh paint, new cabinets, granite countertops, and backsplash. Easy access to the highway, shopping, and restaurants. This home is ready for its new owner. Please place bids via Xome.
Key facts
- Hardwood flooring
- Fresh paint
- New cabinets
Tags
Neighborhood map
What this means for you Summary
Snapshot
- This is a 3-bed/1.0-bath single-family listed at $175k.
Deal economics
- At list price, monthly cash flow is $-53 ($-642/yr) — negative.
- To cash-flow at today's rent, offer at most $165k (5.4% below list).
- To meet the 1% rule (rent ≥ 1% of price), the offer needs to be $174k (0.5% below list).
- Recommended offer: $159k (9.0% below list) — sets the bar for market timing.
- Cap rate 5.9% vs local median 3.8% in San Antonio — top-decile yield for the area; either an underpriced asset or a hidden risk that comps aren't pricing in. Stress-test before assuming the spread holds.
Location & tenants
- Location reads 80/100 on livability (#31 in TX, #1,616 nationally) — a professional / high-income tenant draw. Strengths: amenities A+, commute A+, cost of living A+; Watch: crime F.
- San Antonio ISD (urban): math 12% / reading 22% proficiency, ranked #805 of 826 in TX (top 98%) — low school quality limits family demand, transient renter base, plan for 1-2y turnover; 80% free/reduced lunch — lower-income household profile, screen leases tightly.
- Zoned schools: Pershing El (math 8% / reading 12%, grade F, #4,259 of 4,322 statewide, top 99%, 303 students, 96% FRL); Houston H S (math 12% / reading 18%, grade F, #1,507 of 1,632 statewide, top 93%, 856 students, 95% FRL) — zoned schools average 96% FRL vs 80% district-wide (16 pts higher); higher-poverty schools than district average — tighter screening recommended.
- Market conditions: Rents rising fast (+8.2%/yr); 201 active listings in the ZIP; 40 comparable units currently listed for rent nearby; rentals at typical pace (median 26d on market — plan ~3-4 weeks tenant-placement turnaround); 8,308 units permitted in Bexar County in 2024 (2,506 in 5+ unit buildings).
Forward outlook
- In year one you build about $19k of equity ($1k loan paydown + $17k appreciation (10.0% local appreciation)).
- Bexar County population projected at +50% by 2050 — long-run rental-demand tailwind backs the buy-and-hold thesis.
- At projected returns (10.0% appreciation + 8.0% rent growth), your $49k cash investment doubles in ~3 years — after that, you're playing with house money.
- By year 2, paydown + projected appreciation supports a ~$30k cash-out refi (75% LTV) — recoverable capital for the next deal without selling this one.
Negotiation context
- It's been on market 120 days — a 9% lower offer ($159k) is reasonable based on typical stale-listing flexibility.
- 5 sale attempts since 8y ago; this cycle's ask has dropped $35k (17%) from the opening price — seller is motivated, your offer sets the floor, not the list.
Risks & watch-outs
- Watch-outs: property tax is 3.0% of price; built in 1949 — expect roof / HVAC / electrical / plumbing capex.
- Climate carrying-cost: severe wind risk, 80% chance of damaging wind over 30y; extreme-heat days projected 7→20/yr by 2055 (HVAC capex compounding) — expect insurance premiums to compound above CPI over the hold.
Questions for the listing agent
- What do current leases actually rent for vs. the listed asking? Can we see a recent rent roll and the last 12 months of T-12 income?
- It's been on market 120 days. Have you received any prior offers? Is the seller open to a 9% concession, seller financing, or rate buy-down credit?
- Built in 1949 — when were the roof, HVAC, electrical panel, plumbing, and water heater last replaced?
- Property tax is high relative to price — has the assessment been appealed recently, and will the sale trigger a re-assessment?
- Why hasn't it sold? Are there any deal-killer items the seller is aware of (foundation, flood, title, zoning, code violations)?
- Is there a deadline driving the sale (1031 exchange, divorce, estate, relocation)? That informs how much negotiation room exists.
- Crime grade is F in this area — have there been break-ins, vandalism, or insurance claims at this property in the last 3 years? What carrier currently insures it and at what premium?
- What's the average days-on-market for RENTAL listings here right now (not sales)? A rising rental-DOM trend means longer vacancies and softer asking-rent achievability than the comps imply.
- What's the recent tenant-quality profile in this submarket — average credit score on applications, eviction rate, late-payment / NSF rate, and stable-employment percentage? A property-management company in the area should have these aggregated.
- How much new for-sale + rental construction is in the pipeline within 1–3 miles? Heavy new supply typically softens prices + rents 12–24 months out; constrained supply supports both.
Investment metrics
- 1% rule
- 0.99% ✗
- Cap rate
- 5.93%
- Cash-on-cash
- -1.31%
- DSCR
- 0.94
- GRM
- 8.4
CMA / ARV
- ARV (median comp)
- $204,011
- List price
- $174,900
- Delta
- -14.27%
- Verdict
- UNDERPRICED
- Comps
- 20 within 1.0 mi
Show comp detail 12 sales within ~0.75 mi
| Address | Dist | Beds/Ba | Sqft | Sold | Price | $/sf | Match |
|---|---|---|---|---|---|---|---|
| 1002 Onslow St | 0.27mi | 3/1.0 | 1,560 (-7%) | 2mo | $64,900 | $42 | 73 |
| 2215 Hays St | 0.02mi | 3/2.0 | 1,443 (-14%) | 12mo | $109,900 | $76 | 62 |
| 1801 Center | 0.55mi | 3/2.0 | 1,736 (+3%) | 5mo | $70,000 | $40 | 61 |
| 2521 E Houston St 1 | 0.55mi | 3/3.0 | 1,706 (+1%) | 4mo | $175,000 | $103 | 61 |
| 2135 Crockett | 0.47mi | 3/2.0 | 1,496 (-11%) | 4mo | $197,000 | $132 | 52 |
| 1735 Center | 0.58mi | 3/2.0 | 1,538 (-9%) | 4mo | $229,900 | $149 | 51 |
| 835 Canton | 0.41mi | 3/2.5 | 1,486 (-12%) | 10mo | $209,900 | $141 | 46 |
| 1430 Paso Hondo | 0.68mi | 3/2.0 | 1,500 (-11%) | 9mo | $325,000 | $217 | 39 |
| 1414 Paso Hondo | 0.70mi | 3/2.0 | 1,456 (-14%) | 3mo | $275,000 | $189 | 38 |
| 941 Potomac | 0.62mi | 4/2.0 (+1) | 1,839 (+9%) | 10mo | $155,000 | $84 | 38 |
| 1402 Sherman | 0.74mi | 3/2.0 | 1,492 (-12%) | 11mo | $179,000 | $120 | 33 |
| 1838 E Crockett | 0.70mi | 2/2.0 (-1) | 1,445 (-14%) | 8mo | $289,000 | $200 | 28 |
Match score weights: distance 35% · size 25% · config 20% · recency 20%. Top-matched comps best support the ARV.
Projected returns pro-forma
10.0% appreciation · 8.0% rent growth · sell at horizon
- IRR
- 25.4%
- Equity multiple
- 3.07×
- Total profit
- $101,204
- Equity at exit
- $157,564
- IRR
- 23.9%
- Equity multiple
- 7.61×
- Total profit
- $323,804
- Equity at exit
- $339,792
Cash invested: $48,972 (down + closing). Projections, not guarantees.
Landlord ↔ Tenant lean methodology
- Overall (STATE)
- 87 Strongly Landlord-Friendly
- State Texas
- 87 Strongly Landlord-Friendly · R+5
- County
- — inherits STATE
- City
- — inherits STATE
ZIP-level market 78202
- Home prices YoY
- 27.0%
- Rents YoY
- 8.2%
- Active inventory
- 201
- Price-to-rent
- 8.4×
Monthly cashflow live
- Estimated rent
- $1,740 high interval (Pro) →
- Mortgage (P&I)
- −$917
- Tax from tax record
- −$438 /mo · $5,253/yr
- Insurance
- −$73
- HOA
- −$0
- Vacancy / Maint / Mgmt
- −$365
- Net cashflow
- $-53
Break-even live
Sensitivity live
| Price | -10% $46 | -5% $-4 | +0% $-53 | +5% $-103 | +10% $-152 |
|---|---|---|---|---|---|
| Rent | -10% $-191 | -5% $-122 | +0% $-53 | +5% $15 | +10% $84 |
| Rate | -1.0pp $35 | -0.5pp $-9 | base $-53 | +0.5pp $-99 | +1.0pp $-145 |
UW: 25.0% down · 7.5% · 30yr · 1.5% tax · 5.0% vac · 8.0% maint · 8.0% mgmt
Financing live
Cash to close
- Down payment
- $43,725
- Closing costs
- $5,247
- Reserves months
- —
- Total cash needed
- —
Loan-product check · same deal, 3 products live
Conventional
25% down · 7.5% · 30yr
- Down + closing
- —
- Monthly P&I
- —
- Monthly cashflow
- —
- DSCR
- —
- Eligible?
- —
Personal DTI + credit; lowest rate.
DSCR
20% down · 8.5% · 30yr
- Down + closing
- —
- Monthly P&I
- —
- Monthly cashflow
- —
- DSCR
- —
- Eligible?
- —
No personal income docs; deal must DSCR.
Hard money
10% down · 12.0% · 12mo
- Down + closing
- —
- Monthly P&I
- —
- Monthly cashflow
- —
- DSCR
- —
- Eligible?
- —
Short-term bridge; refi at stabilization.
Rent comps 40 comps
| Address | Beds | Baths | Sqft | Rent | $/sqft | DOM | Units | Dist |
|---|---|---|---|---|---|---|---|---|
| 2239 Burnet St San Antonio, TX | 3.0 | 2.0 | 1097 | $1,450 | $1.32 | 45d | 1 | 0.15mi |
| 518 Rotary San Antonio, TX | 3.0 | 1.0 | 1080 | $1,225 | $1.13 | 16d | 1 | 0.22mi |
| 1622 Gorman San Antonio, TX | 3.0 | 2.0 | 1189 | $1,325 | $1.11 | 19d | 1 | 0.28mi |
| 1622 Gorman San Antonio, TX | 3.0 | 2.0 | 1189 | $1,325 | $1.11 | 0d | 1 | 0.28mi |
| 906 Gulf St Unit 102 San Antonio, TX | 3.0 | 2.0 | 1300 | $1,750 | $1.35 | 6d | 1 | 0.30mi |
| 2818 E Houston St San Antonio, TX | 3.0 | 1.0 | 1184 | $1,495 | $1.26 | 16d | 1 | 0.35mi |
| 2006 Hays St San Antonio, TX | 3.0 | 2.0 | 1176 | $1,750 | $1.49 | 21d | 1 | 0.36mi |
| 215 Coca-Cola Pl Unit 313 San Antonio, TX | 3.0 | 2.5 | 2119 | $3,490 | $1.65 | 45d | 1 | 0.56mi |
| 607 Gulf San Antonio, TX | 3.0 | 2.0 | 1482 | $1,395 | $0.94 | 25d | 1 | 0.57mi |
| 215 Coca-Cola Pl Unit 305 San Antonio, TX | 3.0 | 2.5 | 2032 | $2,990 | $1.47 | 25d | 1 | 0.60mi |
| 215 Coca-Cola Pl Unit 304 San Antonio, TX | 2.0 | 2.5 | 2094 | $2,990 | $1.43 | 21d | 1 | 0.60mi |
| 1104 N Gevers St San Antonio, TX | 3.0 | 2.5 | 1276 | $1,725 | $1.35 | 45d | 1 | 0.62mi |
| 323 Gabriel San Antonio, TX | 3.0 | 2.0 | 1400 | $1,950 | $1.39 | 23d | 1 | 0.70mi |
| 323 Gabriel Unit 1 101 San Antonio, TX | 3.0 | 2.5 | 1400 | $1,950 | $1.39 | 25d | 1 | 0.70mi |
| 610 Belmont San Antonio, TX | 2.0 | 1.0 | 1050 | $1,195 | $1.14 | 45d | 1 | 0.71mi |
| 452 Gulf San Antonio, TX | 3.0 | 1.0 | 1244 | $1,899 | $1.53 | 23d | 1 | 0.72mi |
| 418 Lockhart San Antonio, TX | 4.0 | 2.0 | 1479 | $1,799 | $1.22 | 23d | 1 | 0.73mi |
| 418 Lockhart St Unit 1 San Antonio, TX | 4.0 | 2.0 | 1479 | $1,590 | $1.08 | 45d | 1 | 0.73mi |
| 1300 Norfleet St San Antonio, TX | 2.0 | 1.0 | 1632 | $1,100 | $0.67 | 25d | 1 | 0.73mi |
| 1707 Dawson St Unit 1101 San Antonio, TX | 2.0 | 1.5 | 1884 | $1,000 | $0.53 | 45d | 1 | 0.74mi |
| 817 Potomac San Antonio, TX | 3.0 | 2.5 | 1508 | $1,795 | $1.19 | 25d | 1 | 0.77mi |
| 1414 Burleson San Antonio, TX | 4.0 | 2.0 | 1769 | $2,000 | $1.13 | 45d | 1 | 0.78mi |
| 2332 E Houston St San Antonio, TX | 3.0 | 2.0 | 1652 | $1,550 | $0.94 | 25d | 1 | 0.79mi |
| 1326 Ervin St San Antonio, TX | 3.0 | 2.0 | 1400 | $1,750 | $1.25 | 5d | 1 | 0.80mi |
| 1827 Montana St #101 San Antonio, TX | 3.0 | 2.5 | 1859 | $2,250 | $1.21 | 3d | 1 | 0.83mi |
| 122 S Walters St San Antonio, TX | 3.0 | 3.0 | 2000 | $2,200 | $1.10 | 45d | 1 | 0.84mi |
| 1727 E Crockett St San Antonio, TX | 3.0 | 3.0 | 1819 | $1,725 | $0.95 | 21d | 1 | 0.85mi |
| 1723 E Crockett St San Antonio, TX | 3.0 | 3.0 | 1819 | $1,800 | $0.99 | 25d | 1 | 0.85mi |
| 3363 E Commerce St #147 San Antonio, TX | 2.0 | 1.5 | 1990 | $2,825 | $1.42 | 45d | 1 | 0.87mi |
| 1412 Hays St San Antonio, TX | 3.0 | 1.0 | 1250 | $1,495 | $1.20 | 25d | 1 | 0.88mi |
| 1615 Nolan St Unit A San Antonio, TX | 2.0 | 1.0 | 1066 | $1,400 | $1.31 | 12d | 1 | 0.89mi |
| 227 S Grimes St Unit 202 San Antonio, TX | 3.0 | 2.5 | 1089 | $1,550 | $1.42 | 45d | 1 | 0.90mi |
| 1111 Gibbs San Antonio, TX | 3.0 | 2.0 | 1476 | $1,595 | $1.08 | 25d | 1 | 0.94mi |
| 1101 Gibbs San Antonio, TX | 3.0 | 1.0 | 1100 | $1,345 | $1.22 | 25d | 1 | 0.96mi |
| 1101 Gibbs San Antonio, TX | 3.0 | 1.0 | 1100 | $1,345 | $1.22 | 16d | 1 | 0.96mi |
| 314 Maryland St Unit 102 San Antonio, TX | 2.0 | 2.5 | 1055 | $1,295 | $1.23 | 45d | 1 | 0.99mi |
| 406 Como St San Antonio, TX | 3.0 | 1.5 | 1278 | $1,350 | $1.06 | 45d | 1 | 1.00mi |
| 2346 Dakota St Unit 1101 San Antonio, TX | 2.0 | 1.0 | 1728 | $1,250 | $0.72 | 18d | 1 | 1.02mi |
| 1223 Hays St San Antonio, TX | 3.0 | 2.5 | 1810 | $2,495 | $1.38 | 25d | 1 | 1.03mi |
| 1102 Burleson San Antonio, TX | 3.0 | 2.0 | 1400 | $2,500 | $1.79 | 25d | 1 | 1.11mi |
Listing history 33 events
-
2026-06-21days on market $174,900 Active 120 DOM
-
2026-06-18days on market $174,900 Active 117 DOM
-
2026-06-17days on market $174,900 Active 116 DOM
-
2026-06-16days on market $174,900 Active 115 DOM
-
2026-06-15days on market $174,900 Active 114 DOM
-
2026-06-13statusdays on market $174,900 Active 112 DOM
-
2026-06-09days on market $174,900 Price Change 108 DOM
-
2026-06-08days on market $174,900 Price Change 107 DOM
-
2026-06-07days on market $174,900 Price Change 106 DOM
-
2026-06-04days on market $174,900 Price Change 103 DOM
-
2026-06-03days on market $174,900 Price Change 102 DOM
-
2026-06-02days on market $174,900 Price Change 101 DOM
-
2026-06-02pricestatus $174,900 Price Change 100 DOM
-
2026-06-01days on market $179,900 Back on Market 100 DOM
-
2026-05-31days on market $179,900 Back on Market 99 DOM
-
2026-04-12price $189,900 347-char remark
Show marketing remark (347 chars)
Great Location - 5 minutes from Downtown! Nearby shopping & restaurants. This 4-bedroom, 2-bathroom, 2-living room home features hardwood flooring throughout, fresh paint, new cabinets, granite countertops, and backsplash. Easy access to the highway, shopping, and restaurants. This home is ready for its new owner. Please place bids via Xome.
-
2026-03-18price $199,900 347-char remark
Show marketing remark (347 chars)
Great Location - 5 minutes from Downtown! Nearby shopping & restaurants. This 4-bedroom, 2-bathroom, 2-living room home features hardwood flooring throughout, fresh paint, new cabinets, granite countertops, and backsplash. Easy access to the highway, shopping, and restaurants. This home is ready for its new owner. Please place bids via Xome.
-
2026-02-18$209,900 New 347-char remark
Show marketing remark (347 chars)
Great Location - 5 minutes from Downtown! Nearby shopping & restaurants. This 4-bedroom, 2-bathroom, 2-living room home features hardwood flooring throughout, fresh paint, new cabinets, granite countertops, and backsplash. Easy access to the highway, shopping, and restaurants. This home is ready for its new owner. Please place bids via Xome.
-
2026-01-13historical
-
2026-01-02$199,000 New
-
2024-12-27historical
-
2024-09-05price $215,000
-
2024-08-14$225,000 New
-
2019-08-27soldstatus
-
2019-08-26soldstatus Sold
-
2019-07-12status Pending
-
2019-07-04historical Active Option
-
2019-06-27$120,000 New
-
2018-12-09historical
-
2018-12-04price $115,000
-
2018-11-16$125,000 New
-
2006-01-04soldstatus
-
2004-06-01soldstatus
ⓘ Source: listings_history table (triggers on properties + properties_extension) + one-shot
backfill from property_details.listing_events for pre-trigger history.
Tax reassessment forecast TX · Resets to sale price
- Current annual tax
- $5,253 · $438/mo
- Projected year-2 tax
- $5,253 · $438/mo
- Expected delta
- $0/yr ($0/mo · 0.0%)
ⓘ Screening estimate from a state-policy table — verify with the county assessor before closing.
Climate risk First Street
- Flood 1/10 Low FEMA zone X (unshaded) · 0% chance over 30 yrs
- Wildfire 1/10 Low
- Heat 8/10 Severe 7 d/yr ≥108°F today · 20 d/yr by 30 yrs out
- Wind 8/10 Severe 80% chance of damaging wind over 30 yrs
- Air quality 2/10 Low 0 unhealthy d/yr today · 2 by 30 yrs out
Nearby sold comps map
Loading sold comps map…
Walkable amenities ~0.75 mi
Loading nearby amenities…
Taxation est. · year 1
- Rental income
- $20,876
- − Mortgage interest
- −$9,797
- − Property taxes
- −$5,253
- − Insurance
- −$874
- − Repairs & maintenance
- −$1,670
- − Management
- −$1,670
- − Depreciation
- −$5,088
- Taxable loss
- −$3,477
- Est. tax savings @ 24.0%
- +$834
- After-tax cash flow
- $193/yr
For passive investors: Depreciation is non-cash, so a rental often shows a tax loss while cash-flowing — sheltering income. Rental losses are passive: they offset passive income freely, and up to $25,000/yr can offset ordinary (W-2) income if you actively participate and your MAGI is under $100k (phasing out to $0 by $150k); unused losses carry forward. On sale, claimed depreciation is recaptured at up to 25%, and gains may owe capital-gains tax (a 1031 exchange can defer both). Figures are a year-1 estimate at your 24.0% rate — not tax advice; consult a CPA.
Schools (NCES district)
- District
- San Antonio ISD
- NCES district ID
- 4838730
- Math proficiency
- 12% ▼ -21.00%
- Reading proficiency
- 22% ▼ -7.00%
- Median HH income
- $30,952
- Composite
- 13.57/100
- National rank
- #9512
- State rank
- #805 of 826 in TX
Livability — San Antonio
- Score
- 80/100
- State rank
- #31
- US rank
- #1616
Category grades
Schools grade is shown separately in the Schools card above.
Census & demographics
- Census place
- San Antonio, TX
- County
- Bexar County · 1,990,555 people
- City population
- 1,806,925
- Metro
- San Antonio-New Braunfels, TX
- Population (ZIP)
- 10,224
- Household income
- $47,478
- Rent vs Own
- Severe rent burden
- 543.0
Population outlook (Bexar County) Hauer SSP2
- Today (2025)
- 2,336,851 people
- By 2030
- 2,560,728 · +9.6%
- By 2040
- 3,020,569 · +29.3%
- By 2050
- 3,493,522 · +49.5%
- By 2075
- 4,668,459 · +99.8%
- By 2100
- 5,533,242 · +136.8%
Race, ethnicity, and origin ACS 2023
- Neighborhood character
- Predominantly Hispanic (66%)
- Race & ethnicity
- Hispanic / Latino 66% Two or more races 28% White 17% Black 16% Native American 1%
- Hispanic origin (detail)
- Mexican 57% Puerto Rican 1% Cuban 1%
- Common ancestry
- Italian 2% Slovak 1%
- Foreign-born
- 14% · Canada
- Languages at home
- 59% English-only · Spanish 41%
Political lean MEDSL · Bexar
- 2024 margin
- Lean D (+9.8) · D 54.3% · R 44.6% · Other 1.1%
- 2008→2024 swing
- +4.2pp toward D · 2008: 5.6pp · 2024: 9.8pp
- All cycles
- 2024: D+9.8 2020: D+18.2 2016: D+13.5 2012: D+4.6 2008: D+5.6
Not yet ingested
- Civics
- —
Market trends
- HPI YoY
- ▲ 53.82%
- Current HPI
- 253.3196
- Rent YoY
- ▲ 8.20%
- Metro
- San Antonio-New Braunfels, TX
- State GDP YoY
- ▲ 3.95%
- F500 in state
- 110
Industry mix (Fortune 500 HQ in TX)
| Industry | F500 HQs | Revenue |
|---|---|---|
| Energy | 16 | $1,198B |
|
||
| Technology | 5 | $198B |
|
||
| Engineering / Construction | 4 | $72B |
|
||
| Energy Services | 3 | $60B |
|
||
| Utilities | 3 | $41B |
|
||
| Healthcare | 2 | $330B |
|
||
Price history
+51.9% since first listed18 events — show timeline
- 2026-04-12 Price Changed $189,900 LERA
- 2026-03-18 Price Changed $199,900 LERA
- 2026-02-18 Listed $209,900 LERA
- 2026-01-13 Listing Removed — LERA
- 2026-01-02 Listed $199,000 LERA
- 2024-12-27 Listing Removed — LERA
- 2024-09-05 Price Changed $215,000 LERA
- 2024-08-14 Listed $225,000 LERA
- 2019-08-27 Sold (Public Records) — Public Records
- 2019-08-26 Sold (MLS) — LERA
- 2019-07-12 Pending — LERA
- 2019-07-04 Contingent — LERA
- 2019-06-27 Listed $120,000 LERA
- 2018-12-09 Listing Removed — LERA
- 2018-12-04 Price Changed $115,000 LERA
- 2018-11-16 Listed $125,000 LERA
- 2006-01-04 Sold (Public Records) — Public Records
- 2004-06-01 Sold (Public Records) — Public Records
Property tax history
+8.9%/yrLatest (2025): $5,253 · -3.6% YoY. Source: county tax records.
Cash-flow waterfall
monthlySold comps — $/sqft
last 12 mo · ≤1 miLoading sold comps…