 🏗️ New Construction
551 Remick St · Deltona, FL
Flood risk 1/10 · Minimal
- FEMA flood zone
- X (unshaded)
- Chance of flooding over 30 yrs
- 0.0%
- Est. flood insurance / yr
- $507 – $1,088
Fire risk 6/10 · Moderate
- Est. fire insurance / yr
- $947 – $1,759
Heat risk 9/10 · Severe
- Hot days now (above 107°F)
- 7 days/yr
- Hot days in 30 yrs
- 21 days/yr
Wind risk 9/10 · Severe
- Chance of severe wind over 30 yrs
- 99.0%
Air-quality risk 2/10 · Minimal
- Unhealthy air days now
- 1 days/yr
- Unhealthy air days in 30 yrs
- 1 days/yr
Risk factors via First Street. Map © Google.
Why this score? — see what drove the D grade
The composite is a weighted blend of 9 inputs, each scored 0–100. Each bar is that input's sub-score; the figure is the points it added to the 100-point composite (weight × sub-score).
- Appreciation +10.0/10.0
- ARV discount +7.5/15.0
- Cash flow +7.1/30.0
- Schools +3.9/10.0
- Livability +3.6/5.0
- 1% rule +2.5/10.0
- Rent growth +2.5/5.0
- Condition / age +2.5/5.0
- DSCR +1.3/10.0
$304,990
🖨 Deal sheet 📄 Offer letter ✓ Due diligence
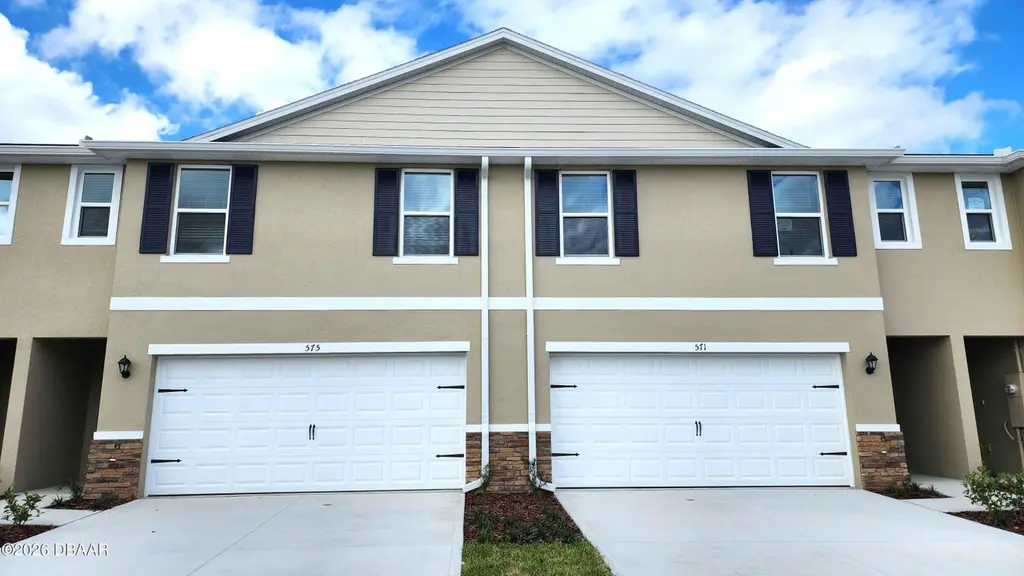
Listing remarks
This community offers townhomes with 4 bedrooms, 2.5 baths and 2 car garage, all built with concrete block construction on both the first and second floor. Each design includes spacious living areas, modern kitchen layouts with oversized islands, quartz counters, stainless steel appliances, RevWood Select flooring throughout, private covered lanais and primary suites with walk in closets. The community offers a variety of homesites, perfect for enjoying from your rear outdoor patio. * Photos are of similar model but not that of exact house. Pictures, photographs, colors, features, and sizes are for illustration purposes only and will vary from the homes as built. Home and community informat
Key facts
- Quartz counters
- Oversized islands
- $145 HOA
Tags
Neighborhood map
What this means for you Summary
Snapshot
- This is a 4-bed/2.5-bath townhouse listed at $305k.
Deal economics
- At list price, monthly cash flow is $-437 ($-5k/yr) — negative.
- To cash-flow at today's rent, offer at most $242k (20.7% below list).
- To meet the 1% rule (rent ≥ 1% of price), the offer needs to be $230k (24.6% below list).
- Recommended offer: $230k (24.6% below list) — sets the bar for 1% rule.
Location & tenants
- Location reads 71/100 on livability (#381 in FL) — a middle-class / working-renter tenant base. Strengths: cost of living A+, housing A+, health & safety A+; Watch: schools D+, amenities F, commute F.
- Volusia (suburban): math 44% / reading 49% proficiency, ranked #47 of 73 in FL (top 64%) — families likely to look elsewhere, expect single-tenant / working-renter base with shorter leases.
- Market conditions: 85 active listings in the ZIP; 1 comparable units currently listed for rent nearby; 3,402 units permitted in Volusia County in 2024 (681 in 5+ unit buildings).
Forward outlook
- In year one you build about $33k of equity ($2k loan paydown + $30k appreciation (10.0% local appreciation)).
- Volusia County population projected at +19% by 2050 — long-run rental-demand tailwind backs the buy-and-hold thesis.
- By year 2, paydown + projected appreciation supports a ~$52k cash-out refi (75% LTV) — recoverable capital for the next deal without selling this one.
Negotiation context
- It's been on market 22 days — a 2% lower offer ($300k) is reasonable based on typical stale-listing flexibility.
Risks & watch-outs
- Climate carrying-cost: severe wind risk, 99% chance of damaging wind over 30y; major wildfire risk; extreme-heat days projected 7→21/yr by 2055 (HVAC capex compounding) — expect insurance premiums to compound above CPI over the hold.
Questions for the listing agent
- What do current leases actually rent for vs. the listed asking? Can we see a recent rent roll and the last 12 months of T-12 income?
- What does the HOA fee cover, when was the last increase, and are there any pending special assessments or reserve-fund shortfalls?
- Is there a deadline driving the sale (1031 exchange, divorce, estate, relocation)? That informs how much negotiation room exists.
- Schools are D-rated, which usually means shorter tenancies and higher turnover. Who's the typical renter profile here, and what's been the actual vacancy rate?
- The area grade is low — what's the realistic commute time and amenity access for the typical tenant pool here? Any planned neighborhood developments (good or bad) we should know about?
- What's the average days-on-market for RENTAL listings here right now (not sales)? A rising rental-DOM trend means longer vacancies and softer asking-rent achievability than the comps imply.
- What's the recent tenant-quality profile in this submarket — average credit score on applications, eviction rate, late-payment / NSF rate, and stable-employment percentage? A property-management company in the area should have these aggregated.
- How much new for-sale + rental construction is in the pipeline within 1–3 miles? Heavy new supply typically softens prices + rents 12–24 months out; constrained supply supports both.
Investment metrics
- 1% rule
- 0.75% ✗
- Cap rate
- 4.58%
- Cash-on-cash
- -6.13%
- DSCR
- 0.73
- GRM
- 11.1
CMA / ARV
No comps found within radius.
Projected returns pro-forma
10.0% appreciation · 3.0% rent growth · sell at horizon
- IRR
- 20.0%
- Equity multiple
- 2.62×
- Total profit
- $138,428
- Equity at exit
- $274,759
- IRR
- 18.3%
- Equity multiple
- 6.03×
- Total profit
- $429,757
- Equity at exit
- $592,528
Cash invested: $85,397 (down + closing). Projections, not guarantees.
Landlord ↔ Tenant lean methodology
- Overall (STATE)
- 87 Strongly Landlord-Friendly
- State Florida
- 87 Strongly Landlord-Friendly · R+3
- County
- — inherits STATE
- City
- — inherits STATE
ZIP-level market 32764
- Home prices YoY
- 11.7%
- Active inventory
- 85
- Price-to-rent
- 11.1×
Monthly cashflow live
- Estimated rent
- $2,299 medium interval (Pro) →
- Mortgage (P&I)
- −$1,599
- Tax est. 1.5%
- −$381 /mo · $4,575/yr
- Insurance
- −$127
- HOA
- −$145
- Vacancy / Maint / Mgmt
- −$483
- Net cashflow
- $-437
Break-even live
UW: 25.0% down · 7.5% · 30yr · 1.5% tax · 5.0% vac · 8.0% maint · 8.0% mgmt
Financing live
Cash to close
- Down payment
- $76,248
- Closing costs
- $9,150
- Reserves months
- —
- Total cash needed
- —
Loan-product check · same deal, 3 products live
Conventional
25% down · 7.5% · 30yr
- Down + closing
- —
- Monthly P&I
- —
- Monthly cashflow
- —
- DSCR
- —
- Eligible?
- —
Personal DTI + credit; lowest rate.
DSCR
20% down · 8.5% · 30yr
- Down + closing
- —
- Monthly P&I
- —
- Monthly cashflow
- —
- DSCR
- —
- Eligible?
- —
No personal income docs; deal must DSCR.
Hard money
10% down · 12.0% · 12mo
- Down + closing
- —
- Monthly P&I
- —
- Monthly cashflow
- —
- DSCR
- —
- Eligible?
- —
Short-term bridge; refi at stabilization.
Rent comps 1 comps
| Address | Beds | Baths | Sqft | Rent | $/sqft | DOM | Units | Dist |
|---|---|---|---|---|---|---|---|---|
| 3031 Staten Dr Deltona, FL | 3.0 | 2.0 | 1706 | $2,299 | $1.35 | 5d | 1 | 0.90mi |
HOA detail
- Monthly dues
- $145 · $1,740/yr
Listing history 2 events
-
2026-04-21status Pending
-
2026-03-30$304,990 Active
ⓘ Source: listings_history table (triggers on properties + properties_extension) + one-shot
backfill from property_details.listing_events for pre-trigger history.
Climate risk First Street
- Flood 1/10 Low FEMA zone X (unshaded) · 0% chance over 30 yrs
- Wildfire 6/10 Major
- Heat 9/10 Extreme 7 d/yr ≥107°F today · 21 d/yr by 30 yrs out
- Wind 9/10 Extreme 99% chance of damaging wind over 30 yrs
- Air quality 2/10 Low 1 unhealthy d/yr today · 1 by 30 yrs out
Nearby sold comps map
Loading sold comps map…
Walkable amenities ~0.75 mi
Loading nearby amenities…
Taxation est. · year 1
- Rental income
- $27,588
- − Mortgage interest
- −$17,084
- − Property taxes
- −$4,575
- − Insurance
- −$1,525
- − Repairs & maintenance
- −$2,207
- − Management
- −$2,207
- − HOA
- −$1,740
- − Depreciation
- −$8,872
- Taxable loss
- −$10,622
- Est. tax savings @ 24.0%
- +$2,549
- After-tax cash flow
- $-2,689/yr
For passive investors: Depreciation is non-cash, so a rental often shows a tax loss while cash-flowing — sheltering income. Rental losses are passive: they offset passive income freely, and up to $25,000/yr can offset ordinary (W-2) income if you actively participate and your MAGI is under $100k (phasing out to $0 by $150k); unused losses carry forward. On sale, claimed depreciation is recaptured at up to 25%, and gains may owe capital-gains tax (a 1031 exchange can defer both). Figures are a year-1 estimate at your 24.0% rate — not tax advice; consult a CPA.
Schools (NCES district)
- District
- Volusia
- NCES district ID
- 1201920
- Math proficiency
- 44% ▼ -9.00%
- Reading proficiency
- 49% ▼ -3.00%
- Median HH income
- $42,946
- Composite
- 39.2/100
- National rank
- #4019
- State rank
- #47 of 73 in FL
Livability — Deltona
- Score
- 71/100
- State rank
- #381
- US rank
- #6749
Category grades
Schools grade is shown separately in the Schools card above.
Census & demographics
- Census place
- Deltona, FL
- City population
- 101,355
- Population (ZIP)
- 2,744
Population outlook (Volusia County) Hauer SSP2
- Today (2025)
- 572,749 people
- By 2030
- 598,695 · +4.5%
- By 2040
- 644,880 · +12.6%
- By 2050
- 681,451 · +19.0%
- By 2075
- 759,957 · +32.7%
- By 2100
- 778,902 · +36.0%
Race, ethnicity, and origin ACS 2023
- Neighborhood character
- Predominantly White (87%)
- Race & ethnicity
- White 87% Hispanic / Latino 7% Two or more races 6% Black 2%
- Hispanic origin (detail)
- Puerto Rican 2% Cuban 3%
- Common ancestry
- Slovak 5% Lithuanian 3% Italian 3%
- Foreign-born
- 5% · Canada, Jamaica
- Languages at home
- 94% English-only · Spanish 4% French/Haitian/Cajun 1%
Political lean MEDSL · Volusia
- 2024 margin
- Strong R (+21.8) · D 38.7% · R 60.5%
- 2008→2024 swing
- -27.4pp toward R · 2008: 5.7pp · 2024: -21.8pp
- All cycles
- 2024: R+21.8 2020: R+14.1 2016: R+13.1 2012: R+1.2 2008: D+5.7
Not yet ingested
- Civics
- —
Market trends
- HPI YoY
- ▲ 55.42%
- Current HPI
- 531.22
- Rent YoY
- —
- Metro
- —
- State GDP YoY
- ▲ 3.28%
- F500 in state
- 36
Industry mix (Fortune 500 HQ in FL)
| Industry | F500 HQs | Revenue |
|---|---|---|
| Industrial Technology | 2 | $29B |
|
||
| Insurance | 2 | $17B |
|
||
| Retail | 1 | $60B |
|
||
| Technology Distribution | 1 | $58B |
|
||
| Homebuilding | 1 | $35B |
|
||
| Technology Manufacturing | 1 | $35B |
|
||
Price history
2 events — show timeline
- 2026-04-21 Pending — Daytona MLS
- 2026-03-30 Listed $304,990 Daytona MLS
Cash-flow waterfall
monthlySold comps — $/sqft
last 12 mo · ≤1 miLoading sold comps…