10211 Cedar Lake Rd #109 · Minnetonka, MN
Flood risk 7/10 · Major
- FEMA flood zone
- X (unshaded)
- Chance of flooding over 30 yrs
- 0.78%
- Est. flood insurance / yr
- $507 – $1,088
Fire risk 1/10 · Minimal
- Est. fire insurance / yr
- $888 – $1,650
Heat risk 2/10 · Minimal
- Hot days now (above 98°F)
- 7 days/yr
- Hot days in 30 yrs
- 14 days/yr
Wind risk 2/10 · Minimal
- Chance of severe wind over 30 yrs
- —
Air-quality risk 2/10 · Minimal
- Unhealthy air days now
- 2 days/yr
- Unhealthy air days in 30 yrs
- 2 days/yr
Risk factors via First Street. Map © Google.
Why this score? — see what drove the D+ grade
The composite is a weighted blend of 9 inputs, each scored 0–100. Each bar is that input's sub-score; the figure is the points it added to the 100-point composite (weight × sub-score).
- Cash flow +12.6/30.0
- 1% rule +9.9/10.0
- ARV discount +7.5/15.0
- Schools +4.6/10.0
- Livability +3.8/5.0
- DSCR +3.7/10.0
- Rent growth +3.3/5.0
- Condition / age +2.5/5.0
- Appreciation +0.0/10.0
$98,000
🖨 Deal sheet (PDF) 📄 Offer letter ✓ Due diligence
Listing remarks MLS
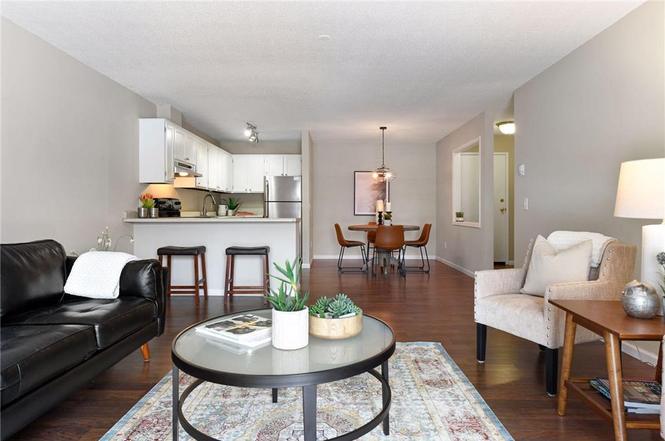
Welcome to Cedar Ridge and this spacious and sun-filled condo. As you enter you will notice that this unit has been remodeled creating the open floorplan you desire. The rooms are spacious in size and you will appreciate the amount of storage. If you are working from home, there are numerous spaces to set up your home office. Enjoy the amenities of this complex which include include tree covered walking paths, heated indoor pool, hot tub, sauna, party room, grilling area and large deck. Call today to set up your appointment to see this beautiful condo.
Key facts
- $480 HOA
- Garage
- Community pool
Neighborhood map
What this means for you Summary
Snapshot
- This is a 1-bed/1.0-bath condo listed at $98k.
Deal economics
- At list price, monthly cash flow is $-80 ($-955/yr) — negative.
- To cash-flow at today's rent, offer at most $84k (14.3% below list).
- Meets the 1% rule at list price ($1k rent vs $98k).
- Recommended offer: $84k (14.3% below list) — sets the bar for cash-flow.
- Cap rate 6.1% vs local median 2.4% in Minnetonka — top-decile yield for the area; either an underpriced asset or a hidden risk that comps aren't pricing in. Stress-test before assuming the spread holds.
Location & tenants
- Location reads 75/100 on livability (#187 in MN, #3,994 nationally) — a middle-class / working-renter tenant base. Strengths: employment A+, housing A+, crime A-; Watch: amenities F, cost of living F, health & safety F.
- Hopkins Public School District (suburban): math 48% / reading 57% proficiency, ranked #75 of 301 in MN (top 25%) — acceptable for families but not a draw, mixed tenant base, ~2y average lease.
- Zoned schools: L.H. Tanglen Elementary (math 42% / reading 56%, grade D, #475 of 857 statewide, top 56%, 559 students, 50% FRL); Hopkins North Junior High (math 42% / reading 61%, grade C, #65 of 258 statewide, top 26%, 888 students, 40% FRL); Hopkins Senior High (math 52% / reading 63%, grade C, #59 of 471 statewide, top 13%, 1,491 students, 40% FRL).
- Market conditions: Rents rising (+3.3%/yr); 123 active listings in the ZIP; 37 comparable units currently listed for rent nearby; rentals leasing fast (median 7d on market — plan ~1-2 weeks tenant-placement turnaround); solid renter incomes; 4,651 units permitted in Hennepin County in 2024 (2,443 in 5+ unit buildings).
- This rent is only 17% of the median local income ($105k/yr) — well below the 30% rent-burden line; pricing power to push rent on renewal without tenant pushback.
Forward outlook
- Local home prices are declining (-3.0%/yr); year-one equity from $678 of loan paydown is wiped out by about $3k of value loss. Plan a longer hold.
- Hennepin County population projected at +30% by 2050 — long-run rental-demand tailwind backs the buy-and-hold thesis.
Negotiation context
- It's been on market 344 days — a 12% lower offer ($86k) is reasonable based on typical stale-listing flexibility.
- 4 sale attempts since 32y ago; this cycle's ask has dropped $26k (21%) from the opening price — seller is motivated, your offer sets the floor, not the list.
Risks & watch-outs
- Watch-outs: flood insurance adds $66/mo; HOA is 33% of rent.
- Climate carrying-cost: major flood risk — expect insurance premiums to compound above CPI over the hold.
Questions for the listing agent
- What do current leases actually rent for vs. the listed asking? Can we see a recent rent roll and the last 12 months of T-12 income?
- It's been on market 344 days. Have you received any prior offers? Is the seller open to a 14% concession, seller financing, or rate buy-down credit?
- Built in 1969 — when were the roof, HVAC, electrical panel, plumbing, and water heater last replaced?
- What's the actual annual flood-insurance premium (NFIP or private), and is the property in a SFHA with mandatory coverage?
- What does the HOA fee cover, when was the last increase, and are there any pending special assessments or reserve-fund shortfalls?
- Any open or pending special assessments — roof, HVAC, plumbing, elevator, façade? What's the per-unit balance and payoff schedule, and is the seller paying it off at close or rolling it to the buyer?
- Why hasn't it sold? Are there any deal-killer items the seller is aware of (foundation, flood, title, zoning, code violations)?
- Is there a deadline driving the sale (1031 exchange, divorce, estate, relocation)? That informs how much negotiation room exists.
- Schools are A-rated — typically a magnet for longer-tenancy family renters. What's the average tenant stay here, and is there a school-zone premium baked into asking?
- The area grade is low — what's the realistic commute time and amenity access for the typical tenant pool here? Any planned neighborhood developments (good or bad) we should know about?
- What's the average days-on-market for RENTAL listings here right now (not sales)? A rising rental-DOM trend means longer vacancies and softer asking-rent achievability than the comps imply.
- What's the recent tenant-quality profile in this submarket — average credit score on applications, eviction rate, late-payment / NSF rate, and stable-employment percentage? A property-management company in the area should have these aggregated.
- How much new apartment / multifamily construction is in the pipeline within 1–3 miles? Heavy new supply (>2% of stock underway) typically softens rents 12–24 months out; light construction supports rent growth.
Investment metrics
- 1% rule
- 1.49% ✓
- Cap rate
- 6.13%
- Cash-on-cash
- -0.57%
- DSCR
- 0.97
- GRM
- 5.6
CMA / ARV
No comps found within radius.
Projected returns pro-forma
-3.0% appreciation · 3.28% rent growth · sell at horizon
- IRR
- -21.0%
- Equity multiple
- 0.26×
- Total profit
- $-20,174
- Equity at exit
- $14,612
- IRR
- -12.4%
- Equity multiple
- 0.24×
- Total profit
- $-20,922
- Equity at exit
- $8,473
Cash invested: $27,440 (down + closing). Projections, not guarantees.
Landlord ↔ Tenant lean methodology
- Overall (STATE)
- 46 Balanced
- State Minnesota
- 46 Balanced · D+2
- County
- — inherits STATE
- City
- — inherits STATE
ZIP-level market 55305
- Rents YoY
- 3.3%
- Active inventory
- 123
- Price-to-rent
- 5.6×
Monthly cashflow live
- Estimated rent
- $1,457 high interval (Pro) →
- Mortgage (P&I)
- −$514
- Tax from tax record
- −$130 /mo · $1,556/yr
- Insurance
- −$41
- Flood insurance flood zone
- −$66 /mo · $798/yr
- HOA
- −$480
- Vacancy / Maint / Mgmt
- −$306
- Net cashflow
- $-80
Break-even live
Sensitivity live
| Price | -10% $-24 | -5% $-52 | +0% $-80 | +5% $-107 | +10% $-135 |
|---|---|---|---|---|---|
| Rent | -10% $-195 | -5% $-137 | +0% $-80 | +5% $-22 | +10% $36 |
| Rate | -1.0pp $-30 | -0.5pp $-55 | base $-80 | +0.5pp $-105 | +1.0pp $-131 |
UW: 25.0% down · 7.5% · 30yr · 1.5% tax · 5.0% vac · 8.0% maint · 8.0% mgmt
Financing live
Cash to close
- Down payment
- $24,500
- Closing costs
- $2,940
- Reserves months
- —
- Total cash needed
- —
Loan-product check · same deal, 3 products live
Conventional
25% down · 7.5% · 30yr
- Down + closing
- —
- Monthly P&I
- —
- Monthly cashflow
- —
- DSCR
- —
- Eligible?
- —
Personal DTI + credit; lowest rate.
DSCR
20% down · 8.5% · 30yr
- Down + closing
- —
- Monthly P&I
- —
- Monthly cashflow
- —
- DSCR
- —
- Eligible?
- —
No personal income docs; deal must DSCR.
Hard money
10% down · 12.0% · 12mo
- Down + closing
- —
- Monthly P&I
- —
- Monthly cashflow
- —
- DSCR
- —
- Eligible?
- —
Short-term bridge; refi at stabilization.
Rent comps 37 comps
| Address | Beds | Baths | Sqft | Rent | $/sqft | DOM | Units | Dist |
|---|---|---|---|---|---|---|---|---|
| 10201 Cedar Lake Rd S Unit 201-101 Minnetonka, MN | 2.0 | 1.5 | 1038 | $1,499 | $1.44 | 19d | 1 | 0.07mi |
| 10401 Cedar Lk Rd S Minnetonka, MN | 1.0 | 1.0 | 600 | $1,295 | $2.16 | 4d | 1 | 0.15mi |
| 10401 Cedar Lake Rd #505 Hopkins, MN | 1.0 | 1.0 | 600 | $1,295 | $2.16 | 1d | 1 | 0.17mi |
| 10401 Cedar Lake Rd #505 Hopkins, MN | 1.0 | 1.0 | 600 | $1,395 | $2.33 | 45d | 1 | 0.17mi |
| 2828 Jordan Ave S Minnetonka, MN | 1.0–3.0 | 1.0–2.0 | 1008 | $1,359 | $1.35 | 6d | 9 | 0.34mi |
| 9700 Waterstone Pl Hopkins, MN | 1.0–2.0 | 1.0–2.0 | 1014 | $1,769 | $1.74 | 0d | 15 | 0.60mi |
| 10100 Minnetonka Blvd Hopkins, MN | 2.0 | 1.0 | 950 | $1,400 | $1.47 | 45d | 1 | 0.63mi |
| 10213 W 34th St Unit 10213-202 Minnetonka, MN | 2.0 | 1.0 | 948 | $1,795 | $1.89 | 5d | 1 | 0.83mi |
| 10213 W 34th St Unit 10213-204 Minnetonka, MN | 2.0 | 1.0 | 948 | $1,850 | $1.95 | 5d | 1 | 0.83mi |
| 10213 W 34th St Unit 10213-302 Minnetonka, MN | 2.0 | 1.0 | 948 | $1,995 | $2.10 | 5d | 1 | 0.83mi |
| 10213 W 34th St Unit 10233-302 Minnetonka, MN | 2.0 | 1.0 | 953 | $1,650 | $1.73 | 5d | 1 | 0.83mi |
| 10213 W 34th St Unit 10253-103 Minnetonka, MN | 1.0 | 1.0 | 707 | $1,350 | $1.91 | 6d | 1 | 0.83mi |
| 10213 W 34th St Minnetonka, MN | 1.0 | 1.0 | 707 | $1,295 | $1.83 | 5d | 1 | 0.83mi |
| 10213 W 34th St Unit 10233-304 Minnetonka, MN | 1.0 | 1.0 | 700 | $1,350 | $1.93 | 5d | 1 | 0.83mi |
| 10233 W 34th St Unit 10233-302 Minnetonka, MN | 2.0 | 1.0 | 953 | $1,650 | $1.73 | 0d | 1 | 0.85mi |
| 10253 W 34th St Unit 10253-103 Hopkins, MN | 1.0 | 1.0 | 707 | $1,295 | $1.83 | 0d | 1 | 0.88mi |
| 3033 Xylon Ave S Minneapolis, MN | 2.0 | 1.0 | 837 | $1,262 | $1.51 | 6d | 2 | 1.22mi |
| 8824 W 35th St Unit 9 Minneapolis, MN | 1.0 | 1.0 | 700 | $1,065 | $1.52 | 26d | 1 | 1.26mi |
| 8817 W 35th St Minneapolis, MN | 1.0–2.0 | 1.0 | 787 | $1,175 | $1.49 | 6d | 2 | 1.28mi |
| 8216 W 31st St Unit 07 Minneapolis, MN | 2.0 | 1.0 | 950 | $1,250 | $1.32 | 26d | 1 | 1.29mi |
| 8216 W 31st St Unit 08 Minneapolis, MN | 2.0 | 1.0 | 950 | $1,250 | $1.32 | 6d | 1 | 1.29mi |
| 8801 W 35th St Minneapolis, MN | 1.0 | 1.0 | 650 | $1,025 | $1.58 | 45d | 1 | 1.30mi |
| 8201 W 30 1/2 St Minneapolis, MN | 2.0 | 1.0 | 850 | $1,295 | $1.52 | 6d | 1 | 1.30mi |
| 8200 W 31st St Minneapolis, MN | 1.0 | 1.0 | 689 | $1,100 | $1.60 | 45d | 2 | 1.32mi |
| 3544 Aquila Cir Unit 8 St Louis Park, MN | 2.0 | 1.0 | 800 | $1,299 | $1.62 | 45d | 1 | 1.32mi |
| 3055 Virginia Ave S Unit 3055-12 St Louis Park, MN | 1.0 | 1.0 | 675 | $1,075 | $1.59 | 25d | 1 | 1.35mi |
| 3055 Virginia Ave S St Louis Park, MN | 1.0 | 1.0 | 675 | $1,075 | $1.59 | 45d | 1 | 1.35mi |
| 3055 Virginia Ave S Unit 3063-18 St Louis Park, MN | 1.0 | 1.0 | 700 | $1,075 | $1.54 | 6d | 1 | 1.35mi |
| 3055 Virginia Ave S Unit 3055-2 St Louis Park, MN | 1.0 | 1.0 | 550 | $1,199 | $2.18 | 26d | 1 | 1.35mi |
| 3063 Virginia Ave S Minneapolis, MN | 1.0 | 1.0 | 700 | $1,075 | $1.54 | 6d | 1 | 1.35mi |
| 3101 Virginia Ave S Minneapolis, MN | 2.0 | 1.0–1.5 | 850 | $1,360 | $1.60 | 3d | 4 | 1.36mi |
| 3601 Phillips Pkwy Minneapolis, MN | 3.0 | 1.0–2.0 | 920 | $1,793 | $1.95 | 0d | 12 | 1.36mi |
| 3117 Virginia Ave S Unit 102 Minneapolis, MN | 2.0 | 1.0 | 970 | $1,425 | $1.47 | 45d | 1 | 1.37mi |
| 1919 Ymca Ln Hopkins, MN | 1.0–2.0 | 1.0–2.0 | 1023 | $1,545 | $1.51 | 0d | 5 | 1.39mi |
| 9920 Wayzata Blvd Minneapolis, MN | 2.0 | 1.0–2.5 | 942 | $2,451 | $2.60 | 0d | 29 | 1.41mi |
| 7920 Minnetonka Blvd Minneapolis, MN | 2.0 | 1.0–2.0 | 865 | $2,196 | $2.54 | 0d | 14 | 1.42mi |
| 1301 Highway 7 Hopkins, MN | 1.0–2.0 | 1.0 | 786 | $1,235 | $1.57 | 1d | 13 | 1.45mi |
HOA detail condo
- Monthly dues
- $480 · $5,760/yr
- Likely covers
- pool
- Assessments
- None detected in remarks — confirm with the listing agent.
Listing history 15 events
-
2026-03-26status Pending
-
2026-03-17historical Contingent - Inspection
-
2026-03-11status Active
-
2026-03-06status Pending
-
2026-02-24historical Contingent - Inspection
-
2026-02-07price $98,000
-
2025-04-11$123,900 Active
-
2021-04-26soldstatus $135,000
-
2021-04-09soldstatus $135,000 Sold 558-char remark
Show marketing remark (558 chars)
Welcome to Cedar Ridge and this spacious and sun-filled condo. As you enter you will notice that this unit has been remodeled creating the open floorplan you desire. The rooms are spacious in size and you will appreciate the amount of storage. If you are working from home, there are numerous spaces to set up your home office. Enjoy the amenities of this complex which include include tree covered walking paths, heated indoor pool, hot tub, sauna, party room, grilling area and large deck. Call today to set up your appointment to see this beautiful condo.
-
2021-03-01status Pending 558-char remark
Show marketing remark (558 chars)
Welcome to Cedar Ridge and this spacious and sun-filled condo. As you enter you will notice that this unit has been remodeled creating the open floorplan you desire. The rooms are spacious in size and you will appreciate the amount of storage. If you are working from home, there are numerous spaces to set up your home office. Enjoy the amenities of this complex which include include tree covered walking paths, heated indoor pool, hot tub, sauna, party room, grilling area and large deck. Call today to set up your appointment to see this beautiful condo.
-
2021-02-26$124,900 Active 558-char remark
Show marketing remark (558 chars)
Welcome to Cedar Ridge and this spacious and sun-filled condo. As you enter you will notice that this unit has been remodeled creating the open floorplan you desire. The rooms are spacious in size and you will appreciate the amount of storage. If you are working from home, there are numerous spaces to set up your home office. Enjoy the amenities of this complex which include include tree covered walking paths, heated indoor pool, hot tub, sauna, party room, grilling area and large deck. Call today to set up your appointment to see this beautiful condo.
-
2021-02-24historical $124,900 558-char remark
Show marketing remark (558 chars)
Welcome to Cedar Ridge and this spacious and sun-filled condo. As you enter you will notice that this unit has been remodeled creating the open floorplan you desire. The rooms are spacious in size and you will appreciate the amount of storage. If you are working from home, there are numerous spaces to set up your home office. Enjoy the amenities of this complex which include include tree covered walking paths, heated indoor pool, hot tub, sauna, party room, grilling area and large deck. Call today to set up your appointment to see this beautiful condo.
-
1994-05-02soldstatus $34,900
-
1994-03-02historical
-
1994-01-28$34,900
ⓘ Source: listings_history table (triggers on properties + properties_extension) + one-shot
backfill from property_details.listing_events for pre-trigger history.
Tax reassessment forecast MN · Partial reset (capped growth)
- Current annual tax
- $1,556 · $130/mo
- Projected year-2 tax
- $1,556 · $130/mo
- Expected delta
- $0/yr ($0/mo · 0.0%)
ⓘ Screening estimate from a state-policy table — verify with the county assessor before closing.
Climate risk First Street
- Flood 7/10 Severe FEMA zone X (unshaded) · 78% chance over 30 yrs
- Wildfire 1/10 Low
- Heat 2/10 Low 7 d/yr ≥98°F today · 14 d/yr by 30 yrs out
- Wind 2/10 Low
- Air quality 2/10 Low 2 unhealthy d/yr today · 2 by 30 yrs out
Nearby sold comps map
Loading sold comps map…
Walkable amenities ~0.75 mi
Loading nearby amenities…
Taxation est. · year 1
- Rental income
- $17,489
- − Mortgage interest
- −$5,490
- − Property taxes
- −$1,556
- − Insurance
- −$1,288
- − Repairs & maintenance
- −$1,399
- − Management
- −$1,399
- − HOA
- −$5,760
- − Depreciation
- −$2,851
- Taxable loss
- −$2,254
- Est. tax savings @ 24.0%
- +$541
- After-tax cash flow
- $-414/yr
For passive investors: Depreciation is non-cash, so a rental often shows a tax loss while cash-flowing — sheltering income. Rental losses are passive: they offset passive income freely, and up to $25,000/yr can offset ordinary (W-2) income if you actively participate and your MAGI is under $100k (phasing out to $0 by $150k); unused losses carry forward. On sale, claimed depreciation is recaptured at up to 25%, and gains may owe capital-gains tax (a 1031 exchange can defer both). Figures are a year-1 estimate at your 24.0% rate — not tax advice; consult a CPA.
Schools (NCES district)
- District
- Hopkins Public School District
- NCES district ID
- 2714260
- Math proficiency
- 48% ▼ -6.00%
- Reading proficiency
- 57% ▼ -2.00%
- Median HH income
- $66,915
- Composite
- 46.44/100
- National rank
- #2448
- State rank
- #75 of 301 in MN
Livability — Minnetonka
- Score
- 75/100
- State rank
- #187
- US rank
- #3994
Category grades
Schools grade is shown separately in the Schools card above.
Census & demographics
- Census place
- Minnetonka, MN
- County
- Hennepin County · 1,150,272 people
- City population
- 41,857
- Metro
- Minneapolis-St. Paul-Bloomington, MN-WI
- Population (ZIP)
- 21,068
- Household income
- $104,914
- Rent vs Own
- Severe rent burden
- 949.0
Population outlook (Hennepin County) Hauer SSP2
- Today (2025)
- 1,405,227 people
- By 2030
- 1,492,650 · +6.2%
- By 2040
- 1,660,157 · +18.1%
- By 2050
- 1,823,498 · +29.8%
- By 2075
- 2,221,283 · +58.1%
- By 2100
- 2,509,976 · +78.6%
Race, ethnicity, and origin ACS 2023
- Neighborhood character
- Predominantly White (78%)
- Race & ethnicity
- White 78% Asian 10% Two or more races 5% Hispanic / Latino 4% Black 4%
- Common ancestry
- Portuguese 11% Lithuanian 3% Romanian 3%
- Foreign-born
- 14% · Canada, China, South Korea
- Languages at home
- 84% English-only · Other Asian/Pacific 6% Other Indo-European 2% Spanish 2%
Political lean MEDSL · Hennepin
- 2024 margin
- Solid D (+42.6) · D 70.2% · R 27.5% · Other 2.3%
- 2008→2024 swing
- +14.0pp toward D · 2008: 28.6pp · 2024: 42.6pp
- All cycles
- 2024: D+42.6 2020: D+43.2 2016: D+35.3 2012: D+27.1 2008: D+28.6
Not yet ingested
- Civics
- —
Market trends
- HPI YoY
- ▼ -358.96%
- Current HPI
- 231.3421
- Rent YoY
- ▲ 3.28%
- Metro
- Minneapolis-St. Paul-Bloomington, MN-WI
- State GDP YoY
- ▲ 2.41%
- F500 in state
- 34
Industry mix (Fortune 500 HQ in MN)
| Industry | F500 HQs | Revenue |
|---|---|---|
| Healthcare | 2 | $407B |
|
||
| Retail | 2 | $150B |
|
||
| Consumer Goods | 2 | $32B |
|
||
| Industrial Machinery | 2 | $6B |
|
||
| Agriculture | 1 | $40B |
|
||
| Healthcare / Medical Devices | 1 | $32B |
|
||
Price history
+180.8% since first listed15 events — show timeline
- 2026-03-26 Pending — NORTHSTARMLS as Distributed by MLS Grid
- 2026-03-17 Contingent — NORTHSTARMLS as Distributed by MLS Grid
- 2026-03-11 Relisted — NORTHSTARMLS as Distributed by MLS Grid
- 2026-03-06 Pending — NORTHSTARMLS as Distributed by MLS Grid
- 2026-02-24 Contingent — NORTHSTARMLS as Distributed by MLS Grid
- 2026-02-07 Price Changed $98,000 NORTHSTARMLS as Distributed by MLS Grid
- 2025-04-11 Listed $123,900 NORTHSTARMLS as Distributed by MLS Grid
- 2021-04-26 Sold (Public Records) $135,000 Public Records
- 2021-04-09 Sold (MLS) $135,000 NORTHSTARMLS as Distributed by MLS Grid
- 2021-03-01 Pending — NORTHSTARMLS as Distributed by MLS Grid
- 2021-02-26 Listed $124,900 NORTHSTARMLS as Distributed by MLS Grid
- 2021-02-24 Coming Soon $124,900 NORTHSTARMLS as Distributed by MLS Grid
- 1994-05-02 Sold (MLS) $34,900 NORTHSTARMLS as Distributed by MLS Grid
- 1994-03-02 Listing Removed — NORTHSTARMLS as Distributed by MLS Grid
- 1994-01-28 Listed $34,900 NORTHSTARMLS as Distributed by MLS Grid
Property tax history
+1.4%/yrLatest (2025): $1,556 · -6.1% YoY. Source: county tax records.
Cash-flow waterfall
monthlySold comps — $/sqft
last 12 mo · ≤1 miLoading sold comps…