908 E 26th St E · Erie, PA
Flood risk 1/10 · Minimal
- FEMA flood zone
- X (unshaded)
- Chance of flooding over 30 yrs
- 0.0%
- Est. flood insurance / yr
- $473 – $860
Fire risk 1/10 · Minimal
- Est. fire insurance / yr
- $511 – $949
Heat risk 3/10 · Minor
- Hot days now (above 90°F)
- 7 days/yr
- Hot days in 30 yrs
- 17 days/yr
Wind risk 1/10 · Minimal
- Chance of severe wind over 30 yrs
- —
Air-quality risk 2/10 · Minimal
- Unhealthy air days now
- 1 days/yr
- Unhealthy air days in 30 yrs
- 3 days/yr
Risk factors via First Street. Map © Google.
Why this score? — see what drove the B+ grade
The composite is a weighted blend of 9 inputs, each scored 0–100. Each bar is that input's sub-score; the figure is the points it added to the 100-point composite (weight × sub-score).
- Cash flow +30.0/30.0
- 1% rule +10.0/10.0
- DSCR +10.0/10.0
- Appreciation +7.9/10.0
- ARV discount +7.5/15.0
- Livability +4.2/5.0
- Rent growth +2.5/5.0
- Condition / age +2.5/5.0
- Schools +1.3/10.0
$24,900
🖨 Deal sheet (PDF) 📄 Offer letter ✓ Due diligence
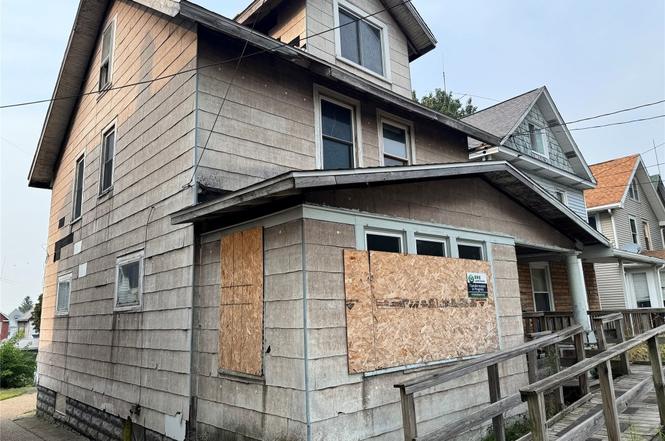
Listing remarks
Single Family house with 2 bedrooms and 2 full baths. This property is an opportunity to invest in helping Erie renovate properties. The bones on this house are sturdy but need interior and exterior renovations. All offers must be accompanied by ELB Developer Proposal. See attachment.
Key facts
- 4,726 sq ft lot
- Parking
- Built 1920
Neighborhood map
What this means for you Summary
Snapshot
- This is a 3-bed/1.0-bath single-family listed at $25k.
Deal economics
- At list price, monthly cash flow is $643 ($8k/yr) — positive.
- The deal already cash-flows at list — no discount required.
- Meets the 1% rule at list price ($1k rent vs $25k).
- Recommended offer: $24k (3.0% below list) — sets the bar for market timing.
- Cap rate 37.3% vs local median 5.1% in Erie — top-decile yield for the area; either an underpriced asset or a hidden risk that comps aren't pricing in. Stress-test before assuming the spread holds.
Location & tenants
- Location reads 83/100 on livability (#109 in PA, #840 nationally) — a professional / high-income tenant draw. Strengths: amenities A+, commute A+, cost of living A+; Watch: crime D+, employment F.
- Erie City SD (urban): math 12% / reading 19% proficiency, ranked #510 of 539 in PA (top 95%) — low school quality limits family demand, transient renter base, plan for 1-2y turnover; 81% free/reduced lunch — lower-income household profile, screen leases tightly.
- Zoned schools: Lincoln El Sch (math 8% / reading 27%, grade F, #1,295 of 1,518 statewide, top 86%, 370 students, 100% FRL); Woodrow Wilson Ms (math 5% / reading 19%, grade F, #489 of 512 statewide, top 96%, 756 students, 100% FRL); Northwest Pa Collegiate Academy (math 82%, 753 students, 100% FRL) — zoned schools average 100% FRL vs 81% district-wide (19 pts higher); higher-poverty schools than district average — tighter screening recommended.
- Market conditions: 48 active listings in the ZIP; 4 comparable units currently listed for rent nearby; rentals lingering (median 45d on market — plan ~5-8 weeks vacancy on turnover, expect pricing pressure); 100% of comp listings sitting > 30 days — soft ceiling on asking rent; 364 units permitted in Erie County in 2024 (188 in 5+ unit buildings).
Forward outlook
- In year one you build about $2k of equity ($172 loan paydown + $1k appreciation (5.7% local appreciation)).
- Erie County population projected at -14% by 2050 — secular population decline; favor cash flow + early exit over multi-decade hold.
- At projected returns (5.7% appreciation + 3.0% rent growth), your $7k cash investment doubles in ~1 year — after that, you're playing with house money.
Negotiation context
- It's been on market 40 days — a 3% lower offer ($24k) is reasonable based on typical stale-listing flexibility.
Risks & watch-outs
- Watch-outs: built in 1920 — expect roof / HVAC / electrical / plumbing capex.
Questions for the listing agent
- It's been on market 40 days. Have you received any prior offers? Is the seller open to a 3% concession, seller financing, or rate buy-down credit?
- Built in 1920 — when were the roof, HVAC, electrical panel, plumbing, and water heater last replaced?
- Is there a deadline driving the sale (1031 exchange, divorce, estate, relocation)? That informs how much negotiation room exists.
- Crime grade is D in this area — have there been break-ins, vandalism, or insurance claims at this property in the last 3 years? What carrier currently insures it and at what premium?
- What's the average days-on-market for RENTAL listings here right now (not sales)? A rising rental-DOM trend means longer vacancies and softer asking-rent achievability than the comps imply.
- What's the recent tenant-quality profile in this submarket — average credit score on applications, eviction rate, late-payment / NSF rate, and stable-employment percentage? A property-management company in the area should have these aggregated.
- How much new for-sale + rental construction is in the pipeline within 1–3 miles? Heavy new supply typically softens prices + rents 12–24 months out; constrained supply supports both.
Investment metrics
- 1% rule
- 4.14% ✓
- Cap rate
- 37.27%
- Cash-on-cash
- 110.62%
- DSCR
- 5.92
- GRM
- 2.0
CMA / ARV
- ARV (on-the-fly)
- $142,800
- Comps found
- 12
Show comp detail 12 sales within ~0.75 mi
| Address | Dist | Beds/Ba | Sqft | Sold | Price | $/sf | Match |
|---|---|---|---|---|---|---|---|
| 2607 Jackson Ave | 0.10mi | 3/1.0 | 1,478 (+6%) | 3mo | $59,000 | $40 | 84 |
| 834 E 28th St | 0.15mi | 3/1.0 | 1,320 (-6%) | 0mo | $60,000 | $45 | 83 |
| 1038 E 24th St | 0.24mi | 4/1.0 (+1) | 1,352 (-3%) | 2mo | $139,900 | $103 | 77 |
| 925 E 34th St | 0.53mi | 4/2.0 (+1) | 1,399 (-0%) | 3mo | $140,000 | $100 | 63 |
| 749 E 32nd St | 0.44mi | 3/1.0 | 1,270 (-9%) | 1mo | $181,000 | $143 | 63 |
| 953 E 33rd St | 0.48mi | 2/1.0 (-1) | 1,333 (-5%) | 3mo | $99,500 | $75 | 63 |
| 1060 E 24th St | 0.27mi | 3/1.0 | 1,200 (-14%) | 3mo | $35,000 | $29 | 61 |
| 1033 E 29 St | 0.30mi | 3/2.0 | 1,232 (-12%) | 1mo | $180,000 | $146 | 61 |
| 1156 E 30th St | 0.44mi | 4/1.0 (+1) | 1,540 (+10%) | 0mo | $174,900 | $114 | 57 |
| 1224 E 22nd St | 0.50mi | 3/1.5 | 1,584 (+13%) | 1mo | $120,000 | $76 | 52 |
| 1316 Buffalo Rd | 0.65mi | 4/1.5 (+1) | 1,470 (+5%) | 3mo | $149,900 | $102 | 52 |
| 909 E 37th St | 0.72mi | 4/2.5 (+1) | 1,285 (-8%) | 2mo | $142,000 | $111 | 40 |
Match score weights: distance 35% · size 25% · config 20% · recency 20%. Top-matched comps best support the ARV.
Projected returns pro-forma
5.73% appreciation · 3.0% rent growth · sell at horizon
- IRR
- —
- Equity multiple
- 7.85×
- Total profit
- $47,742
- Equity at exit
- $15,230
- IRR
- —
- Equity multiple
- 16.57×
- Total profit
- $108,520
- Equity at exit
- $27,261
Cash invested: $6,972 (down + closing). Projections, not guarantees.
Landlord ↔ Tenant lean methodology
- Overall (STATE)
- 62 Landlord-Friendly
- State Pennsylvania
- 62 Landlord-Friendly · EVEN
- County
- — inherits STATE
- City
- — inherits STATE
ZIP-level market 16503
- Home prices YoY
- 4.4%
- Active inventory
- 48
- Price-to-rent
- 2.0×
Monthly cashflow live
- Estimated rent
- $1,031 medium interval (Pro) →
- Mortgage (P&I)
- −$131
- Tax est. 1.5%
- −$31 /mo · $374/yr
- Insurance
- −$10
- HOA
- −$0
- Vacancy / Maint / Mgmt
- −$217
- Net cashflow
- $643
Break-even live
Sensitivity live
| Price | -10% $660 | -5% $651 | +0% $643 | +5% $634 | +10% $626 |
|---|---|---|---|---|---|
| Rent | -10% $561 | -5% $602 | +0% $643 | +5% $683 | +10% $724 |
| Rate | -1.0pp $655 | -0.5pp $649 | base $643 | +0.5pp $636 | +1.0pp $630 |
UW: 25.0% down · 7.5% · 30yr · 1.5% tax · 5.0% vac · 8.0% maint · 8.0% mgmt
Financing live
Cash to close
- Down payment
- $6,225
- Closing costs
- $747
- Reserves months
- —
- Total cash needed
- —
Loan-product check · same deal, 3 products live
Conventional
25% down · 7.5% · 30yr
- Down + closing
- —
- Monthly P&I
- —
- Monthly cashflow
- —
- DSCR
- —
- Eligible?
- —
Personal DTI + credit; lowest rate.
DSCR
20% down · 8.5% · 30yr
- Down + closing
- —
- Monthly P&I
- —
- Monthly cashflow
- —
- DSCR
- —
- Eligible?
- —
No personal income docs; deal must DSCR.
Hard money
10% down · 12.0% · 12mo
- Down + closing
- —
- Monthly P&I
- —
- Monthly cashflow
- —
- DSCR
- —
- Eligible?
- —
Short-term bridge; refi at stabilization.
Rent comps 4 comps
| Address | Beds | Baths | Sqft | Rent | $/sqft | DOM | Units | Dist |
|---|---|---|---|---|---|---|---|---|
| 614 E 22nd St Unit 1 Erie, PA | 3.0 | 1.0 | 1300 | $1,000 | $0.77 | 45d | 1 | 0.47mi |
| 115 W 32nd St Erie, PA | 3.0 | 2.0 | 1844 | $1,050 | $0.57 | 45d | 1 | 1.36mi |
| 519 E 6th St Unit 3 Erie, PA | 2.0 | 1.0 | 900 | $775 | $0.86 | 45d | 1 | 1.40mi |
| 223 E 9th St Erie, PA | 2.0 | 2.0 | 1564 | $1,300 | $0.83 | 45d | 1 | 1.43mi |
Listing history 2 events
-
2025-09-15status Pending
-
2025-08-05$24,900 Active
ⓘ Source: listings_history table (triggers on properties + properties_extension) + one-shot
backfill from property_details.listing_events for pre-trigger history.
Climate risk First Street
- Flood 1/10 Low FEMA zone X (unshaded) · 0% chance over 30 yrs
- Wildfire 1/10 Low
- Heat 3/10 Moderate 7 d/yr ≥90°F today · 17 d/yr by 30 yrs out
- Wind 1/10 Low
- Air quality 2/10 Low 1 unhealthy d/yr today · 3 by 30 yrs out
Nearby sold comps map
Loading sold comps map…
Walkable amenities ~0.75 mi
Loading nearby amenities…
Taxation est. · year 1
- Rental income
- $12,377
- − Mortgage interest
- −$1,395
- − Property taxes
- −$374
- − Insurance
- −$124
- − Repairs & maintenance
- −$990
- − Management
- −$990
- − Depreciation
- −$724
- Taxable income
- $7,779
- Est. tax owed @ 24.0%
- −$1,867
- After-tax cash flow
- $5,846/yr
For passive investors: Depreciation is non-cash, so a rental often shows a tax loss while cash-flowing — sheltering income. Rental losses are passive: they offset passive income freely, and up to $25,000/yr can offset ordinary (W-2) income if you actively participate and your MAGI is under $100k (phasing out to $0 by $150k); unused losses carry forward. On sale, claimed depreciation is recaptured at up to 25%, and gains may owe capital-gains tax (a 1031 exchange can defer both). Figures are a year-1 estimate at your 24.0% rate — not tax advice; consult a CPA.
Schools (NCES district)
- District
- Erie City SD
- NCES district ID
- 4209300
- Math proficiency
- 12% ▼ -11.00%
- Reading proficiency
- 19% ▼ -16.00%
- Median HH income
- $33,625
- Composite
- 12.59/100
- National rank
- #9617
- State rank
- #510 of 539 in PA
Livability — Erie
- Score
- 83/100
- State rank
- #109
- US rank
- #840
Category grades
Schools grade is shown separately in the Schools card above.
Census & demographics
- Census place
- Erie, PA
- City population
- 92,215
- Population (ZIP)
- 15,204
Population outlook (Erie County) Hauer SSP2
- Today (2025)
- 272,159 people
- By 2030
- 266,299 · -2.2%
- By 2040
- 250,987 · -7.8%
- By 2050
- 234,925 · -13.7%
- By 2075
- 199,164 · -26.8%
- By 2100
- 162,985 · -40.1%
Race, ethnicity, and origin ACS 2023
- Neighborhood character
- Diverse neighborhood (Simpson 0.65)
- Race & ethnicity
- White 45% Black 37% Hispanic / Latino 10% Two or more races 8% Asian 2%
- Hispanic origin (detail)
- Mexican 2% Puerto Rican 7%
- Common ancestry
- Romanian 6% Scotch-Irish 1% Lithuanian 1%
- Foreign-born
- 6% · India, Canada
- Languages at home
- 90% English-only · Spanish 4% Arabic 2% Other Indo-European 2%
Political lean MEDSL · Erie
- 2024 margin
- Toss-up / Even · D 49.0% · R 50.0%
- 2008→2024 swing
- -20.9pp toward R · 2008: 19.9pp · 2024: -1.0pp
- All cycles
- 2024: R+1.0 2020: D+1.0 2016: R+2.0 2012: D+16.9 2008: D+19.9
Not yet ingested
- Civics
- —
Market trends
- HPI YoY
- ▲ 5.73%
- Current HPI
- 135.5955
- Rent YoY
- —
- Metro
- —
- State GDP YoY
- ▲ 1.68%
- F500 in state
- 34
Industry mix (Fortune 500 HQ in PA)
| Industry | F500 HQs | Revenue |
|---|---|---|
| Healthcare | 2 | $309B |
|
||
| Insurance | 2 | $27B |
|
||
| Telecommunications / Media | 1 | $124B |
|
||
| Industrial Distribution | 1 | $22B |
|
||
| Financial Services | 1 | $20B |
|
||
| Chemicals / Materials | 1 | $18B |
|
||
Price history
2 events — show timeline
- 2025-09-15 Pending — GEBOR
- 2025-08-05 Listed $24,900 GEBOR
Property tax history
+1.9%/yrLatest (2026): $1,533 · +3.4% YoY. Source: county tax records.
Cash-flow waterfall
monthlySold comps — $/sqft
last 12 mo · ≤1 miLoading sold comps…