 Duplex
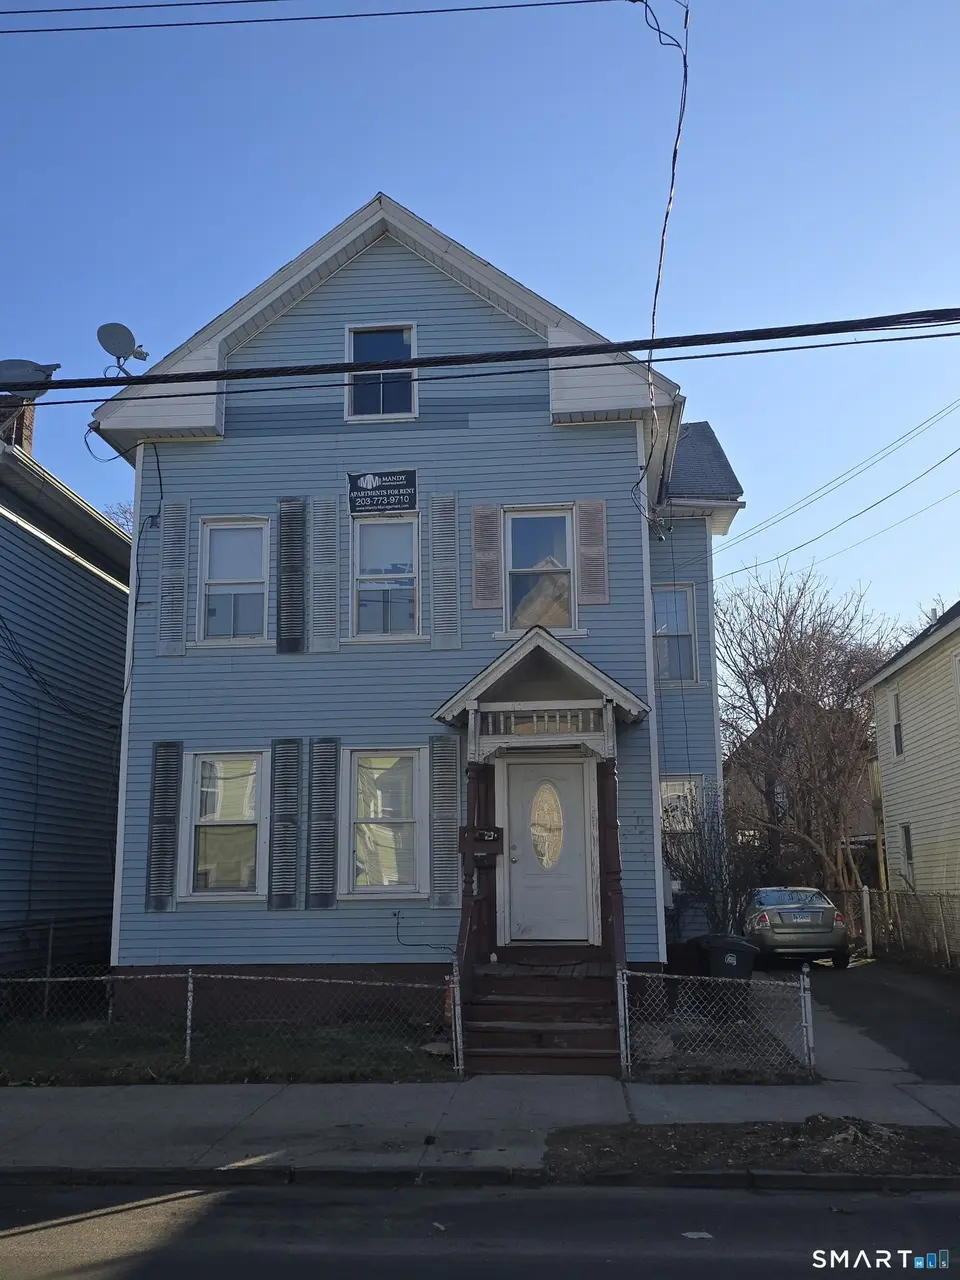
265 James St · New Haven, CT
Flood risk 1/10 · Minimal
- FEMA flood zone
- X (unshaded)
- Chance of flooding over 30 yrs
- 0.0%
- Est. flood insurance / yr
- $473 – $860
Fire risk 1/10 · Minimal
- Est. fire insurance / yr
- $829 – $1,539
Heat risk 7/10 · Major
- Hot days now (above 99°F)
- 7 days/yr
- Hot days in 30 yrs
- 16 days/yr
Wind risk 6/10 · Moderate
- Chance of severe wind over 30 yrs
- 61.0%
Air-quality risk 5/10 · Moderate
- Unhealthy air days now
- 6 days/yr
- Unhealthy air days in 30 yrs
- 8 days/yr
Risk factors via First Street. Map © Google.
Why this score? — see what drove the B- grade
The composite is a weighted blend of 9 inputs, each scored 0–100. Each bar is that input's sub-score; the figure is the points it added to the 100-point composite (weight × sub-score).
- Cash flow +24.5/30.0
- ARV discount +15.0/15.0
- DSCR +7.9/10.0
- 1% rule +6.2/10.0
- Livability +4.0/5.0
- Rent growth +3.5/5.0
- Condition / age +2.5/5.0
- Schools +1.5/10.0
- Appreciation +0.0/10.0
$390,000
🖨 Deal sheet 📄 Offer letter ✓ Due diligence
Multi-family units
County records classify this as Multi-Family (2-4 Unit). Listing-text estimate: 2 units. confirmed
Listing remarks MLS
Diamond in the rough! With a little work and this could be good be a good income producer
Key facts
- Income potential
- Inviting living area
- Move-in-ready home
Tags
Neighborhood map
What this means for you Summary
Snapshot
- This is a 2 × 3-bed/1.5-bath units multifamily listed at $390k.
Deal economics
- At list price, monthly cash flow is $801 ($10k/yr) — positive. Per door: $400/mo.
- The deal already cash-flows at list — no discount required.
- Meets the 1% rule at list price ($4k rent vs $390k).
- Cap rate 8.8% vs local median 4.8% in New Haven — top-decile yield for the area; either an underpriced asset or a hidden risk that comps aren't pricing in. Stress-test before assuming the spread holds.
Location & tenants
- Location reads 79/100 on livability (#31 in CT, #2,190 nationally) — a middle-class / working-renter tenant base. Strengths: amenities A+, commute A+, health & safety A+; Watch: employment D, crime F.
- New Haven School District (urban): math 12% / reading 25% proficiency, ranked #147 of 153 in CT (top 96%) — low school quality limits family demand, transient renter base, plan for 1-2y turnover; 66% free/reduced lunch — lower-income household profile, screen leases tightly.
- Zoned schools: Fair Haven School (math 3% / reading 12%, grade F, #529 of 553 statewide, top 97%, 682 students, 81% FRL) — zoned schools average 81% FRL vs 66% district-wide (15 pts higher); higher-poverty schools than district average — tighter screening recommended.
- Market conditions: Rents rising fast (+4.1%/yr); 101 active listings in the ZIP; 28 comparable units currently listed for rent nearby; rentals at typical pace (median 24d on market — plan ~3-4 weeks tenant-placement turnaround); 43% of comp listings sitting > 30 days — soft ceiling on asking rent; 1,059 units permitted in South Central Connecticut Planning Region in 2024 (779 in 5+ unit buildings).
- At $4,351/mo this rent would consume 108% of the median local household income ($48k/yr) (locally 2664% of renters already pay >50% of income on rent) — very limited rent-growth headroom before tenants either downsize or default.
Forward outlook
- Local home prices are declining (-3.0%/yr); year-one equity from $3k of loan paydown is wiped out by about $12k of value loss. Plan a longer hold.
- At projected returns (-3.0% appreciation + 4.1% rent growth), your $109k cash investment doubles in ~10 years — after that, you're playing with house money.
Negotiation context
- Only 9 days on market — expect competitive offers; lowballing is unlikely to land.
- 4 sale attempts since 19y ago with the ask held roughly flat each time — persistent listings suggest the price (not the market) is what's stuck; bring a comps-based counter.
- Current owner paid $75k; list at $390k implies a 420% gain — meaningful room to come down on a strong offer.
Risks & watch-outs
- Watch-outs: built in 1900 — expect roof / HVAC / electrical / plumbing capex.
- Climate carrying-cost: major wind risk, 61% chance of damaging wind over 30y; extreme-heat days projected 7→16/yr by 2055 (HVAC capex compounding) — expect insurance premiums to compound above CPI over the hold.
Questions for the listing agent
- Can we see the unit-by-unit rent roll, current vacancy, and any below-market leases? What's the average tenancy length?
- What capital expenditures (roof, boiler, parking lot, exteriors) have been made in the last 5 years, and what's planned in the next 2?
- Built in 1900 — when were the roof, HVAC, electrical panel, plumbing, and water heater last replaced?
- Is there a deadline driving the sale (1031 exchange, divorce, estate, relocation)? That informs how much negotiation room exists.
- Schools are D-rated, which usually means shorter tenancies and higher turnover. Who's the typical renter profile here, and what's been the actual vacancy rate?
- Crime grade is F in this area — have there been break-ins, vandalism, or insurance claims at this property in the last 3 years? What carrier currently insures it and at what premium?
- What's the average days-on-market for RENTAL listings here right now (not sales)? A rising rental-DOM trend means longer vacancies and softer asking-rent achievability than the comps imply.
- What's the recent tenant-quality profile in this submarket — average credit score on applications, eviction rate, late-payment / NSF rate, and stable-employment percentage? A property-management company in the area should have these aggregated.
- How much new apartment / multifamily construction is in the pipeline within 1–3 miles? Heavy new supply (>2% of stock underway) typically softens rents 12–24 months out; light construction supports rent growth.
Investment metrics
- 1% rule
- 1.12% ✓
- Cap rate
- 8.76%
- Cash-on-cash
- 8.80%
- DSCR
- 1.39
- GRM
- 7.5
CMA / ARV
- ARV (on-the-fly)
- $472,990
- Comps found
- 12
Show comp detail 12 sales within ~0.75 mi
| Address | Dist | Beds/Ba | Sqft | Sold | Price | $/sf | Match |
|---|---|---|---|---|---|---|---|
| 169 James St | 0.19mi | 5/3.0 (+1) | 2,255 (-3%) | 2mo | $376,000 | $167 | 79 |
| 175 James St | 0.18mi | 5/3.0 (+1) | 2,263 (-3%) | 7mo | $400,000 | $177 | 76 |
| 422 Blatchley Ave | 0.30mi | 5/3.0 (+1) | 2,220 (-5%) | 7mo | $449,900 | $203 | 68 |
| 295 Lloyd St | 0.12mi | 4/2.0 | 2,621 (+12%) | 5mo | $325,000 | $124 | 65 |
| 20 Nash St | 0.59mi | 5/3.0 (+1) | 2,229 (-4%) | 2mo | $740,000 | $332 | 58 |
| 71 Houston St | 0.58mi | 5/2.0 (+1) | 2,296 (-2%) | 6mo | $515,000 | $224 | 56 |
| 34 NASH St | 0.60mi | 4/2.5 | 2,361 (+1%) | 15mo | $600,000 | $254 | 55 |
| 315 Lombard St | 0.54mi | 5/2.0 (+1) | 2,362 (+1%) | 11mo | $395,000 | $167 | 55 |
| 141 Wolcott St | 0.30mi | 5/3.0 (+1) | 2,632 (+13%) | 7mo | $449,900 | $171 | 53 |
| 429 Poplar St | 0.37mi | 5/3.0 (+1) | 2,539 (+9%) | 12mo | $360,000 | $142 | 53 |
| 439 Lombard St | 0.40mi | 4/2.0 | 1,996 (-14%) | 4mo | $440,000 | $220 | 50 |
| 121 Nicoll St | 0.69mi | 5/2.0 (+1) | 2,258 (-3%) | 12mo | $510,000 | $226 | 44 |
Match score weights: distance 35% · size 25% · config 20% · recency 20%. Top-matched comps best support the ARV.
Projected returns pro-forma
-3.0% appreciation · 4.12% rent growth · sell at horizon
- IRR
- -1.7%
- Equity multiple
- 0.93×
- Total profit
- $-7,209
- Equity at exit
- $58,150
- IRR
- 9.1%
- Equity multiple
- 1.74×
- Total profit
- $80,327
- Equity at exit
- $33,720
Cash invested: $109,200 (down + closing). Projections, not guarantees.
Landlord ↔ Tenant lean methodology
- Overall (STATE)
- 27 Tenant-Leaning
- State Connecticut
- 27 Tenant-Leaning · D+7
- County
- — inherits STATE
- City
- — inherits STATE
ZIP-level market 06513
- Home prices YoY
- -7.8%
- Rents YoY
- 4.1%
- Active inventory
- 101
- Price-to-rent
- 14.9×
Monthly cashflow live
- Estimated rent
- $4,351 high interval (Pro) →
- Mortgage (P&I)
- −$2,045
- Tax from tax record
- −$429 /mo · $5,146/yr
- Insurance
- −$162
- HOA
- −$0
- Vacancy / Maint / Mgmt
- −$914
- Net cashflow
- $801
Break-even live
2-unit breakdown (identical units grouped — click to expand)
| Units | Beds | Baths | Est. rent |
|---|---|---|---|
| 2× units | 3 | 1.5 | $4,352 |
| #1 | 3 | 1.5 | $2,176 |
| #2 | 3 | 1.5 | $2,176 |
| Total (2 units) | $4,351 | ||
UW: 25.0% down · 7.5% · 30yr · 1.5% tax · 5.0% vac · 8.0% maint · 8.0% mgmt
Financing live
Cash to close
- Down payment
- $97,500
- Closing costs
- $11,700
- Reserves months
- —
- Total cash needed
- —
Loan-product check · same deal, 3 products live
Conventional
25% down · 7.5% · 30yr
- Down + closing
- —
- Monthly P&I
- —
- Monthly cashflow
- —
- DSCR
- —
- Eligible?
- —
Personal DTI + credit; lowest rate.
DSCR
20% down · 8.5% · 30yr
- Down + closing
- —
- Monthly P&I
- —
- Monthly cashflow
- —
- DSCR
- —
- Eligible?
- —
No personal income docs; deal must DSCR.
Hard money
10% down · 12.0% · 12mo
- Down + closing
- —
- Monthly P&I
- —
- Monthly cashflow
- —
- DSCR
- —
- Eligible?
- —
Short-term bridge; refi at stabilization.
Rent comps 28 comps
| Address | Beds | Baths | Sqft | Rent | $/sqft | DOM | Units | Dist |
|---|---|---|---|---|---|---|---|---|
| 295 Lloyd St Unit 2 New Haven, CT | 4.0 | 2.0 | 2621 | $2,400 | $0.92 | 2d | 1 | 0.11mi |
| 302 Exchange St Unit 2 New Haven, CT | 5.0 | 2.0 | 1800 | $2,500 | $1.39 | 43d | 1 | 0.24mi |
| 426 Poplar St New Haven, CT | 3.0 | 1.0 | 1658 | $1,800 | $1.09 | 43d | 1 | 0.33mi |
| 115 Lloyd St #2 New Haven, CT | 4.0 | 2.0 | 2100 | $2,500 | $1.19 | 43d | 1 | 0.41mi |
| 902 State St #2 New Haven, CT | 3.0 | 2.5 | 1950 | $3,750 | $1.92 | 23d | 1 | 0.56mi |
| 28 Edwards St Unit 2 New Haven, CT | 4.0 | 2.0 | 1800 | $3,850 | $2.14 | 14d | 1 | 0.58mi |
| 39 Houston St Unit 2 New Haven, CT | 3.0 | 1.0 | 2863 | $2,200 | $0.77 | 43d | 1 | 0.60mi |
| 199 English St Unit 2 New Haven, CT | 3.0 | 1.0 | 2776 | $2,000 | $0.72 | 43d | 1 | 0.60mi |
| 31 Clark St New Haven, CT | 4.0 | 2.0 | 1694 | $4,200 | $2.48 | 3d | 1 | 0.64mi |
| 441 Chapel St Unit 2A1 (shared) New Haven, CT | 4.0 | 4.0 | 2151 | $3,600 | $1.67 | 2d | 1 | 0.65mi |
| 37 E Pearl St New Haven, CT | 3.0 | 1.0 | 1600 | $2,595 | $1.62 | 43d | 1 | 0.65mi |
| 300 Humphrey St Unit 2 New Haven, CT | 3.0 | 2.0 | 2868 | $3,295 | $1.15 | 43d | 1 | 0.66mi |
| 315 Humphrey St Unit A New Haven, CT | 4.0 | 3.5 | 2465 | $4,500 | $1.83 | 3d | 1 | 0.69mi |
| 30 Trumbull St New Haven, CT | 5.0 | 4.0 | 2668 | $5,000 | $1.87 | 3d | 1 | 0.83mi |
| 120 Downing St Unit 3 New Haven, CT | 3.0 | 2.0 | 1800 | $2,450 | $1.36 | 43d | 1 | 0.84mi |
| 63 Lombard St Unit 3 New Haven, CT | 3.0 | 1.0 | 3053 | $1,850 | $0.61 | 3d | 1 | 0.86mi |
| 399 Orange St New Haven, CT | 4.0 | 1.5 | 1650 | $3,200 | $1.94 | 11d | 1 | 0.86mi |
| 395 Orange St Unit 2 New Haven, CT | 4.0 | 1.5 | 1650 | $3,000 | $1.82 | 43d | 1 | 0.87mi |
| 367 Orange St New Haven, CT | 3.0 | 1.0–2.0 | 1075 | $4,973 | $4.63 | 2d | 43 | 0.87mi |
| 239 Bradley St Unit 1 New Haven, CT | 3.0 | 1.0 | 1982 | $3,650 | $1.84 | 43d | 1 | 0.91mi |
| 54 Trumbull St Unit 54-1 New Haven, CT | 5.0 | 2.5 | 2250 | $6,695 | $2.98 | 14d | 1 | 0.94mi |
| 68 Anderson St Unit A New Haven, CT | 3.0 | 2.5 | 1693 | $4,500 | $2.66 | 43d | 1 | 0.98mi |
| 339 Willow St Unit 1 New Haven, CT | 4.0 | 2.0 | 2163 | $4,050 | $1.87 | 11d | 1 | 1.13mi |
| 420 Whitney Ave Unit 424-3B New Haven, CT | 4.0 | 3.0 | 1800 | $4,700 | $2.61 | 3d | 1 | 1.16mi |
| 420 Whitney Ave New Haven, CT | 3.0–4.0 | 2.0–3.0 | 1800 | $4,700 | $2.61 | 11d | 2 | 1.16mi |
| 904 Quinnipiac Ave New Haven, CT | 3.0 | 1.5 | 2125 | $3,298 | $1.55 | 2d | 1 | 1.21mi |
| 56 Mansfield St Unit 1 New Haven, CT | 3.0 | 1.0 | 2759 | $2,800 | $1.01 | 43d | 1 | 1.28mi |
| 134 Mansfield St New Haven, CT | 5.0 | 2.0 | 1960 | $5,500 | $2.81 | 23d | 1 | 1.36mi |
Listing history 10 events
-
2026-03-26status Under Contract
-
2026-03-17$390,000 Active
-
2013-11-15soldstatus $75,000 89-char remark
Show marketing remark (89 chars)
Diamond in the rough! With a little work and this could be good be a good income producer
-
2013-10-18$64,900 89-char remark
Show marketing remark (89 chars)
Diamond in the rough! With a little work and this could be good be a good income producer
-
2008-04-30soldstatus $95,000 219-char remark
Show marketing remark (219 chars)
Three family dwelling offering great potential, each unit has two bedrooms each floor- copper has been removed- home offers great potential . Will not qualifly for fha or chfa- pre qual or proof needed with all offers-
-
2008-01-31historical
-
2008-01-11$114,900 219-char remark
Show marketing remark (219 chars)
Three family dwelling offering great potential, each unit has two bedrooms each floor- copper has been removed- home offers great potential . Will not qualifly for fha or chfa- pre qual or proof needed with all offers-
-
2007-01-31$189,900
-
2005-05-26soldstatus $151,000
-
2002-06-19soldstatus $86,000
ⓘ Source: listings_history table (triggers on properties + properties_extension) + one-shot
backfill from property_details.listing_events for pre-trigger history.
Tax reassessment forecast CT · Partial reset (capped growth)
- Current annual tax
- $5,146 · $429/mo
- Projected year-2 tax
- $6,746 · $562/mo
- Expected delta
- +$1,600/yr (+$133/mo · 31.1%)
ⓘ Screening estimate from a state-policy table — verify with the county assessor before closing.
Climate risk First Street
- Flood 1/10 Low FEMA zone X (unshaded) · 0% chance over 30 yrs
- Wildfire 1/10 Low
- Heat 7/10 Severe 7 d/yr ≥99°F today · 16 d/yr by 30 yrs out
- Wind 6/10 Major 61% chance of damaging wind over 30 yrs
- Air quality 5/10 Major 6 unhealthy d/yr today · 8 by 30 yrs out
Nearby sold comps map
Loading sold comps map…
Walkable amenities ~0.75 mi
Loading nearby amenities…
Taxation est. · year 1
- Rental income
- $52,212
- − Mortgage interest
- −$21,846
- − Property taxes
- −$5,146
- − Insurance
- −$1,950
- − Repairs & maintenance
- −$4,177
- − Management
- −$4,177
- − Depreciation
- −$11,345
- Taxable income
- $3,571
- Est. tax owed @ 24.0%
- −$857
- After-tax cash flow
- $8,752/yr
For passive investors: Depreciation is non-cash, so a rental often shows a tax loss while cash-flowing — sheltering income. Rental losses are passive: they offset passive income freely, and up to $25,000/yr can offset ordinary (W-2) income if you actively participate and your MAGI is under $100k (phasing out to $0 by $150k); unused losses carry forward. On sale, claimed depreciation is recaptured at up to 25%, and gains may owe capital-gains tax (a 1031 exchange can defer both). Figures are a year-1 estimate at your 24.0% rate — not tax advice; consult a CPA.
Schools (NCES district)
- District
- New Haven School District
- NCES district ID
- 0902790
- Math proficiency
- 12% ▼ -10.00%
- Reading proficiency
- 25% ▼ -10.00%
- Median HH income
- $38,058
- Composite
- 15.48/100
- National rank
- #9308
- State rank
- #147 of 153 in CT
Livability — New Haven
- Score
- 79/100
- State rank
- #31
- US rank
- #2190
Category grades
Schools grade is shown separately in the Schools card above.
Census & demographics
- Census place
- New Haven, CT
- County
- New Haven County · 688,236 people
- City population
- 132,813
- Metro
- New Haven-Milford, CT
- Population (ZIP)
- 38,888
- Household income
- $48,500
- Rent vs Own
- Severe rent burden
- 2664.0
Population outlook (South Central Connecticut County) Hauer SSP2
- By 2040
- 608,362
Race, ethnicity, and origin ACS 2023
- Neighborhood character
- Diverse neighborhood (Simpson 0.66)
- Race & ethnicity
- Hispanic / Latino 47% White 26% Black 22% Two or more races 12% Asian 1%
- Hispanic origin (detail)
- Mexican 7% Puerto Rican 25% Dominican 2%
- Common ancestry
- Romanian 2% Lithuanian 1% Slovak 1%
- Foreign-born
- 17% · Canada, Jamaica, South Korea
- Languages at home
- 56% English-only · Spanish 39% Other Indo-European 1% Russian/Polish/Slavic 1%
Political lean MEDSL · South Central Connecticut
- 2024 margin
- Strong D (+20.1) · D 59.0% · R 38.9% · Other 2.1%
- All cycles
- 2024: D+20.1
Not yet ingested
- Civics
- —
Market trends
- HPI YoY
- ▼ -30.87%
- Current HPI
- 364.006
- Rent YoY
- ▲ 4.12%
- Metro
- New Haven-Milford, CT
- State GDP YoY
- ▲ 1.06%
- F500 in state
- 38
Industry mix (Fortune 500 HQ in CT)
| Industry | F500 HQs | Revenue |
|---|---|---|
| Industrial Machinery | 4 | $38B |
|
||
| Insurance | 3 | $71B |
|
||
| Financial Services | 2 | $25B |
|
||
| Transportation / Logistics | 2 | $18B |
|
||
| Healthcare | 1 | $247B |
|
||
| Telecommunications | 1 | $55B |
|
||
Price history
+353.5% since first listed10 events — show timeline
- 2026-03-26 Pending — Smart MLS
- 2026-03-17 Listed $390,000 Smart MLS
- 2013-11-15 Sold (MLS) $75,000 Smart MLS
- 2013-10-18 Listed $64,900 Smart MLS
- 2008-04-30 Sold (MLS) $95,000 Smart MLS
- 2008-01-31 Listing Removed — Smart MLS
- 2008-01-11 Listed $114,900 Smart MLS
- 2007-01-31 Listed $189,900 Smart MLS
- 2005-05-26 Sold (Public Records) $151,000 Public Records
- 2002-06-19 Sold (Public Records) $86,000 Public Records
Property tax history
+6.0%/yrLatest (2023): $5,146 · -6.4% YoY. Source: county tax records.
Cash-flow waterfall
monthlySold comps — $/sqft
last 12 mo · ≤1 miLoading sold comps…