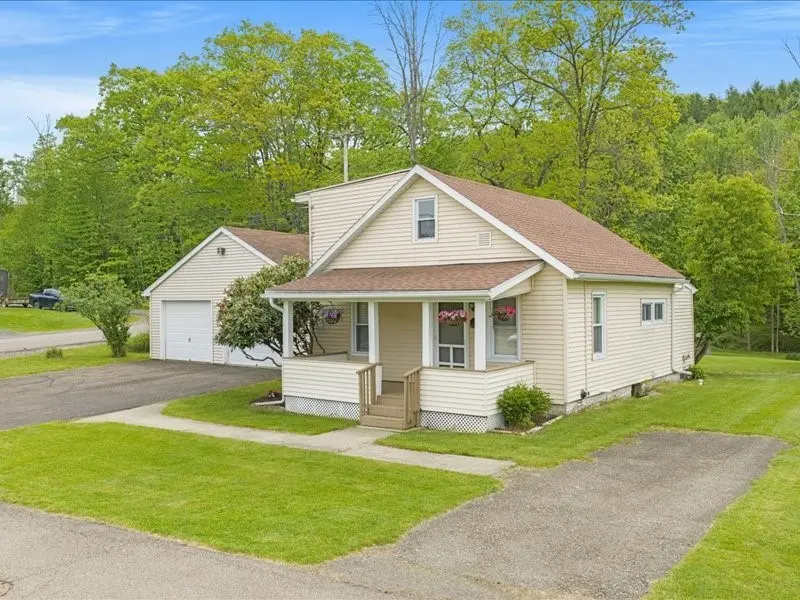
3486 Everline St · Binghamton, NY
Flood risk 1/10 · Minimal
- FEMA flood zone
- X
- Chance of flooding over 30 yrs
- 0.0%
- Est. flood insurance / yr
- $473 – $860
Fire risk 2/10 · Minimal
- Est. fire insurance / yr
- $691 – $1,283
Heat risk 2/10 · Minimal
- Hot days now (above 92°F)
- 7 days/yr
- Hot days in 30 yrs
- 15 days/yr
Wind risk 2/10 · Minimal
- Chance of severe wind over 30 yrs
- 2.0%
Air-quality risk 2/10 · Minimal
- Unhealthy air days now
- 0 days/yr
- Unhealthy air days in 30 yrs
- 1 days/yr
Risk factors via First Street. Map © Google.
Why this score? — see what drove the C- grade
The composite is a weighted blend of 9 inputs, each scored 0–100. Each bar is that input's sub-score; the figure is the points it added to the 100-point composite (weight × sub-score).
- Cash flow +14.0/30.0
- Appreciation +10.0/10.0
- Schools +4.6/10.0
- 1% rule +4.5/10.0
- DSCR +4.2/10.0
- ARV discount +3.9/15.0
- Livability +3.9/5.0
- Rent growth +2.5/5.0
- Condition / age +2.5/5.0
$155,900
🖨 Deal sheet 📄 Offer letter ✓ Due diligence
Listing remarks
Welcome home to this charming and inviting property offering the perfect combination of comfort, convenience, and a peaceful country-like setting just outside the city limits in the highly desirable SV School District. The open floor plan offers the convenience of first-floor living with a bedroom, full bath, and laundry all located on the main level—perfect for avoiding steps. An additional 2 bedrooms are located upstairs. Situated on a picturesque park-like setting of over 1/3 acre, the property offers privacy, mature landscaping, and plenty of outdoor space to enjoy. The custom-built oversized garage features insulated and plywood-finished walls, providing excellent space for vehic
Key facts
- Park like setting
- First floor living
- Custom built garage
Tags
Property features AI
Exterior
- Parking: Detached oversized garage with garage door opener (2 car)
- Utilities: Public water; Public sewer; Cable available
- Home design: Single-family residence; Residential property
- Construction: Vinyl siding
- Exterior features: Garden; Enclosed porch; Porch; Shed(s)
Interior
- Kitchen: Range; Free-standing range; Dishwasher; Refrigerator; Gas water heater
- Flooring: Carpet; Tile; Vinyl
- Bathrooms: 1 full bathroom
- Heating & cooling: Forced air heating
- Interior features: Insulated windows; Basement
- Laundry & utility: Washer hookup
Neighborhood map
What this means for you Summary
Snapshot
- This is a 3-bed/1.0-bath single-family listed at $156k.
Deal economics
- At list price, monthly cash flow is $19 ($226/yr) — positive.
- The deal already cash-flows at list — no discount required.
- To meet the 1% rule (rent ≥ 1% of price), the offer needs to be $148k (4.9% below list).
- Recommended offer: $148k (4.9% below list) — sets the bar for 1% rule.
Location & tenants
- Location reads 78/100 on livability (#174 in NY, #2,710 nationally) — a middle-class / working-renter tenant base. Strengths: amenities A+, commute A+, cost of living A+; Watch: crime F, employment F.
- Susquehanna Valley Central School District (rural): math 48% / reading 57% proficiency, ranked #330 of 590 in NY (top 56%) — acceptable for families but not a draw, mixed tenant base, ~2y average lease.
- Zoned schools: Brookside Elementary School (math 47% / reading 57%, grade C-, #988 of 2,108 statewide, top 49%, 386 students, 45% FRL).
- Market conditions: 112 active listings in the ZIP; 2 comparable units currently listed for rent nearby; 340 units permitted in Broome County in 2024 (269 in 5+ unit buildings).
Forward outlook
- In year one you build about $17k of equity ($1k loan paydown + $16k appreciation (10.0% local appreciation)).
- Broome County population projected at -13% by 2050 — secular population decline; favor cash flow + early exit over multi-decade hold.
- At projected returns (10.0% appreciation + 3.0% rent growth), your $44k cash investment doubles in ~3 years — after that, you're playing with house money.
- By year 3, paydown + projected appreciation supports a ~$42k cash-out refi (75% LTV) — recoverable capital for the next deal without selling this one.
Negotiation context
- It's been on market 15 days — a 2% lower offer ($154k) is reasonable based on typical stale-listing flexibility.
Risks & watch-outs
- Watch-outs: built in 1935 — expect roof / HVAC / electrical / plumbing capex.
Questions for the listing agent
- Built in 1935 — when were the roof, HVAC, electrical panel, plumbing, and water heater last replaced?
- Is there a deadline driving the sale (1031 exchange, divorce, estate, relocation)? That informs how much negotiation room exists.
- Schools are D-rated, which usually means shorter tenancies and higher turnover. Who's the typical renter profile here, and what's been the actual vacancy rate?
- Crime grade is F in this area — have there been break-ins, vandalism, or insurance claims at this property in the last 3 years? What carrier currently insures it and at what premium?
- What's the average days-on-market for RENTAL listings here right now (not sales)? A rising rental-DOM trend means longer vacancies and softer asking-rent achievability than the comps imply.
- What's the recent tenant-quality profile in this submarket — average credit score on applications, eviction rate, late-payment / NSF rate, and stable-employment percentage? A property-management company in the area should have these aggregated.
- How much new for-sale + rental construction is in the pipeline within 1–3 miles? Heavy new supply typically softens prices + rents 12–24 months out; constrained supply supports both.
Investment metrics
- 1% rule
- 0.95% ✗
- Cap rate
- 6.44%
- Cash-on-cash
- 0.52%
- DSCR
- 1.02
- GRM
- 8.8
CMA / ARV
- ARV (on-the-fly)
- $144,301
- Comps found
- 6
Show comp detail 6 sales within ~0.75 mi
| Address | Dist | Beds/Ba | Sqft | Sold | Price | $/sf | Match |
|---|---|---|---|---|---|---|---|
| 3492 Margery St | 0.26mi | 3/1.5 | 1,400 (+10%) | 13mo | $240,000 | $171 | 59 |
| 28 Bayless Ave | 0.50mi | 4/1.0 (+1) | 1,396 (+9%) | 1mo | $23,275 | $17 | 55 |
| 158 Park Ave | 0.66mi | 3/1.5 | 1,352 (+6%) | 6mo | $85,000 | $63 | 52 |
| 3566 Parkway St | 0.44mi | 2/1.0 (-1) | 1,176 (-8%) | 20mo | $98,000 | $83 | 45 |
| 144 Park Ave | 0.72mi | 3/1.5 | 1,420 (+11%) | 11mo | $177,000 | $125 | 37 |
| 9 Woodland Ave | 0.74mi | 2/1.0 (-1) | 1,426 (+12%) | 15mo | $161,000 | $113 | 29 |
Match score weights: distance 35% · size 25% · config 20% · recency 20%. Top-matched comps best support the ARV.
Projected returns pro-forma
10.0% appreciation · 3.0% rent growth · sell at horizon
- IRR
- 24.7%
- Equity multiple
- 2.97×
- Total profit
- $86,174
- Equity at exit
- $140,447
- IRR
- 21.8%
- Equity multiple
- 6.79×
- Total profit
- $252,961
- Equity at exit
- $302,879
Cash invested: $43,652 (down + closing). Projections, not guarantees.
Landlord ↔ Tenant lean methodology
- Overall (STATE)
- 15 Strongly Tenant-Friendly
- State New York
- 15 Strongly Tenant-Friendly · D+10
- County
- — inherits STATE
- City
- — inherits STATE
ZIP-level market 13903
- Home prices YoY
- 4.3%
- Active inventory
- 112
- Price-to-rent
- 8.8×
Monthly cashflow live
- Estimated rent
- $1,482 medium interval (Pro) →
- Mortgage (P&I)
- −$818
- Tax from tax record
- −$269 /mo · $3,232/yr
- Insurance
- −$65
- HOA
- −$0
- Vacancy / Maint / Mgmt
- −$311
- Net cashflow
- $19
Break-even live
UW: 25.0% down · 7.5% · 30yr · 1.5% tax · 5.0% vac · 8.0% maint · 8.0% mgmt
Financing live
Cash to close
- Down payment
- $38,975
- Closing costs
- $4,677
- Reserves months
- —
- Total cash needed
- —
Loan-product check · same deal, 3 products live
Conventional
25% down · 7.5% · 30yr
- Down + closing
- —
- Monthly P&I
- —
- Monthly cashflow
- —
- DSCR
- —
- Eligible?
- —
Personal DTI + credit; lowest rate.
DSCR
20% down · 8.5% · 30yr
- Down + closing
- —
- Monthly P&I
- —
- Monthly cashflow
- —
- DSCR
- —
- Eligible?
- —
No personal income docs; deal must DSCR.
Hard money
10% down · 12.0% · 12mo
- Down + closing
- —
- Monthly P&I
- —
- Monthly cashflow
- —
- DSCR
- —
- Eligible?
- —
Short-term bridge; refi at stabilization.
Rent comps 2 comps
| Address | Beds | Baths | Sqft | Rent | $/sqft | DOM | Units | Dist |
|---|---|---|---|---|---|---|---|---|
| 31 Indiana St Binghamton, NY | 3.0 | 1.5 | 1232 | $1,500 | $1.22 | 43d | 1 | 0.85mi |
| 71 Mary St Unit 2 Binghamton, NY | 2.0 | 1.0 | 1100 | $1,300 | $1.18 | 13d | 1 | 1.34mi |
Listing history 8 events
-
2026-06-08status $155,900 Pending 15 DOM
-
2026-06-07days on market $155,900 Active 15 DOM
-
2026-06-05days on market $155,900 Active 12 DOM
-
2026-06-02days on market $155,900 Active 10 DOM
-
2026-06-01days on market $155,900 Active 9 DOM
-
2026-05-31days on market $155,900 Active 8 DOM
-
2026-05-30days on market $155,900 Active 7 DOM
-
2026-05-23$155,900 Active
ⓘ Source: listings_history table (triggers on properties + properties_extension) + one-shot
backfill from property_details.listing_events for pre-trigger history.
Tax reassessment forecast NY · Partial reset (capped growth)
- Current annual tax
- $3,232 · $269/mo
- Projected year-2 tax
- $3,232 · $269/mo
- Expected delta
- $0/yr ($0/mo · 0.0%)
ⓘ Screening estimate from a state-policy table — verify with the county assessor before closing.
Climate risk First Street
- Flood 1/10 Low FEMA zone X · 0% chance over 30 yrs
- Wildfire 2/10 Low
- Heat 2/10 Low 7 d/yr ≥92°F today · 15 d/yr by 30 yrs out
- Wind 2/10 Low 2% chance of damaging wind over 30 yrs
- Air quality 2/10 Low 0 unhealthy d/yr today · 1 by 30 yrs out
Nearby sold comps map
Loading sold comps map…
Walkable amenities ~0.75 mi
Loading nearby amenities…
Taxation est. · year 1
- Rental income
- $17,783
- − Mortgage interest
- −$8,733
- − Property taxes
- −$3,232
- − Insurance
- −$780
- − Repairs & maintenance
- −$1,423
- − Management
- −$1,423
- − Depreciation
- −$4,535
- Taxable loss
- −$2,342
- Est. tax savings @ 24.0%
- +$562
- After-tax cash flow
- $788/yr
For passive investors: Depreciation is non-cash, so a rental often shows a tax loss while cash-flowing — sheltering income. Rental losses are passive: they offset passive income freely, and up to $25,000/yr can offset ordinary (W-2) income if you actively participate and your MAGI is under $100k (phasing out to $0 by $150k); unused losses carry forward. On sale, claimed depreciation is recaptured at up to 25%, and gains may owe capital-gains tax (a 1031 exchange can defer both). Figures are a year-1 estimate at your 24.0% rate — not tax advice; consult a CPA.
Schools (NCES district)
- District
- Susquehanna Valley Central School District
- NCES district ID
- 3628380
- Math proficiency
- 48% ▼ -9.00%
- Reading proficiency
- 57% ▲ 1.00%
- Median HH income
- $57,681
- Composite
- 45.56/100
- National rank
- #2599
- State rank
- #330 of 590 in NY
Livability — Binghamton
- Score
- 78/100
- State rank
- #174
- US rank
- #2710
Category grades
Schools grade is shown separately in the Schools card above.
Census & demographics
- County
- Broome County · 126,805 people
- City population
- 65,170
- Metro
- Binghamton, NY
- Population (ZIP)
- 17,569
- Household income
- $66,278
- Rent vs Own
- Severe rent burden
- 602.0
Population outlook (Broome County) Hauer SSP2
- Today (2025)
- 187,989 people
- By 2030
- 183,066 · -2.6%
- By 2040
- 172,228 · -8.4%
- By 2050
- 163,161 · -13.2%
- By 2075
- 153,641 · -18.3%
- By 2100
- 140,851 · -25.1%
Race, ethnicity, and origin ACS 2023
- Neighborhood character
- Predominantly White (80%)
- Race & ethnicity
- White 80% Black 9% Two or more races 6% Hispanic / Latino 4% Asian 1%
- Common ancestry
- Romanian 6% Slovak 2% Scotch-Irish 2%
- Foreign-born
- 5% · Canada
- Languages at home
- 94% English-only · Spanish 2% Other Indo-European 1% Arabic 1%
Political lean MEDSL · Broome
- 2024 margin
- Toss-up / Even · D 50.2% · R 49.8%
- 2008→2024 swing
- -7.6pp toward R · 2008: 8.0pp · 2024: 0.4pp
- All cycles
- 2024: D+0.4 2020: D+3.5 2016: R+3.7 2012: D+4.6 2008: D+8.0
Not yet ingested
- Civics
- —
Market trends
- HPI YoY
- ▲ 11.68%
- Current HPI
- 286.1001
- Rent YoY
- —
- Metro
- Binghamton, NY
- State GDP YoY
- ▲ 2.60%
- F500 in state
- 92
Industry mix (Fortune 500 HQ in NY)
| Industry | F500 HQs | Revenue |
|---|---|---|
| Financial Services | 10 | $950B |
|
||
| Consumer Goods | 9 | $162B |
|
||
| Insurance | 4 | $225B |
|
||
| Telecommunications | 2 | $144B |
|
||
| Pharmaceuticals | 2 | $112B |
|
||
| Media / Entertainment | 2 | $69B |
|
||
Price history
1 event — show timeline
- 2026-05-23 Listed $155,900 GBAOR
Property tax history
+10.2%/yrLatest (2025): $3,232 · +1.3% YoY. Source: county tax records.
Cash-flow waterfall
monthlySold comps — $/sqft
last 12 mo · ≤1 miLoading sold comps…