 Fourplex
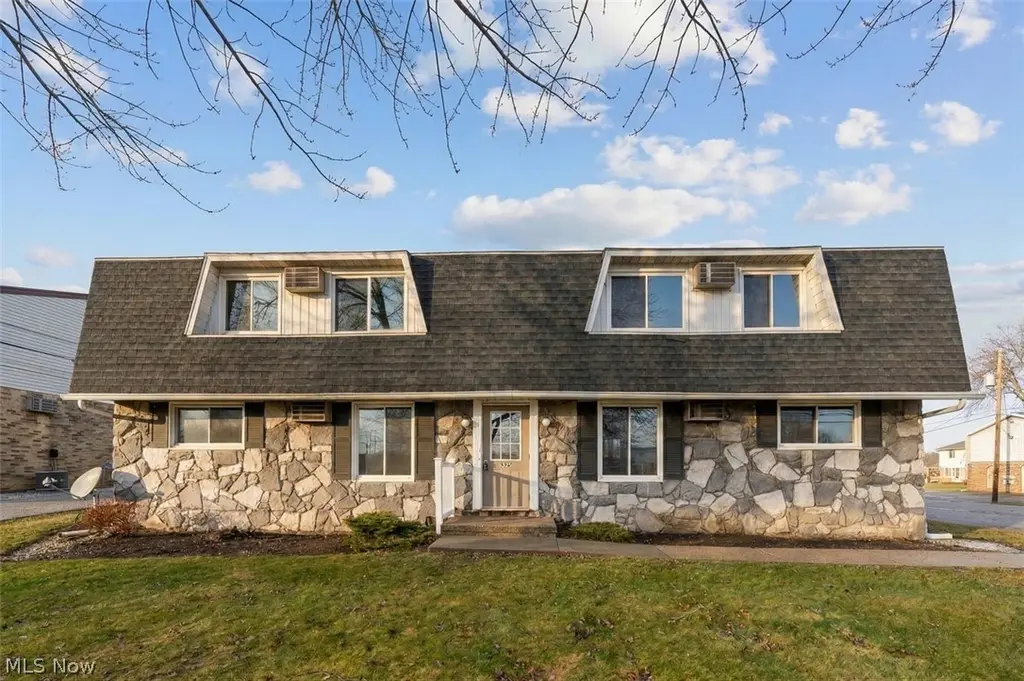
325 Noble St W · East Canton, OH
Flood risk 1/10 · Minimal
- FEMA flood zone
- X (unshaded)
- Chance of flooding over 30 yrs
- 0.0%
- Est. flood insurance / yr
- $507 – $1,088
Fire risk 1/10 · Minimal
- Est. fire insurance / yr
- $713 – $1,323
Heat risk 3/10 · Minor
- Hot days now (above 96°F)
- 7 days/yr
- Hot days in 30 yrs
- 18 days/yr
Wind risk 1/10 · Minimal
- Chance of severe wind over 30 yrs
- —
Air-quality risk 2/10 · Minimal
- Unhealthy air days now
- 1 days/yr
- Unhealthy air days in 30 yrs
- 2 days/yr
Risk factors via First Street. Map © Google.
Why this score? — see what drove the C grade
The composite is a weighted blend of 9 inputs, each scored 0–100. Each bar is that input's sub-score; the figure is the points it added to the 100-point composite (weight × sub-score).
- Cash flow +22.5/30.0
- ARV discount +7.5/15.0
- DSCR +7.2/10.0
- 1% rule +5.9/10.0
- Schools +4.9/10.0
- Livability +3.7/5.0
- Rent growth +2.5/5.0
- Condition / age +2.5/5.0
- Appreciation +0.0/10.0
$389,000
🖨 Deal sheet (PDF) 📄 Offer letter ✓ Due diligence
Multi-family units
County records classify this as Multi-Family (5+ Unit). Listing-text estimate: 4 units. estimate disagrees with records
5+ unit building — per-unit beds/baths from public records are typically unavailable; the breakdown below (if shown) is an estimate from the listing text.
Listing remarks MLS
Fully rented 4 Unit with 1 bedroom units with sliders to deck/patio. Plenty of parking. Super convenient to parks, schools, and shopping!
Key facts
- Bedroom units
- Plenty of parking
- Sliders to deck
Tags
Neighborhood map
What this means for you Summary
Snapshot
- This is a 4 × 1-bed/1.0-bath units multifamily listed at $389k.
Deal economics
- At list price, monthly cash flow is $653 ($8k/yr) — positive. Per door: $163/mo.
- The deal already cash-flows at list — no discount required.
- Meets the 1% rule at list price ($4k rent vs $389k).
- Recommended offer: $377k (3.0% below list) — sets the bar for market timing.
Location & tenants
- Location reads 74/100 on livability (#270 in OH, #4,413 nationally) — a middle-class / working-renter tenant base. Strengths: crime A+, cost of living A+, housing A+; Watch: amenities F, commute F, health & safety F.
- Osnaburg Local (suburban): math 57% / reading 58% proficiency, ranked #327 of 656 in OH (top 50%) — acceptable for families but not a draw, mixed tenant base, ~2y average lease.
- Market conditions: 20 active listings in the ZIP; 528 units permitted in Stark County in 2024 (84 in 5+ unit buildings).
- At $4,229/mo this rent would consume 72% of the median local household income ($70k/yr) — very limited rent-growth headroom before tenants either downsize or default.
Forward outlook
- Local home prices are declining (-3.0%/yr); year-one equity from $3k of loan paydown is wiped out by about $12k of value loss. Plan a longer hold.
- Stark County population projected to shrink 8% by 2050 — rents likely to lag national; underwrite the cash flow, not the appreciation.
Negotiation context
- It's been on market 59 days — a 3% lower offer ($377k) is reasonable based on typical stale-listing flexibility.
Questions for the listing agent
- It's been on market 59 days. Have you received any prior offers? Is the seller open to a 3% concession, seller financing, or rate buy-down credit?
- Can we see the unit-by-unit rent roll, current vacancy, and any below-market leases? What's the average tenancy length?
- What capital expenditures (roof, boiler, parking lot, exteriors) have been made in the last 5 years, and what's planned in the next 2?
- Built in 1975 — when were the roof, HVAC, electrical panel, plumbing, and water heater last replaced?
- Is there a deadline driving the sale (1031 exchange, divorce, estate, relocation)? That informs how much negotiation room exists.
- Schools are B-rated — typically a magnet for longer-tenancy family renters. What's the average tenant stay here, and is there a school-zone premium baked into asking?
- What's the average days-on-market for RENTAL listings here right now (not sales)? A rising rental-DOM trend means longer vacancies and softer asking-rent achievability than the comps imply.
- What's the recent tenant-quality profile in this submarket — average credit score on applications, eviction rate, late-payment / NSF rate, and stable-employment percentage? A property-management company in the area should have these aggregated.
- How much new apartment / multifamily construction is in the pipeline within 1–3 miles? Heavy new supply (>2% of stock underway) typically softens rents 12–24 months out; light construction supports rent growth.
Investment metrics
- 1% rule
- 1.09% ✓
- Cap rate
- 8.31%
- Cash-on-cash
- 7.19%
- DSCR
- 1.32
- GRM
- 7.7
CMA / ARV
- ARV (median comp)
- $259,091
- List price
- $389,000
- Delta
- 50.14%
- Verdict
- OVERPRICED
- Comps
- 7 within 1.0 mi
Projected returns pro-forma
-3.0% appreciation · 3.0% rent growth · sell at horizon
- IRR
- -5.3%
- Equity multiple
- 0.80×
- Total profit
- $-21,405
- Equity at exit
- $58,001
- IRR
- 4.4%
- Equity multiple
- 1.32×
- Total profit
- $35,142
- Equity at exit
- $33,634
Cash invested: $108,920 (down + closing). Projections, not guarantees.
Landlord ↔ Tenant lean methodology
- Overall (STATE)
- 73 Landlord-Friendly
- State Ohio
- 73 Landlord-Friendly · R+6
- County
- — inherits STATE
- City
- — inherits STATE
ZIP-level market 44730
- Active inventory
- 20
- Price-to-rent
- 30.7×
Monthly cashflow live
- Estimated rent
- $4,229 medium interval (Pro) →
- Mortgage (P&I)
- −$2,040
- Tax est. 1.5%
- −$486 /mo · $5,835/yr
- Insurance
- −$162
- HOA
- −$0
- Vacancy / Maint / Mgmt
- −$888
- Net cashflow
- $653
Break-even live
Sensitivity live
| Price | -10% $921 | -5% $787 | +0% $653 | +5% $518 | +10% $384 |
|---|---|---|---|---|---|
| Rent | -10% $319 | -5% $486 | +0% $653 | +5% $820 | +10% $987 |
| Rate | -1.0pp $849 | -0.5pp $752 | base $653 | +0.5pp $552 | +1.0pp $449 |
4-unit breakdown (identical units grouped — click to expand)
| Units | Beds | Baths | Est. rent |
|---|---|---|---|
| 4× units | 1 | 1 | $4,228 |
| #1 | 1 | 1 | $1,057 |
| #2 | 1 | 1 | $1,057 |
| #3 | 1 | 1 | $1,057 |
| #4 | 1 | 1 | $1,057 |
| Total (4 units) | $4,229 | ||
UW: 25.0% down · 7.5% · 30yr · 1.5% tax · 5.0% vac · 8.0% maint · 8.0% mgmt
Financing live
Cash to close
- Down payment
- $97,250
- Closing costs
- $11,670
- Reserves months
- —
- Total cash needed
- —
Loan-product check · same deal, 3 products live
Conventional
25% down · 7.5% · 30yr
- Down + closing
- —
- Monthly P&I
- —
- Monthly cashflow
- —
- DSCR
- —
- Eligible?
- —
Personal DTI + credit; lowest rate.
DSCR
20% down · 8.5% · 30yr
- Down + closing
- —
- Monthly P&I
- —
- Monthly cashflow
- —
- DSCR
- —
- Eligible?
- —
No personal income docs; deal must DSCR.
Hard money
10% down · 12.0% · 12mo
- Down + closing
- —
- Monthly P&I
- —
- Monthly cashflow
- —
- DSCR
- —
- Eligible?
- —
Short-term bridge; refi at stabilization.
Listing history 18 events
-
2026-06-18days on market $389,000 Active 59 DOM
-
2026-06-17days on market $389,000 Active 58 DOM
-
2026-06-16days on market $389,000 Active 57 DOM
-
2026-06-15days on market $389,000 Active 56 DOM
-
2026-06-14days on market $389,000 Active 54 DOM
-
2026-06-13days on market $389,000 Active 53 DOM
-
2026-06-10days on market $389,000 Active 51 DOM
-
2026-06-09days on market $389,000 Active 50 DOM
-
2026-06-08days on market $389,000 Active 49 DOM
-
2026-06-07days on market $389,000 Active 48 DOM
-
2026-06-03days on market $389,000 Active 44 DOM
-
2026-06-02days on market $389,000 Active 43 DOM
-
2026-06-01days on market $389,000 Active 42 DOM
-
2026-05-31days on market $389,000 Active 41 DOM
-
2026-05-30days on market $389,000 Active 40 DOM
-
2026-04-20$389,000 Active 137-char remark
Show marketing remark (137 chars)
Fully rented 4 Unit with 1 bedroom units with sliders to deck/patio. Plenty of parking. Super convenient to parks, schools, and shopping!
-
2022-11-03soldstatus $7,030,000
-
2012-12-11soldstatus $14,000
ⓘ Source: listings_history table (triggers on properties + properties_extension) + one-shot
backfill from property_details.listing_events for pre-trigger history.
Climate risk First Street
- Flood 1/10 Low FEMA zone X (unshaded) · 0% chance over 30 yrs
- Wildfire 1/10 Low
- Heat 3/10 Moderate 7 d/yr ≥96°F today · 18 d/yr by 30 yrs out
- Wind 1/10 Low
- Air quality 2/10 Low 1 unhealthy d/yr today · 2 by 30 yrs out
Nearby sold comps map
Loading sold comps map…
Walkable amenities ~0.75 mi
Loading nearby amenities…
Taxation est. · year 1
- Rental income
- $50,748
- − Mortgage interest
- −$21,790
- − Property taxes
- −$5,835
- − Insurance
- −$1,945
- − Repairs & maintenance
- −$4,060
- − Management
- −$4,060
- − Depreciation
- −$11,316
- Taxable income
- $1,742
- Est. tax owed @ 24.0%
- −$418
- After-tax cash flow
- $7,413/yr
For passive investors: Depreciation is non-cash, so a rental often shows a tax loss while cash-flowing — sheltering income. Rental losses are passive: they offset passive income freely, and up to $25,000/yr can offset ordinary (W-2) income if you actively participate and your MAGI is under $100k (phasing out to $0 by $150k); unused losses carry forward. On sale, claimed depreciation is recaptured at up to 25%, and gains may owe capital-gains tax (a 1031 exchange can defer both). Figures are a year-1 estimate at your 24.0% rate — not tax advice; consult a CPA.
Schools (NCES district)
- District
- Osnaburg Local
- NCES district ID
- 3904991
- Math proficiency
- 57% ▼ -11.00%
- Reading proficiency
- 58% ▼ -7.00%
- Median HH income
- $50,595
- Composite
- 49.06/100
- National rank
- #2058
- State rank
- #327 of 656 in OH
Livability — East Canton
- Score
- 74/100
- State rank
- #270
- US rank
- #4413
Category grades
Schools grade is shown separately in the Schools card above.
Census & demographics
- Census place
- East Canton, OH
- County
- Stark · 366,688 people
- Metro
- Canton-Massillon, OH
- Population (ZIP)
- 6,096
- Household income
- $70,344
- Rent vs Own
- Severe rent burden
- 10.9
Population outlook (Stark County) Hauer SSP2
- Today (2025)
- 373,708 people
- By 2030
- 371,245 · -0.7%
- By 2040
- 361,331 · -3.3%
- By 2050
- 345,290 · -7.6%
- By 2075
- 302,669 · -19.0%
- By 2100
- 238,870 · -36.1%
Race, ethnicity, and origin ACS 2023
- Neighborhood character
- Predominantly White (93%)
- Race & ethnicity
- White 93% Hispanic / Latino 3% Black 3% Two or more races 2%
- Common ancestry
- Italian 9% Romanian 4% Lithuanian 2%
- Foreign-born
- 0%
Political lean MEDSL · Stark
- 2024 margin
- Strong R (+21.9) · D 38.6% · R 60.5%
- 2008→2024 swing
- -27.4pp toward R · 2008: 5.5pp · 2024: -21.9pp
- All cycles
- 2024: R+21.9 2020: R+18.5 2016: R+17.4 2012: R+0.4 2008: D+5.5
Not yet ingested
- Civics
- —
Market trends
- HPI YoY
- ▼ -179.76%
- Current HPI
- 248.9546
- Rent YoY
- —
- Metro
- —
- State GDP YoY
- ▲ 1.98%
- F500 in state
- 48
Industry mix (Fortune 500 HQ in OH)
| Industry | F500 HQs | Revenue |
|---|---|---|
| Insurance | 3 | $145B |
|
||
| Industrial Machinery | 3 | $49B |
|
||
| Financial Services | 3 | $24B |
|
||
| Consumer Goods | 2 | $93B |
|
||
| Aerospace / Defense | 2 | $47B |
|
||
| Utilities | 2 | $33B |
|
||
Price history
+2678.6% since first listed3 events — show timeline
- 2026-04-20 Listed $389,000 MLSNOW
- 2022-11-03 Sold (Public Records) $7,030,000 Public Records
- 2012-12-11 Sold (Public Records) $14,000 Public Records
Property tax history
-20.5%/yrLatest (2024): $185 · -86.8% YoY. Source: county tax records.
Cash-flow waterfall
monthlySold comps — $/sqft
last 12 mo · ≤1 miLoading sold comps…