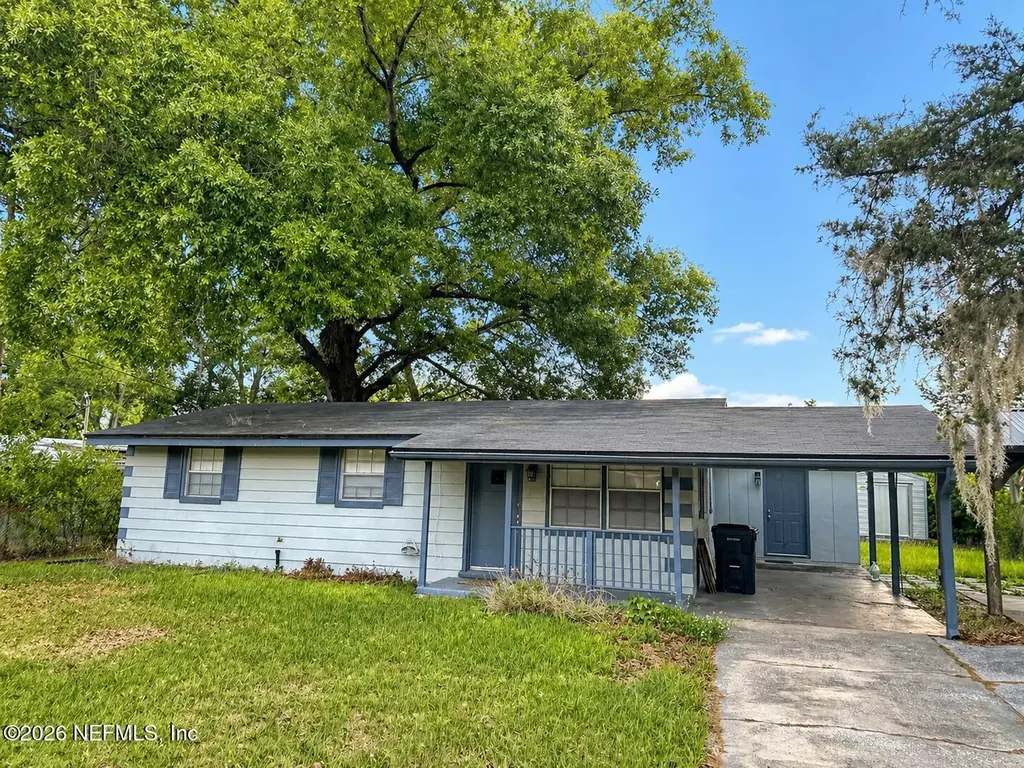
411 Brighton Ave · Bellair-Meadowbrook Terrace, FL
Flood risk 1/10 · Minimal
- FEMA flood zone
- X (unshaded)
- Chance of flooding over 30 yrs
- 0.0%
- Est. flood insurance / yr
- $507 – $1,088
Fire risk 3/10 · Minor
- Est. fire insurance / yr
- $947 – $1,759
Heat risk 9/10 · Severe
- Hot days now (above 107°F)
- 7 days/yr
- Hot days in 30 yrs
- 20 days/yr
Wind risk 10/10 · Severe
- Chance of severe wind over 30 yrs
- 99.0%
Air-quality risk 3/10 · Minor
- Unhealthy air days now
- 3 days/yr
- Unhealthy air days in 30 yrs
- 3 days/yr
Risk factors via First Street. Map © Google.
Why this score? — see what drove the C- grade
The composite is a weighted blend of 9 inputs, each scored 0–100. Each bar is that input's sub-score; the figure is the points it added to the 100-point composite (weight × sub-score).
- Cash flow +15.2/30.0
- ARV discount +15.0/15.0
- Schools +5.1/10.0
- DSCR +4.7/10.0
- 1% rule +4.0/10.0
- Livability +2.5/5.0
- Condition / age +2.5/5.0
- Rent growth +2.3/5.0
- Appreciation +0.0/10.0
$145,000
🖨 Deal sheet (PDF) 📄 Offer letter ✓ Due diligence
Listing remarks
INVESTOR SPECIAL - This solid 3-bedroom, 1-bath concrete block home offering 1,196 sq ft of potential in the established Meadowbrook neighborhood. Built in 1962, this property already features key updates including a 2015 roof, 2024 AC, and 2024 water heater, along with city water and sewer. Outside, you'll find a detached shed and a covered pergola with power next to the carport -perfect for added functionality or entertaining. With some remodeling needed, you have the flexibility to update finishes or reimagine the layout to match your vision. Blind offers or assignable contracts will not be considered. 0 day inspection period preferred.
Key facts
- 2015 roof
- 2024 water heater
- City water
Tags
Property features AI
Finance
- HOA & community: Not a senior community
Exterior
- Parking: Attached carport (1 space)
- Utilities: Public sewer; Sewer connected; Water connected
- Home design: Single-family residence; One story
- Construction: Block construction; Shingle roof
- Exterior features: Covered front porch; Porch; Chain-link fencing
Interior
- Kitchen: Electric oven
- Bedrooms: 3 bedrooms
- Flooring: Carpet; Laminate
- Bathrooms: 1 full bathroom
- Heating & cooling: Central heating; Central air conditioning
- Interior features: Carpet and laminate flooring; Electric oven
Neighborhood map
What this means for you Summary
Snapshot
- This is a 2-bed/1.0-bath single-family listed at $145k.
Deal economics
- At list price, monthly cash flow is $51 ($613/yr) — positive.
- The deal already cash-flows at list — no discount required.
- To meet the 1% rule (rent ≥ 1% of price), the offer needs to be $131k (9.7% below list).
- Recommended offer: $131k (9.7% below list) — sets the bar for 1% rule.
- Cap rate 6.7% vs local median 4.3% in Bellair-Meadowbrook Terrace — top-decile yield for the area; either an underpriced asset or a hidden risk that comps aren't pricing in. Stress-test before assuming the spread holds.
Location & tenants
- Location reads: area grade C — affects rentability + tenant quality, not the cash-flow math above.
- Clay (suburban): math 58% / reading 59% proficiency, ranked #14 of 73 in FL (top 19%) — acceptable for families but not a draw, mixed tenant base, ~2y average lease.
- Zoned schools: W E Cherry Elementary School (math 58% / reading 57%, grade C+, #764 of 2,144 statewide, top 36%, 641 students, 100% FRL); Orange Park Junior High School (math 38% / reading 45%, grade F, #348 of 571 statewide, top 62%, 744 students, 100% FRL); Orange Park High School (math 30% / reading 47%, grade F, #321 of 667 statewide, top 49%, 1,810 students, 100% FRL) — zoned schools average 100% FRL vs 35% district-wide (65 pts higher); higher-poverty schools than district average — tighter screening recommended.
- Zoned-school proficiency averages 46% at this address vs 58% district-wide (-13 pts) — the specific schools serving this property underperform the Clay average; the district grade overstates school quality for this exact location.
- Market conditions: Rents soft (-0.9%/yr); 260 active listings in the ZIP; 18 comparable units currently listed for rent nearby; rentals at typical pace (median 26d on market — plan ~3-4 weeks tenant-placement turnaround); solid renter incomes; 1,876 units permitted in Clay County in 2024 (14 in 5+ unit buildings).
Forward outlook
- Local home prices are declining (-3.0%/yr); year-one equity from $1k of loan paydown is wiped out by about $4k of value loss. Plan a longer hold.
- Clay County population projected at +19% by 2050 — long-run rental-demand tailwind backs the buy-and-hold thesis.
Negotiation context
- It's been on market 35 days — a 3% lower offer ($141k) is reasonable based on typical stale-listing flexibility.
- 2 sale attempts; this cycle's ask has dropped $25k (15%) from the opening price — seller is motivated, your offer sets the floor, not the list.
- Current owner paid $110k; 32% above their basis — modest negotiation headroom, anchor on the comps not their cost.
Risks & watch-outs
- Climate carrying-cost: severe wind risk, 99% chance of damaging wind over 30y; extreme-heat days projected 7→20/yr by 2055 (HVAC capex compounding) — expect insurance premiums to compound above CPI over the hold.
Questions for the listing agent
- It's been on market 35 days. Have you received any prior offers? Is the seller open to a 10% concession, seller financing, or rate buy-down credit?
- Built in 1962 — when were the roof, HVAC, electrical panel, plumbing, and water heater last replaced?
- Is there a deadline driving the sale (1031 exchange, divorce, estate, relocation)? That informs how much negotiation room exists.
- What's the average days-on-market for RENTAL listings here right now (not sales)? A rising rental-DOM trend means longer vacancies and softer asking-rent achievability than the comps imply.
- What's the recent tenant-quality profile in this submarket — average credit score on applications, eviction rate, late-payment / NSF rate, and stable-employment percentage? A property-management company in the area should have these aggregated.
- How much new for-sale + rental construction is in the pipeline within 1–3 miles? Heavy new supply typically softens prices + rents 12–24 months out; constrained supply supports both.
Investment metrics
- 1% rule
- 0.90% ✗
- Cap rate
- 6.72%
- Cash-on-cash
- 1.51%
- DSCR
- 1.07
- GRM
- 9.2
CMA / ARV
- ARV (on-the-fly)
- $192,672
- Comps found
- 12
Show comp detail 12 sales within ~0.75 mi
| Address | Dist | Beds/Ba | Sqft | Sold | Price | $/sf | Match |
|---|---|---|---|---|---|---|---|
| 215 Hilltop Dr | 0.40mi | 3/1.0 (+1) | 864 (0%) | 4mo | $125,000 | $145 | 73 |
| 502 Valderia Dr | 0.20mi | 3/1.5 (+1) | 920 (+6%) | 1mo | $198,000 | $215 | 72 |
| 184 Lyra St | 0.48mi | 3/1.5 (+1) | 864 (0%) | 2mo | $215,000 | $249 | 69 |
| 358 Woodside Dr | 0.29mi | 3/1.0 (+1) | 864 (0%) | 15mo | $187,000 | $216 | 69 |
| 443 W Clermont Dr | 0.09mi | 3/1.5 (+1) | 920 (+6%) | 17mo | $206,000 | $224 | 64 |
| 370 Woodside Dr | 0.33mi | 3/1.0 (+1) | 864 (0%) | 20mo | $165,000 | $191 | 63 |
| 350 Madeira Dr | 0.47mi | 3/1.0 (+1) | 864 (0%) | 13mo | $215,000 | $249 | 63 |
| 305 Glendening Rd | 0.58mi | 3/1.5 (+1) | 864 (0%) | 14mo | $195,000 | $226 | 54 |
| 314 Canis Dr S | 0.50mi | 3/1.5 (+1) | 864 (0%) | 20mo | $204,000 | $236 | 53 |
| 434 Blairmore Blvd W | 0.59mi | 3/1.5 (+1) | 954 (+10%) | 0mo | $175,000 | $183 | 48 |
| 345 Gwinnett Rd | 0.66mi | 3/2.0 (+1) | 864 (0%) | 20mo | $193,000 | $223 | 44 |
| 134 Hercules Dr E | 0.43mi | 2/1.5 | 960 (+11%) | 20mo | $199,500 | $208 | 42 |
Match score weights: distance 35% · size 25% · config 20% · recency 20%. Top-matched comps best support the ARV.
Projected returns pro-forma
-3.0% appreciation · 0.0% rent growth · sell at horizon
- IRR
- -17.3%
- Equity multiple
- 0.41×
- Total profit
- $-24,069
- Equity at exit
- $21,620
- IRR
- -16.0%
- Equity multiple
- 0.22×
- Total profit
- $-31,560
- Equity at exit
- $12,537
Cash invested: $40,600 (down + closing). Projections, not guarantees.
Landlord ↔ Tenant lean methodology
- Overall (STATE)
- 87 Strongly Landlord-Friendly
- State Florida
- 87 Strongly Landlord-Friendly · R+3
- County
- — inherits STATE
- City
- — inherits STATE
ZIP-level market 32073
- Rents YoY
- -0.9%
- Active inventory
- 260
- Price-to-rent
- 9.2×
Monthly cashflow live
- Estimated rent
- $1,309 high interval (Pro) →
- Mortgage (P&I)
- −$760
- Tax from tax record
- −$162 /mo · $1,947/yr
- Insurance
- −$60
- HOA
- −$0
- Vacancy / Maint / Mgmt
- −$275
- Net cashflow
- $51
Break-even live
Sensitivity live
| Price | -10% $133 | -5% $92 | +0% $51 | +5% $10 | +10% $-31 |
|---|---|---|---|---|---|
| Rent | -10% $-52 | -5% $-1 | +0% $51 | +5% $103 | +10% $155 |
| Rate | -1.0pp $124 | -0.5pp $88 | base $51 | +0.5pp $14 | +1.0pp $-25 |
UW: 25.0% down · 7.5% · 30yr · 1.5% tax · 5.0% vac · 8.0% maint · 8.0% mgmt
Financing live
Cash to close
- Down payment
- $36,250
- Closing costs
- $4,350
- Reserves months
- —
- Total cash needed
- —
Loan-product check · same deal, 3 products live
Conventional
25% down · 7.5% · 30yr
- Down + closing
- —
- Monthly P&I
- —
- Monthly cashflow
- —
- DSCR
- —
- Eligible?
- —
Personal DTI + credit; lowest rate.
DSCR
20% down · 8.5% · 30yr
- Down + closing
- —
- Monthly P&I
- —
- Monthly cashflow
- —
- DSCR
- —
- Eligible?
- —
No personal income docs; deal must DSCR.
Hard money
10% down · 12.0% · 12mo
- Down + closing
- —
- Monthly P&I
- —
- Monthly cashflow
- —
- DSCR
- —
- Eligible?
- —
Short-term bridge; refi at stabilization.
Rent comps 18 comps
| Address | Beds | Baths | Sqft | Rent | $/sqft | DOM | Units | Dist |
|---|---|---|---|---|---|---|---|---|
| 220 Woodside Dr Orange Park, FL | 3.0 | 1.0 | 1080 | $1,200 | $1.11 | 25d | 1 | 0.12mi |
| 295 Blairmore Blvd Orange Park, FL | 3.0 | 1.5 | 960 | $1,650 | $1.72 | 3d | 1 | 0.17mi |
| 342 Linden Ln Orange Park, FL | 2.0 | 1.0 | 891 | $1,200 | $1.35 | 25d | 1 | 0.19mi |
| 222 Blairmore Blvd Orange Park, FL | 2.0–3.0 | 1.0–2.0 | 1000 | $1,175 | $1.18 | 3d | 9 | 0.28mi |
| 198 Arora Blvd Orange Park, FL | 1.0–2.0 | 1.0–2.0 | 890 | $1,494 | $1.68 | 3d | 20 | 0.31mi |
| 482 Bentwood Ln Unit C Orange Park, FL | 2.0 | 1.5 | 920 | $995 | $1.08 | 14d | 1 | 0.53mi |
| 476 Lombard St Unit 2D Orange Park, FL | 2.0 | 1.5 | 960 | $1,195 | $1.24 | 25d | 1 | 0.59mi |
| 803 Meadowbrook Dr Unit C Orange Park, FL | 2.0 | 1.0 | 850 | $1,150 | $1.35 | 9d | 1 | 0.60mi |
| 470 Crabapple Ct Unit D Orange Park, FL | 2.0 | 1.5 | 920 | $1,175 | $1.28 | 16d | 1 | 0.60mi |
| 470 Crabapple Ct Unit D Orange Park, FL | 2.0 | 1.5 | 920 | $1,175 | $1.28 | 25d | 1 | 0.60mi |
| 808 Meadowbrook Dr Unit C Orange Park, FL | 2.0 | 1.0 | 876 | $1,300 | $1.48 | 25d | 1 | 0.64mi |
| 460 Bentwood Ln Unit C Orange Park, FL | 2.0 | 1.5 | 922 | $1,050 | $1.14 | 25d | 1 | 0.73mi |
| 453 Bentwood Ln Unit B Orange Park, FL | 2.0 | 1.5 | 921 | $1,000 | $1.09 | 25d | 1 | 0.76mi |
| 459 Lombard St Unit 1B Orange Park, FL | 2.0 | 1.5 | 920 | $1,250 | $1.36 | 25d | 1 | 0.77mi |
| 459 Lombard St Orange Park, FL | 2.0 | 2.0 | 920 | $1,250 | $1.36 | 25d | 1 | 0.77mi |
| 1800 Kingsley Ave Orange Park, FL | 1.0–3.0 | 1.0–2.0 | 987 | $1,450 | $1.47 | 25d | 1 | 0.86mi |
| 2020 Wells Rd Orange Park, FL | 1.0–3.0 | 1.0–2.0 | 1167 | $1,298 | $1.11 | 23d | 8 | 0.86mi |
| 8500 Argyle Business Loop Jacksonville, FL | 1.0–3.0 | 1.0–2.0 | 921 | $1,238 | $1.34 | 25d | 1 | 1.35mi |
Listing history 12 events
-
2026-06-07status $145,000 Pending 35 DOM
-
2026-06-03days on market $145,000 Active 35 DOM
-
2026-06-02days on market $145,000 Active 34 DOM
-
2026-06-01days on market $145,000 Active 33 DOM
-
2026-05-31days on market $145,000 Active 32 DOM
-
2026-05-19price $155,000
-
2026-05-19status Active
-
2026-05-18historical Active Under Contract
-
2026-05-08price $169,800
-
2026-04-28$169,900 Active
-
2026-04-21soldstatus $110,000
-
1979-01-01soldstatus $16,003
ⓘ Source: listings_history table (triggers on properties + properties_extension) + one-shot
backfill from property_details.listing_events for pre-trigger history.
Tax reassessment forecast FL · Resets to sale price
- Current annual tax
- $1,947 · $162/mo
- Projected year-2 tax
- $1,947 · $162/mo
- Expected delta
- $0/yr ($0/mo · 0.0%)
ⓘ Screening estimate from a state-policy table — verify with the county assessor before closing.
Climate risk First Street
- Flood 1/10 Low FEMA zone X (unshaded) · 0% chance over 30 yrs
- Wildfire 3/10 Moderate
- Heat 9/10 Extreme 7 d/yr ≥107°F today · 20 d/yr by 30 yrs out
- Wind 10/10 Extreme 99% chance of damaging wind over 30 yrs
- Air quality 3/10 Moderate 3 unhealthy d/yr today · 3 by 30 yrs out
Nearby sold comps map
Loading sold comps map…
Walkable amenities ~0.75 mi
Loading nearby amenities…
Taxation est. · year 1
- Rental income
- $15,708
- − Mortgage interest
- −$8,122
- − Property taxes
- −$1,947
- − Insurance
- −$725
- − Repairs & maintenance
- −$1,257
- − Management
- −$1,257
- − Depreciation
- −$4,218
- Taxable loss
- −$1,817
- Est. tax savings @ 24.0%
- +$436
- After-tax cash flow
- $1,049/yr
For passive investors: Depreciation is non-cash, so a rental often shows a tax loss while cash-flowing — sheltering income. Rental losses are passive: they offset passive income freely, and up to $25,000/yr can offset ordinary (W-2) income if you actively participate and your MAGI is under $100k (phasing out to $0 by $150k); unused losses carry forward. On sale, claimed depreciation is recaptured at up to 25%, and gains may owe capital-gains tax (a 1031 exchange can defer both). Figures are a year-1 estimate at your 24.0% rate — not tax advice; consult a CPA.
Schools (NCES district)
- District
- Clay
- NCES district ID
- 1200300
- Math proficiency
- 58% ▼ -8.00%
- Reading proficiency
- 59% ▼ -3.00%
- Median HH income
- $59,379
- Composite
- 50.73/100
- National rank
- #1815
- State rank
- #14 of 73 in FL
Livability — Bellair-Meadowbrook Terrace
No livability data for this city. (Only ~50 U.S. cities are tracked.)
Census & demographics
- Census place
- Bellair-Meadowbrook Terrace, FL
- County
- Clay County · 208,450 people
- City population
- 42,825
- Metro
- Jacksonville, FL
- Population (ZIP)
- 43,561
- Household income
- $76,455
- Rent vs Own
- Severe rent burden
- 1544.0
Population outlook (Clay County) Hauer SSP2
- Today (2025)
- 230,495 people
- By 2030
- 242,427 · +5.2%
- By 2040
- 262,244 · +13.8%
- By 2050
- 275,148 · +19.4%
- By 2075
- 295,397 · +28.2%
- By 2100
- 287,592 · +24.8%
Race, ethnicity, and origin ACS 2023
- Neighborhood character
- Diverse neighborhood (Simpson 0.59)
- Race & ethnicity
- White 60% Black 18% Hispanic / Latino 12% Two or more races 10% Asian 5%
- Hispanic origin (detail)
- Mexican 1% Puerto Rican 5% Cuban 2%
- Common ancestry
- Slovak 4% Italian 2% Lithuanian 2%
- Foreign-born
- 7% · Canada, Vietnam, Jamaica
- Languages at home
- 88% English-only · Spanish 8% Tagalog/Filipino 1% French/Haitian/Cajun 1%
Political lean MEDSL · Clay
- 2024 margin
- Solid R (+39.3) · D 29.9% · R 69.2%
- 2008→2024 swing
- +3.6pp toward D · 2008: -42.8pp · 2024: -39.3pp
- All cycles
- 2024: R+39.3 2020: R+37.1 2016: R+44.3 2012: R+45.8 2008: R+42.8
Not yet ingested
- Civics
- —
Market trends
- HPI YoY
- ▼ -188.76%
- Current HPI
- 289.8735
- Rent YoY
- ▼ -0.87%
- Metro
- Jacksonville, FL
- State GDP YoY
- ▲ 3.28%
- F500 in state
- 36
Industry mix (Fortune 500 HQ in FL)
| Industry | F500 HQs | Revenue |
|---|---|---|
| Industrial Technology | 2 | $29B |
|
||
| Insurance | 2 | $17B |
|
||
| Retail | 1 | $60B |
|
||
| Technology Distribution | 1 | $58B |
|
||
| Homebuilding | 1 | $35B |
|
||
| Technology Manufacturing | 1 | $35B |
|
||
Price history
+868.6% since first listed7 events — show timeline
- 2026-05-19 Price Changed $155,000 realMLS
- 2026-05-19 Relisted — realMLS
- 2026-05-18 Contingent — realMLS
- 2026-05-08 Price Changed $169,800 realMLS
- 2026-04-28 Listed $169,900 realMLS
- 2026-04-21 Sold (Public Records) $110,000 Public Records
- 1979-01-01 Sold (Public Records) $16,003 Public Records
Property tax history
+7.2%/yrLatest (2025): $1,947 · +5.8% YoY. Source: county tax records.
Cash-flow waterfall
monthlySold comps — $/sqft
last 12 mo · ≤1 miLoading sold comps…