33 Big Tree Rd · Suches, GA
Flood risk 1/10 · Minimal
- FEMA flood zone
- X (unshaded)
- Chance of flooding over 30 yrs
- 0.0%
- Est. flood insurance / yr
- $473 – $860
Fire risk 3/10 · Minor
- Est. fire insurance / yr
- $963 – $1,789
Heat risk 3/10 · Minor
- Hot days now (above 97°F)
- 8 days/yr
- Hot days in 30 yrs
- 22 days/yr
Wind risk 2/10 · Minimal
- Chance of severe wind over 30 yrs
- 1.0%
Air-quality risk 3/10 · Minor
- Unhealthy air days now
- 3 days/yr
- Unhealthy air days in 30 yrs
- 3 days/yr
Risk factors via First Street. Map © Google.
Why this score? — see what drove the D- grade
The composite is a weighted blend of 9 inputs, each scored 0–100. Each bar is that input's sub-score; the figure is the points it added to the 100-point composite (weight × sub-score).
- ARV discount +15.0/15.0
- Cash flow +6.5/30.0
- Appreciation +6.4/10.0
- Schools +3.3/10.0
- Rent growth +2.5/5.0
- Livability +2.5/5.0
- Condition / age +2.5/5.0
- DSCR +0.8/10.0
- 1% rule +0.4/10.0
$379,000
🖨 Deal sheet (PDF) 📄 Offer letter ✓ Due diligence
Listing remarks
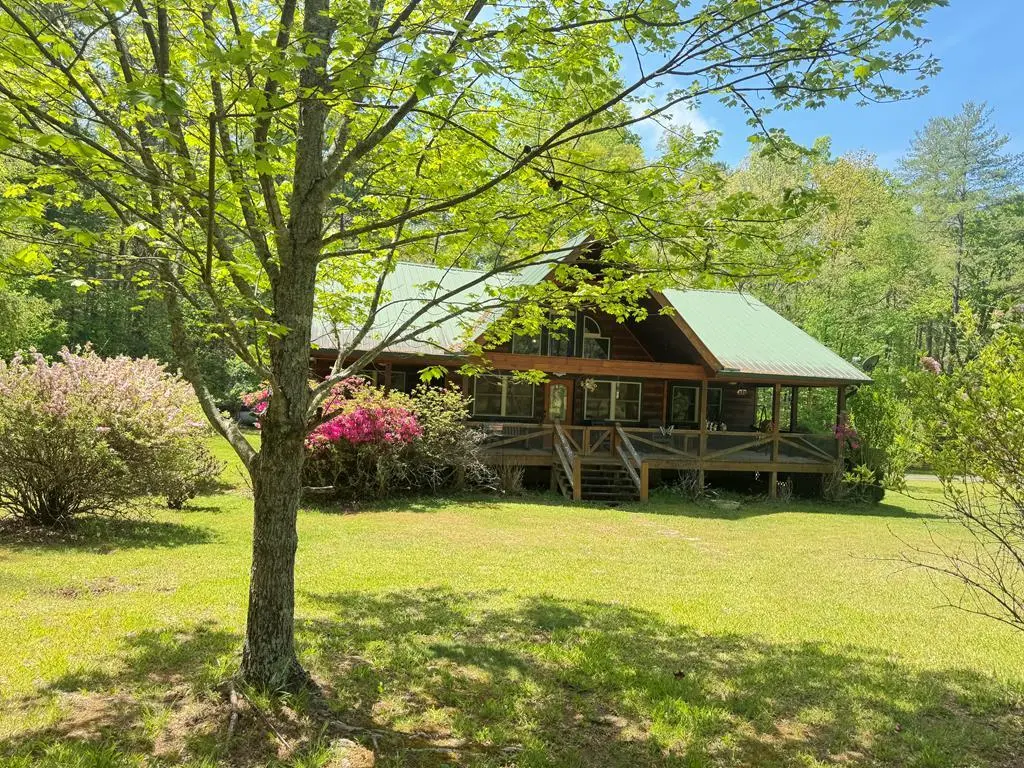
Tucked into the quiet beauty of North Georgia, this 1.6 acre parcel lays just about as right as land can lay, level, usable, and thoughtfully landscaped into a true park like setting that welcomes you the moment you turn in. The concrete drive leads you home under a covered two car carport. Wide and inviting front porch stretches across the front, made for morning coffee, evening conversations, and taking in the kind of peace folks come to the mountains searching for. Step inside and you'll find a home that feels solid, warm, and well crafted. Hardwood floors run underfoot, while soaring pine walls and ceilings bring that true mountain character without overdoing it. The great room centers
Key facts
- Wide front porch
- One level living
- Hardwood floors
Tags
Property features AI
Finance
- Other: Located in the Big Tree subdivision
- HOA & community: Association fees billed annually
Exterior
- Parking: Carport; Driveway; Gravel parking; Open parking available
- Utilities: Community water and well; Septic tank
- Home design: One-story residential home; Built in 2002; Frame construction with wood siding and stone accents; Metal roof
- Construction: Built in 2002; Frame construction; Wood siding; Stone accents; Metal roof; Crawl space foundation
- Exterior features: Insulated windows with screens; Covered front porch; Private yard; Level topography; County road frontage on a paved road; Has a view
Interior
- Kitchen: Refrigerator; Range; Microwave; Dishwasher
- Bedrooms: Master bedroom on the main level; Two bedrooms on the main level
- Flooring: Wood flooring; Tile; Laminate
- Bathrooms: Two full bathrooms
- Heating & cooling: Central heating; Central air conditioning
- Interior features: Ceiling fans; Cathedral ceilings; Wood accents; Gas log fireplace (1)
- Laundry & utility: Washer and dryer included; Laundry on the main level; Crawl space basement
Neighborhood map
What this means for you Summary
Snapshot
- This is a 2-bed/2.0-bath single-family listed at $379k.
Deal economics
- At list price, monthly cash flow is $-640 ($-8k/yr) — negative.
- To cash-flow at today's rent, offer at most $266k (29.8% below list).
- To meet the 1% rule (rent ≥ 1% of price), the offer needs to be $206k (45.7% below list).
- Recommended offer: $206k (45.7% below list) — sets the bar for 1% rule.
Location & tenants
- Location reads: area grade D — affects rentability + tenant quality, not the cash-flow math above.
- Fannin County (rural): math 40% / reading 39% proficiency, ranked #51 of 174 in GA (top 29%) — families likely to look elsewhere, expect single-tenant / working-renter base with shorter leases.
- Zoned schools: East Fannin Elementary School (math 42% / reading 32%, grade F, #485 of 1,228 statewide, top 41%, 415 students, 63% FRL); Fannin County Middle School (math 41% / reading 43%, grade D-, #126 of 470 statewide, top 28%, 619 students, 53% FRL); Fannin County High School (math 27% / reading 47%, grade F, #68 of 424 statewide, top 17%, 900 students, 44% FRL) — zoned schools at 53% FRL track the district average.
- Market conditions: 59 active listings in the ZIP; 375 units permitted in Fannin County in 2024 (0 in 5+ unit buildings).
Forward outlook
- In year one you build about $13k of equity ($3k loan paydown + $11k appreciation (2.8% local appreciation)).
- By year 3, paydown + projected appreciation supports a ~$33k cash-out refi (75% LTV) — recoverable capital for the next deal without selling this one.
Negotiation context
- It's been on market 55 days — a 3% lower offer ($368k) is reasonable based on typical stale-listing flexibility.
- Current owner paid $122k; list at $379k implies a 210% gain — meaningful room to come down on a strong offer.
Questions for the listing agent
- What do current leases actually rent for vs. the listed asking? Can we see a recent rent roll and the last 12 months of T-12 income?
- It's been on market 55 days. Have you received any prior offers? Is the seller open to a 46% concession, seller financing, or rate buy-down credit?
- Is there a deadline driving the sale (1031 exchange, divorce, estate, relocation)? That informs how much negotiation room exists.
- The area grade is low — what's the realistic commute time and amenity access for the typical tenant pool here? Any planned neighborhood developments (good or bad) we should know about?
- What's the average days-on-market for RENTAL listings here right now (not sales)? A rising rental-DOM trend means longer vacancies and softer asking-rent achievability than the comps imply.
- What's the recent tenant-quality profile in this submarket — average credit score on applications, eviction rate, late-payment / NSF rate, and stable-employment percentage? A property-management company in the area should have these aggregated.
- How much new for-sale + rental construction is in the pipeline within 1–3 miles? Heavy new supply typically softens prices + rents 12–24 months out; constrained supply supports both.
Investment metrics
- 1% rule
- 0.54% ✗
- Cap rate
- 4.27%
- Cash-on-cash
- -7.24%
- DSCR
- 0.68
- GRM
- 15.3
CMA / ARV
- ARV (median comp)
- $460,861
- List price
- $379,000
- Delta
- -17.76%
- Verdict
- UNDERPRICED
- Comps
- 6 within 1.0 mi
Show comp detail 1 sale within ~0.75 mi
| Address | Dist | Beds/Ba | Sqft | Sold | Price | $/sf | Match |
|---|---|---|---|---|---|---|---|
| 133 Hemlock Dr | 0.50mi | 2/2.0 | 1,260 (-2%) | 8mo | $524,500 | $416 | 68 |
Match score weights: distance 35% · size 25% · config 20% · recency 20%. Top-matched comps best support the ARV.
Projected returns pro-forma
2.84% appreciation · 3.0% rent growth · sell at horizon
- IRR
- 0.3%
- Equity multiple
- 1.02×
- Total profit
- $1,596
- Equity at exit
- $167,106
- IRR
- 4.2%
- Equity multiple
- 1.63×
- Total profit
- $66,504
- Equity at exit
- $254,987
Cash invested: $106,120 (down + closing). Projections, not guarantees.
Landlord ↔ Tenant lean methodology
- Overall (STATE)
- 90 Strongly Landlord-Friendly
- State Georgia
- 90 Strongly Landlord-Friendly · R+3
- County
- — inherits STATE
- City
- — inherits STATE
ZIP-level market 30572
- Home prices YoY
- 0.8%
- Active inventory
- 59
- Price-to-rent
- 15.3×
Monthly cashflow live
- Estimated rent
- $2,059 medium interval (Pro) →
- Mortgage (P&I)
- −$1,988
- Tax from tax record
- −$121 /mo · $1,458/yr
- Insurance
- −$158
- HOA
- −$0
- Vacancy / Maint / Mgmt
- −$432
- Net cashflow
- $-640
Break-even live
Sensitivity live
| Price | -10% $-425 | -5% $-533 | +0% $-640 | +5% $-747 | +10% $-855 |
|---|---|---|---|---|---|
| Rent | -10% $-803 | -5% $-721 | +0% $-640 | +5% $-559 | +10% $-477 |
| Rate | -1.0pp $-449 | -0.5pp $-544 | base $-640 | +0.5pp $-738 | +1.0pp $-838 |
UW: 25.0% down · 7.5% · 30yr · 1.5% tax · 5.0% vac · 8.0% maint · 8.0% mgmt
Financing live
Cash to close
- Down payment
- $94,750
- Closing costs
- $11,370
- Reserves months
- —
- Total cash needed
- —
Loan-product check · same deal, 3 products live
Conventional
25% down · 7.5% · 30yr
- Down + closing
- —
- Monthly P&I
- —
- Monthly cashflow
- —
- DSCR
- —
- Eligible?
- —
Personal DTI + credit; lowest rate.
DSCR
20% down · 8.5% · 30yr
- Down + closing
- —
- Monthly P&I
- —
- Monthly cashflow
- —
- DSCR
- —
- Eligible?
- —
No personal income docs; deal must DSCR.
Hard money
10% down · 12.0% · 12mo
- Down + closing
- —
- Monthly P&I
- —
- Monthly cashflow
- —
- DSCR
- —
- Eligible?
- —
Short-term bridge; refi at stabilization.
Listing history 19 events
-
2026-06-21days on market $379,000 Active 55 DOM
-
2026-06-18days on market $379,000 Active 52 DOM
-
2026-06-17days on market $379,000 Active 51 DOM
-
2026-06-16days on market $379,000 Active 50 DOM
-
2026-06-15days on market $379,000 Active 49 DOM
-
2026-06-14days on market $379,000 Active 47 DOM
-
2026-06-13days on market $379,000 Active 46 DOM
-
2026-06-10days on market $379,000 Active 44 DOM
-
2026-06-09days on market $379,000 Active 43 DOM
-
2026-06-08days on market $379,000 Active 42 DOM
-
2026-06-07days on market $379,000 Active 41 DOM
-
2026-06-05days on market $379,000 Active 38 DOM
-
2026-06-03days on market $379,000 Active 37 DOM
-
2026-06-02days on market $379,000 Active 36 DOM
-
2026-06-01days on market $379,000 Active 35 DOM
-
2026-05-31days on market $379,000 Active 34 DOM
-
2026-05-31days on market $379,000 Active 33 DOM
-
2026-04-27$379,000 Active 1766-char remark
-
2015-05-15soldstatus $122,247
ⓘ Source: listings_history table (triggers on properties + properties_extension) + one-shot
backfill from property_details.listing_events for pre-trigger history.
Tax reassessment forecast GA · Resets to sale price
- Current annual tax
- $1,458 · $121/mo
- Projected year-2 tax
- $3,487 · $291/mo
- Expected delta
- +$2,029/yr (+$169/mo · 139.2%)
ⓘ Screening estimate from a state-policy table — verify with the county assessor before closing.
Climate risk First Street
- Flood 1/10 Low FEMA zone X (unshaded) · 0% chance over 30 yrs
- Wildfire 3/10 Moderate
- Heat 3/10 Moderate 8 d/yr ≥97°F today · 22 d/yr by 30 yrs out
- Wind 2/10 Low 100% chance of damaging wind over 30 yrs
- Air quality 3/10 Moderate 3 unhealthy d/yr today · 3 by 30 yrs out
Nearby sold comps map
Loading sold comps map…
Walkable amenities ~0.75 mi
Loading nearby amenities…
Taxation est. · year 1
- Rental income
- $24,712
- − Mortgage interest
- −$21,230
- − Property taxes
- −$1,458
- − Insurance
- −$1,895
- − Repairs & maintenance
- −$1,977
- − Management
- −$1,977
- − Depreciation
- −$11,025
- Taxable loss
- −$14,850
- Est. tax savings @ 24.0%
- +$3,564
- After-tax cash flow
- $-4,116/yr
For passive investors: Depreciation is non-cash, so a rental often shows a tax loss while cash-flowing — sheltering income. Rental losses are passive: they offset passive income freely, and up to $25,000/yr can offset ordinary (W-2) income if you actively participate and your MAGI is under $100k (phasing out to $0 by $150k); unused losses carry forward. On sale, claimed depreciation is recaptured at up to 25%, and gains may owe capital-gains tax (a 1031 exchange can defer both). Figures are a year-1 estimate at your 24.0% rate — not tax advice; consult a CPA.
Schools (NCES district)
- District
- Fannin County
- NCES district ID
- 1302100
- Math proficiency
- 40% ▼ -7.00%
- Reading proficiency
- 39% ▼ -10.00%
- Median HH income
- $37,693
- Composite
- 32.92/100
- National rank
- #5597
- State rank
- #51 of 174 in GA
Livability — Suches
No livability data for this city. (Only ~50 U.S. cities are tracked.)
Census & demographics
- Population (ZIP)
- 1,006
Population outlook (Fannin County) Hauer SSP2
- Today (2025)
- 25,218 people
- By 2030
- 25,519 · +1.2%
- By 2040
- 25,548 · +1.3%
- By 2050
- 25,008 · -0.8%
- By 2075
- 23,359 · -7.4%
- By 2100
- 20,129 · -20.2%
Race, ethnicity, and origin ACS 2023
- Neighborhood character
- Predominantly White (97%)
- Race & ethnicity
- White 97% Two or more races 2% Black 2%
- Common ancestry
- Romanian 12% Slovak 3% Lithuanian 2%
- Languages at home
- 99% English-only · Russian/Polish/Slavic 1%
Political lean MEDSL · Fannin
- 2024 margin
- Solid R (+64.8) · D 17.4% · R 82.2%
- 2008→2024 swing
- -15.7pp toward R · 2008: -49.1pp · 2024: -64.8pp
- All cycles
- 2024: R+64.8 2020: R+64.6 2016: R+65.5 2012: R+58.2 2008: R+49.1
Not yet ingested
- Civics
- —
Market trends
- HPI YoY
- ▲ 2.84%
- Current HPI
- 348.9701
- Rent YoY
- —
- Metro
- —
- State GDP YoY
- ▲ 2.66%
- F500 in state
- 28
Industry mix (Fortune 500 HQ in GA)
| Industry | F500 HQs | Revenue |
|---|---|---|
| Paper / Packaging | 2 | $29B |
|
||
| Retail | 1 | $160B |
|
||
| Transportation / Logistics | 1 | $91B |
|
||
| Airlines | 1 | $62B |
|
||
| Consumer Goods | 1 | $47B |
|
||
| Utilities | 1 | $25B |
|
||
Price history
+210.0% since first listed2 events — show timeline
- 2026-04-27 Listed $379,000 NEGBOR
- 2015-05-15 Sold (Public Records) $122,247 Public Records
Property tax history
+7.8%/yrLatest (2025): $1,458 · -1.0% YoY. Source: county tax records.
Cash-flow waterfall
monthlySold comps — $/sqft
last 12 mo · ≤1 miLoading sold comps…