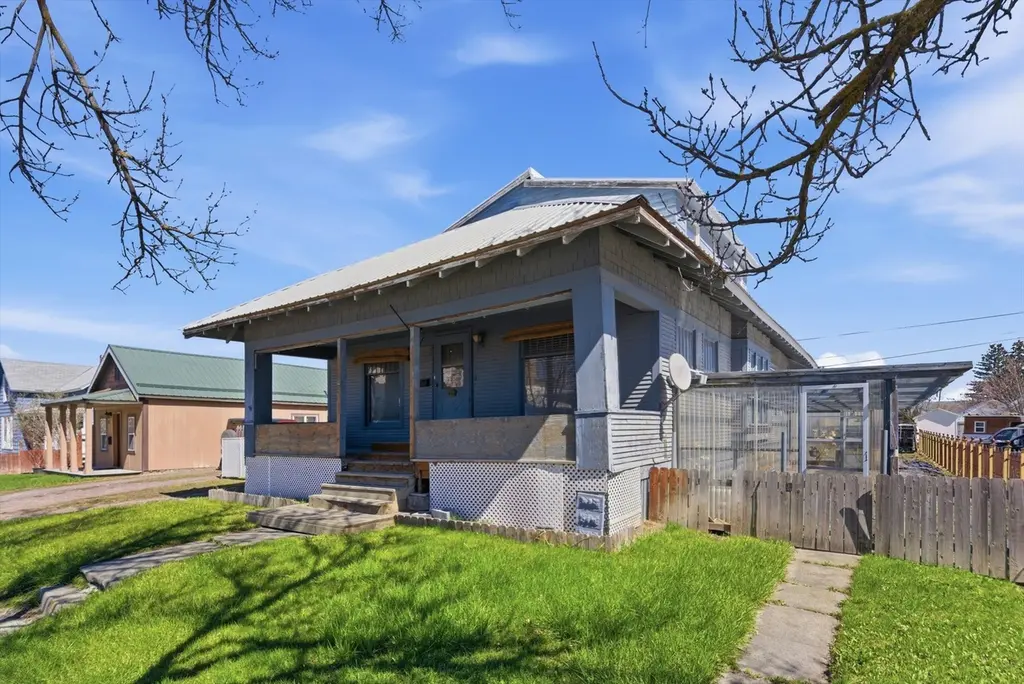
19 5th Ave W · Kalispell, MT
Flood risk 1/10 · Minimal
- FEMA flood zone
- X (unshaded)
- Chance of flooding over 30 yrs
- 0.0%
- Est. flood insurance / yr
- $507 – $1,088
Fire risk 5/10 · Moderate
- Est. fire insurance / yr
- $918 – $1,706
Heat risk 2/10 · Minimal
- Hot days now (above 90°F)
- 7 days/yr
- Hot days in 30 yrs
- 16 days/yr
Wind risk 1/10 · Minimal
- Chance of severe wind over 30 yrs
- —
Air-quality risk 8/10 · Major
- Unhealthy air days now
- 14 days/yr
- Unhealthy air days in 30 yrs
- 17 days/yr
Risk factors via First Street. Map © Google.
Why this score? — see what drove the C- grade
The composite is a weighted blend of 9 inputs, each scored 0–100. Each bar is that input's sub-score; the figure is the points it added to the 100-point composite (weight × sub-score).
- Cash flow +16.6/30.0
- ARV discount +15.0/15.0
- DSCR +5.2/10.0
- 1% rule +3.9/10.0
- Livability +3.6/5.0
- Schools +3.5/10.0
- Rent growth +3.1/5.0
- Condition / age +2.5/5.0
- Appreciation +0.0/10.0
$274,000
🖨 Deal sheet (PDF) 📄 Offer letter ✓ Due diligence
Key facts
- Unfinished basement
- Oversized lot
- 9,147 sq ft lot
Tags
Property features AI
Finance
- Other: Zoned B-3 Core Area - Business
Exterior
- Parking: Detached garage with 1 parking space; Additional parking accessed from alley
- Utilities: Public water; Public sewer; Electricity connected; Natural gas connected / natural gas available; Cable available; Phone available
- Home design: Single-family residence; One and one-half stories
- Construction: Wood siding; Block foundation
- Exterior features: Front porch; Perimeter fencing; Metal roof; Level topography/lot; Asphalt road frontage; Alley and city street frontage; Publicly maintained road; Curbs, street lights, sidewalks (community)
Interior
- Kitchen: Range; Dishwasher; Refrigerator
- Bathrooms: One three-quarter bathroom
- Heating & cooling: Baseboard heating; Electric heating; Fireplace(s)
- Interior features: High-speed internet
- Laundry & utility: Washer; Dryer; Washer hookup
Neighborhood map
What this means for you Summary
Snapshot
- This is a 4-bed/2.0-bath single-family listed at $274k.
Deal economics
- At list price, monthly cash flow is $167 ($2k/yr) — positive.
- The deal already cash-flows at list — no discount required.
- To meet the 1% rule (rent ≥ 1% of price), the offer needs to be $245k (10.7% below list).
- Recommended offer: $245k (10.7% below list) — sets the bar for 1% rule.
- Cap rate 7.0% vs local median 2.1% in Kalispell — top-decile yield for the area; either an underpriced asset or a hidden risk that comps aren't pricing in. Stress-test before assuming the spread holds.
Location & tenants
- Location reads 72/100 on livability (#61 in MT) — a middle-class / working-renter tenant base. Strengths: health & safety A+, cost of living A, housing A-; Watch: crime C-, commute F, employment D-.
- Flathead H S (town): math 29% / reading 52% proficiency, ranked #55 of 116 in MT (top 47%) — families likely to look elsewhere, expect single-tenant / working-renter base with shorter leases.
- Zoned schools: Elrod School (math 27% / reading 52%, grade F, #166 of 293 statewide, top 61%, 231 students, 0% FRL); Kalispell Middle School (math 50% / reading 61%, grade B-, #13 of 146 statewide, top 8%, 1,045 students, 0% FRL); Flathead High School (math 22% / reading 50%, grade F, #50 of 132 statewide, top 37%, 1,626 students, 0% FRL).
- Market conditions: Rents rising (+2.4%/yr); 693 active listings in the ZIP; 281 units permitted in Flathead County in 2024 (80 in 5+ unit buildings).
- This rent runs 40% of the median local income ($73k/yr) — at the standard rent-burdened threshold; future hikes will face affordability resistance.
Forward outlook
- Local home prices are declining (-3.0%/yr); year-one equity from $2k of loan paydown is wiped out by about $8k of value loss. Plan a longer hold.
- Flathead County population projected at +20% by 2050 — long-run rental-demand tailwind backs the buy-and-hold thesis.
Negotiation context
- It's been on market 69 days — a 6% lower offer ($258k) is reasonable based on typical stale-listing flexibility.
Risks & watch-outs
- Watch-outs: built in 1920 — expect roof / HVAC / electrical / plumbing capex.
- Climate carrying-cost: moderate wildfire risk — expect insurance premiums to compound above CPI over the hold.
Questions for the listing agent
- It's been on market 69 days. Have you received any prior offers? Is the seller open to a 11% concession, seller financing, or rate buy-down credit?
- Built in 1920 — when were the roof, HVAC, electrical panel, plumbing, and water heater last replaced?
- Why hasn't it sold? Are there any deal-killer items the seller is aware of (foundation, flood, title, zoning, code violations)?
- Is there a deadline driving the sale (1031 exchange, divorce, estate, relocation)? That informs how much negotiation room exists.
- Schools are B-rated — typically a magnet for longer-tenancy family renters. What's the average tenant stay here, and is there a school-zone premium baked into asking?
- What's the average days-on-market for RENTAL listings here right now (not sales)? A rising rental-DOM trend means longer vacancies and softer asking-rent achievability than the comps imply.
- What's the recent tenant-quality profile in this submarket — average credit score on applications, eviction rate, late-payment / NSF rate, and stable-employment percentage? A property-management company in the area should have these aggregated.
- How much new for-sale + rental construction is in the pipeline within 1–3 miles? Heavy new supply typically softens prices + rents 12–24 months out; constrained supply supports both.
Investment metrics
- 1% rule
- 0.89% ✗
- Cap rate
- 7.02%
- Cash-on-cash
- 2.61%
- DSCR
- 1.12
- GRM
- 9.3
CMA / ARV
- ARV (on-the-fly)
- $435,664
- Comps found
- 12
Show comp detail 12 sales within ~0.75 mi
| Address | Dist | Beds/Ba | Sqft | Sold | Price | $/sf | Match |
|---|---|---|---|---|---|---|---|
| 365 5th Ave | 0.36mi | 4/1.0 | 1,564 (+5%) | 8mo | $428,000 | $274 | 64 |
| 518 2nd Ave W | 0.39mi | 3/2.0 (-1) | 1,432 (-4%) | 10mo | $410,000 | $286 | 62 |
| 823 2nd St W | 0.27mi | 3/2.0 (-1) | 1,268 (-15%) | 1mo | $445,000 | $351 | 57 |
| 277 1st Ave Unit EN | 0.53mi | 4/2.0 | 1,389 (-7%) | 9mo | $450,000 | $324 | 56 |
| 528 9th Ave W | 0.47mi | 3/1.0 (-1) | 1,424 (-5%) | 12mo | $440,000 | $309 | 51 |
| 661 1st Ave | 0.71mi | 4/2.0 | 1,594 (+7%) | 5mo | $449,000 | $282 | 51 |
| 614 1st Ave W | 0.48mi | 4/1.5 | 1,668 (+12%) | 6mo | $425,000 | $255 | 51 |
| 1238 6th St W | 0.66mi | 4/2.0 | 1,376 (-8%) | 10mo | $469,000 | $341 | 48 |
| 495 3rd Ave | 0.73mi | 3/2.0 (-1) | 1,612 (+8%) | 3mo | $470,000 | $292 | 45 |
| 578 1st Ave | 0.65mi | 3/1.0 (-1) | 1,284 (-14%) | 2mo | $440,000 | $343 | 36 |
| 319 4th Ave E | 0.67mi | 3/1.0 (-1) | 1,629 (+9%) | 11mo | $449,000 | $276 | 35 |
| 690 1st Ave | 0.71mi | 3/2.0 (-1) | 1,687 (+13%) | 12mo | $459,000 | $272 | 30 |
Match score weights: distance 35% · size 25% · config 20% · recency 20%. Top-matched comps best support the ARV.
Projected returns pro-forma
-3.0% appreciation · 2.41% rent growth · sell at horizon
- IRR
- -12.8%
- Equity multiple
- 0.54×
- Total profit
- $-35,251
- Equity at exit
- $40,854
- IRR
- -4.7%
- Equity multiple
- 0.70×
- Total profit
- $-23,027
- Equity at exit
- $23,691
Cash invested: $76,720 (down + closing). Projections, not guarantees.
Landlord ↔ Tenant lean methodology
- Overall (STATE)
- 82 Strongly Landlord-Friendly
- State Montana
- 82 Strongly Landlord-Friendly · R+11
- County
- — inherits STATE
- City
- — inherits STATE
ZIP-level market 59901
- Rents YoY
- 2.4%
- Active inventory
- 693
- Price-to-rent
- 9.3×
Monthly cashflow live
- Estimated rent
- $2,447 medium interval (Pro) →
- Mortgage (P&I)
- −$1,437
- Tax from tax record
- −$215 /mo · $2,584/yr
- Insurance
- −$114
- HOA
- −$0
- Vacancy / Maint / Mgmt
- −$514
- Net cashflow
- $167
Break-even live
Sensitivity live
| Price | -10% $322 | -5% $245 | +0% $167 | +5% $89 | +10% $12 |
|---|---|---|---|---|---|
| Rent | -10% $-26 | -5% $70 | +0% $167 | +5% $264 | +10% $360 |
| Rate | -1.0pp $305 | -0.5pp $237 | base $167 | +0.5pp $96 | +1.0pp $24 |
UW: 25.0% down · 7.5% · 30yr · 1.5% tax · 5.0% vac · 8.0% maint · 8.0% mgmt
Financing live
Cash to close
- Down payment
- $68,500
- Closing costs
- $8,220
- Reserves months
- —
- Total cash needed
- —
Loan-product check · same deal, 3 products live
Conventional
25% down · 7.5% · 30yr
- Down + closing
- —
- Monthly P&I
- —
- Monthly cashflow
- —
- DSCR
- —
- Eligible?
- —
Personal DTI + credit; lowest rate.
DSCR
20% down · 8.5% · 30yr
- Down + closing
- —
- Monthly P&I
- —
- Monthly cashflow
- —
- DSCR
- —
- Eligible?
- —
No personal income docs; deal must DSCR.
Hard money
10% down · 12.0% · 12mo
- Down + closing
- —
- Monthly P&I
- —
- Monthly cashflow
- —
- DSCR
- —
- Eligible?
- —
Short-term bridge; refi at stabilization.
Listing history 22 events
-
2026-06-21days on market $274,000 Active 69 DOM
-
2026-06-19days on market $274,000 Active 67 DOM
-
2026-06-18days on market $274,000 Active 66 DOM
-
2026-06-17days on market $274,000 Active 65 DOM
-
2026-06-16days on market $274,000 Active 64 DOM
-
2026-06-15price $274,000 Active 63 DOM
-
2026-06-15days on market $299,900 Active 63 DOM
-
2026-06-14days on market $299,900 Active 61 DOM
-
2026-06-13days on market $299,900 Active 60 DOM
-
2026-06-10days on market $299,900 Active 58 DOM
-
2026-06-09days on market $299,900 Active 57 DOM
-
2026-06-08days on market $299,900 Active 56 DOM
-
2026-06-07days on market $299,900 Active 55 DOM
-
2026-06-05days on market $299,900 Active 52 DOM
-
2026-06-03days on market $299,900 Active 51 DOM
-
2026-06-02days on market $299,900 Active 50 DOM
-
2026-06-01days on market $299,900 Active 49 DOM
-
2026-05-31days on market $299,900 Active 48 DOM
-
2026-05-30days on market $299,900 Active 47 DOM
-
2026-05-14price $299,900
-
2026-05-05price $324,900
-
2026-04-13$349,000 Active
ⓘ Source: listings_history table (triggers on properties + properties_extension) + one-shot
backfill from property_details.listing_events for pre-trigger history.
Tax reassessment forecast MT · Resets to sale price
- Current annual tax
- $2,584 · $215/mo
- Projected year-2 tax
- $2,584 · $215/mo
- Expected delta
- $0/yr ($0/mo · 0.0%)
ⓘ Screening estimate from a state-policy table — verify with the county assessor before closing.
Climate risk First Street
- Flood 1/10 Low FEMA zone X (unshaded) · 0% chance over 30 yrs
- Wildfire 5/10 Major
- Heat 2/10 Low 7 d/yr ≥90°F today · 16 d/yr by 30 yrs out
- Wind 1/10 Low
- Air quality 8/10 Severe 14 unhealthy d/yr today · 17 by 30 yrs out
Nearby sold comps map
Loading sold comps map…
Walkable amenities ~0.75 mi
Loading nearby amenities…
Taxation est. · year 1
- Rental income
- $29,367
- − Mortgage interest
- −$15,348
- − Property taxes
- −$2,584
- − Insurance
- −$1,370
- − Repairs & maintenance
- −$2,349
- − Management
- −$2,349
- − Depreciation
- −$7,971
- Taxable loss
- −$2,605
- Est. tax savings @ 24.0%
- +$625
- After-tax cash flow
- $2,629/yr
For passive investors: Depreciation is non-cash, so a rental often shows a tax loss while cash-flowing — sheltering income. Rental losses are passive: they offset passive income freely, and up to $25,000/yr can offset ordinary (W-2) income if you actively participate and your MAGI is under $100k (phasing out to $0 by $150k); unused losses carry forward. On sale, claimed depreciation is recaptured at up to 25%, and gains may owe capital-gains tax (a 1031 exchange can defer both). Figures are a year-1 estimate at your 24.0% rate — not tax advice; consult a CPA.
Schools (NCES district)
- District
- Flathead H S
- NCES district ID
- 3015420
- Math proficiency
- 29% ▼ -6.00%
- Reading proficiency
- 52% ▼ -3.00%
- Median HH income
- $49,712
- Composite
- 34.79/100
- National rank
- #5115
- State rank
- #55 of 116 in MT
Livability — Kalispell
- Score
- 72/100
- State rank
- #61
- US rank
- #6399
Category grades
Schools grade is shown separately in the Schools card above.
Census & demographics
- Census place
- Kalispell, MT
- County
- Flathead County · 94,027 people
- City population
- 63,161
- Metro
- Kalispell, MT
- Population (ZIP)
- 63,161
- Household income
- $72,523
- Rent vs Own
- Severe rent burden
- 1577.0
Population outlook (Flathead County) Hauer SSP2
- Today (2025)
- 108,002 people
- By 2030
- 113,362 · +5.0%
- By 2040
- 122,245 · +13.2%
- By 2050
- 129,517 · +19.9%
- By 2075
- 146,737 · +35.9%
- By 2100
- 155,045 · +43.6%
Race, ethnicity, and origin ACS 2023
- Neighborhood character
- Predominantly White (89%)
- Race & ethnicity
- White 89% Two or more races 6% Hispanic / Latino 4% Native American 1% Asian 1%
- Common ancestry
- Portuguese 9% Slovak 3% Lithuanian 3%
- Foreign-born
- 3% · Canada, China
- Languages at home
- 96% English-only · Spanish 1% German/W. Germanic 0%
Political lean MEDSL · Flathead
- 2024 margin
- Solid R (+33.8) · D 31.8% · R 65.5% · Other 2.7%
- 2008→2024 swing
- -12.2pp toward R · 2008: -21.6pp · 2024: -33.8pp
- All cycles
- 2024: R+33.8 2020: R+29.9 2016: R+36.5 2012: R+33.4 2008: R+21.6
Not yet ingested
- Civics
- —
Market trends
- HPI YoY
- ▼ -698.78%
- Current HPI
- 225.6792
- Rent YoY
- ▲ 2.41%
- Metro
- Kalispell, MT
- State GDP YoY
- ▲ 3.41%
- F500 in state
- 2
Industry mix (Fortune 500 HQ in MT)
| Industry | F500 HQs | Revenue |
|---|---|---|
| Technology / Analytics | 1 | $2B |
|
||
Price history
-14.1% since first listed3 events — show timeline
- 2026-05-14 Price Changed $299,900 MRMLS
- 2026-05-05 Price Changed $324,900 MRMLS
- 2026-04-13 Listed $349,000 MRMLS
Property tax history
+2.5%/yrLatest (2025): $2,584 · -21.3% YoY. Source: county tax records.
Cash-flow waterfall
monthlySold comps — $/sqft
last 12 mo · ≤1 miLoading sold comps…