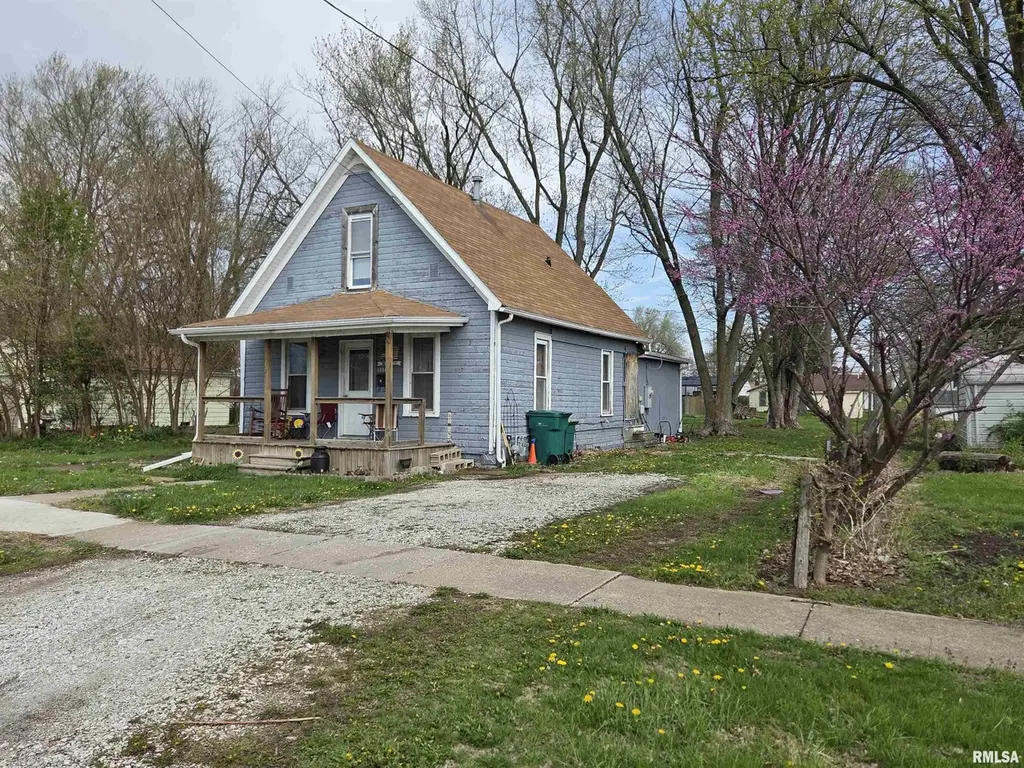
1336 E Wheeler St · Macomb, IL
Flood risk 1/10 · Minimal
- FEMA flood zone
- —
- Chance of flooding over 30 yrs
- 0.0%
- Est. flood insurance / yr
- —
Fire risk 1/10 · Minimal
- Est. fire insurance / yr
- $804 – $1,492
Heat risk 3/10 · Minor
- Hot days now (above 107°F)
- 7 days/yr
- Hot days in 30 yrs
- 17 days/yr
Wind risk 2/10 · Minimal
- Chance of severe wind over 30 yrs
- —
Air-quality risk 2/10 · Minimal
- Unhealthy air days now
- 1 days/yr
- Unhealthy air days in 30 yrs
- 1 days/yr
Risk factors via First Street. Map © Google.
Why this score? — see what drove the B+ grade
The composite is a weighted blend of 9 inputs, each scored 0–100. Each bar is that input's sub-score; the figure is the points it added to the 100-point composite (weight × sub-score).
- Cash flow +30.0/30.0
- ARV discount +15.0/15.0
- 1% rule +10.0/10.0
- DSCR +10.0/10.0
- Livability +3.5/5.0
- Rent growth +2.5/5.0
- Condition / age +2.5/5.0
- Schools +1.8/10.0
- Appreciation +0.0/10.0
$43,900
🖨 Deal sheet 📄 Offer letter ✓ Due diligence
Listing remarks MLS
This 2 bedroom, 1 bath bungalow needs work but has good potential for the right buyer. The huge 15 x 21 kitchen was added in 2007 with plenty of cabinetry for all the storage you might need. Most appliances are included except the washer & dryer. There is a separate dining room that could also be used as part of the living area. One bedroom is on the main floor, with the 2nd being upstairs along with another room for use as to whatever the need might be. Flooring needs to be added throughout most of the home. Sitting on a large 60 x 174 lot with an alley behind makes a perfect spot for a garage. The covered front porch has newer decking and ready to be stained. If you're looking for a very affordable home and have handyman skills, this one may be for you!
Key facts
- Covered front porch
- Separate dining room
- Large lot
Tags
Neighborhood map
What this means for you Summary
Snapshot
- This is a 2-bed/1.0-bath single-family listed at $44k.
Deal economics
- At list price, monthly cash flow is $269 ($3k/yr) — positive.
- The deal already cash-flows at list — no discount required.
- Meets the 1% rule at list price ($784 rent vs $44k).
- Recommended offer: $41k (6.0% below list) — sets the bar for market timing.
- Cap rate 13.7% vs local median 6.2% in Macomb — top-decile yield for the area; either an underpriced asset or a hidden risk that comps aren't pricing in. Stress-test before assuming the spread holds.
Location & tenants
- Location reads 70/100 on livability (#379 in IL) — a middle-class / working-renter tenant base. Strengths: cost of living A+, health & safety A+, housing B; Watch: schools D, crime D, amenities D.
- Macomb CUSD 185 (town): math 19% / reading 26% proficiency, ranked #410 of 620 in IL (top 66%) — low school quality limits family demand, transient renter base, plan for 1-2y turnover.
- Market conditions: 135 active listings in the ZIP; 2 comparable units currently listed for rent nearby.
Forward outlook
- Local home prices are declining (-3.0%/yr); year-one equity from $304 of loan paydown is wiped out by about $1k of value loss. Plan a longer hold.
- At projected returns (-3.0% appreciation + 3.0% rent growth), your $12k cash investment doubles in ~5 years — after that, you're playing with house money.
Negotiation context
- It's been on market 66 days — a 6% lower offer ($41k) is reasonable based on typical stale-listing flexibility.
Risks & watch-outs
- Watch-outs: property tax is 2.8% of price; built in 1940 — expect roof / HVAC / electrical / plumbing capex.
Questions for the listing agent
- It's been on market 66 days. Have you received any prior offers? Is the seller open to a 6% concession, seller financing, or rate buy-down credit?
- Built in 1940 — when were the roof, HVAC, electrical panel, plumbing, and water heater last replaced?
- Property tax is high relative to price — has the assessment been appealed recently, and will the sale trigger a re-assessment?
- Why hasn't it sold? Are there any deal-killer items the seller is aware of (foundation, flood, title, zoning, code violations)?
- Is there a deadline driving the sale (1031 exchange, divorce, estate, relocation)? That informs how much negotiation room exists.
- Schools are D-rated, which usually means shorter tenancies and higher turnover. Who's the typical renter profile here, and what's been the actual vacancy rate?
- Crime grade is D in this area — have there been break-ins, vandalism, or insurance claims at this property in the last 3 years? What carrier currently insures it and at what premium?
- What's the average days-on-market for RENTAL listings here right now (not sales)? A rising rental-DOM trend means longer vacancies and softer asking-rent achievability than the comps imply.
- What's the recent tenant-quality profile in this submarket — average credit score on applications, eviction rate, late-payment / NSF rate, and stable-employment percentage? A property-management company in the area should have these aggregated.
- How much new for-sale + rental construction is in the pipeline within 1–3 miles? Heavy new supply typically softens prices + rents 12–24 months out; constrained supply supports both.
Investment metrics
- 1% rule
- 1.79% ✓
- Cap rate
- 13.65%
- Cash-on-cash
- 26.28%
- DSCR
- 2.17
- GRM
- 4.7
CMA / ARV
- ARV (median comp)
- $81,543
- List price
- $43,900
- Delta
- -46.16%
- Verdict
- UNDERPRICED
- Comps
- 20 within 1.0 mi
Show comp detail 11 sales within ~0.75 mi
| Address | Dist | Beds/Ba | Sqft | Sold | Price | $/sf | Match |
|---|---|---|---|---|---|---|---|
| 1625 E Murray St | 0.29mi | 2/2.0 | 1,040 (+7%) | 2mo | $92,000 | $88 | 69 |
| 1216 E Carroll St | 0.30mi | 3/1.0 (+1) | 1,012 (+4%) | 8mo | $72,000 | $71 | 67 |
| 316 N Monroe St | 0.39mi | 2/1.0 | 924 (-4%) | 15mo | $40,000 | $43 | 62 |
| 316 N Monroe St | 0.39mi | 2/1.0 | 924 (-4%) | 15mo | $40,000 | $43 | 62 |
| 1528 E Pierce St | 0.21mi | 2/1.0 | 1,056 (+9%) | 20mo | $50,000 | $47 | 58 |
| 1008 E Adams St | 0.33mi | 2/1.0 | 921 (-5%) | 22mo | $81,500 | $88 | 58 |
| 1022 E Oak St | 0.49mi | 2/1.0 | 891 (-8%) | 17mo | $112,000 | $126 | 49 |
| 622 N Pearl St | 0.45mi | 3/1.0 (+1) | 1,008 (+4%) | 22mo | $75,000 | $74 | 49 |
| 812 E Murray St | 0.47mi | 2/1.0 | 1,103 (+14%) | 7mo | $60,000 | $54 | 49 |
| 313 N Edwards St | 0.63mi | 1/1.0 (-1) | 882 (-9%) | 10mo | $52,000 | $59 | 42 |
| 728 N Edwards St | 0.67mi | 3/1.5 (+1) | 1,008 (+4%) | 15mo | $73,000 | $72 | 42 |
Match score weights: distance 35% · size 25% · config 20% · recency 20%. Top-matched comps best support the ARV.
Projected returns pro-forma
-3.0% appreciation · 3.0% rent growth · sell at horizon
- IRR
- 20.1%
- Equity multiple
- 1.82×
- Total profit
- $10,072
- Equity at exit
- $6,546
- IRR
- 28.4%
- Equity multiple
- 3.52×
- Total profit
- $31,014
- Equity at exit
- $3,796
Cash invested: $12,292 (down + closing). Projections, not guarantees.
Landlord ↔ Tenant lean methodology
- Overall (STATE)
- 43 Moderately Tenant-Leaning
- State Illinois
- 43 Moderately Tenant-Leaning · D+7
- County
- — inherits STATE
- City
- — inherits STATE
ZIP-level market 61455
- Home prices YoY
- -33.3%
- Active inventory
- 135
- Price-to-rent
- 4.7×
Monthly cashflow live
- Estimated rent
- $784 medium interval (Pro) →
- Mortgage (P&I)
- −$230
- Tax from tax record
- −$102 /mo · $1,221/yr
- Insurance
- −$18
- HOA
- −$0
- Vacancy / Maint / Mgmt
- −$165
- Net cashflow
- $269
Break-even live
UW: 25.0% down · 7.5% · 30yr · 1.5% tax · 5.0% vac · 8.0% maint · 8.0% mgmt
Financing live
Cash to close
- Down payment
- $10,975
- Closing costs
- $1,317
- Reserves months
- —
- Total cash needed
- —
Loan-product check · same deal, 3 products live
Conventional
25% down · 7.5% · 30yr
- Down + closing
- —
- Monthly P&I
- —
- Monthly cashflow
- —
- DSCR
- —
- Eligible?
- —
Personal DTI + credit; lowest rate.
DSCR
20% down · 8.5% · 30yr
- Down + closing
- —
- Monthly P&I
- —
- Monthly cashflow
- —
- DSCR
- —
- Eligible?
- —
No personal income docs; deal must DSCR.
Hard money
10% down · 12.0% · 12mo
- Down + closing
- —
- Monthly P&I
- —
- Monthly cashflow
- —
- DSCR
- —
- Eligible?
- —
Short-term bridge; refi at stabilization.
Rent comps 2 comps
| Address | Beds | Baths | Sqft | Rent | $/sqft | DOM | Units | Dist |
|---|---|---|---|---|---|---|---|---|
| 303 S Dudley St Macomb, IL | 1.0 | 1.0 | 625 | $575 | $0.92 | 43d | 1 | 0.91mi |
| 902 N Charles St Macomb, IL | 2.0 | 1.5 | 840 | $695 | $0.83 | 43d | 1 | 1.38mi |
Listing history 16 events
-
2026-06-19days on market $43,900 Active 66 DOM
-
2026-06-18days on market $43,900 Active 65 DOM
-
2026-06-17days on market $43,900 Active 64 DOM
-
2026-06-16days on market $43,900 Active 63 DOM
-
2026-06-15days on market $43,900 Active 62 DOM
-
2026-06-14days on market $43,900 Active 60 DOM
-
2026-06-12days on market $43,900 Active 59 DOM
-
2026-06-09days on market $43,900 Active 56 DOM
-
2026-06-08days on market $43,900 Active 55 DOM
-
2026-06-07days on market $43,900 Active 54 DOM
-
2026-06-04days on market $43,900 Active 50 DOM
-
2026-06-02days on market $43,900 Active 49 DOM
-
2026-06-01days on market $43,900 Active 48 DOM
-
2026-05-31days on market $43,900 Active 47 DOM
-
2026-05-31days on market $43,900 Active 46 DOM
-
2026-04-14$43,900 Active 769-char remark
Show marketing remark (769 chars)
This 2 bedroom, 1 bath bungalow needs work but has good potential for the right buyer. The huge 15 x 21 kitchen was added in 2007 with plenty of cabinetry for all the storage you might need. Most appliances are included except the washer & dryer. There is a separate dining room that could also be used as part of the living area. One bedroom is on the main floor, with the 2nd being upstairs along with another room for use as to whatever the need might be. Flooring needs to be added throughout most of the home. Sitting on a large 60 x 174 lot with an alley behind makes a perfect spot for a garage. The covered front porch has newer decking and ready to be stained. If you're looking for a very affordable home and have handyman skills, this one may be for you!
ⓘ Source: listings_history table (triggers on properties + properties_extension) + one-shot
backfill from property_details.listing_events for pre-trigger history.
Tax reassessment forecast IL · Partial reset (capped growth)
- Current annual tax
- $1,221 · $102/mo
- Projected year-2 tax
- $1,221 · $102/mo
- Expected delta
- $0/yr ($0/mo · 0.0%)
ⓘ Screening estimate from a state-policy table — verify with the county assessor before closing.
Climate risk First Street
- Flood 1/10 Low 0% chance over 30 yrs
- Wildfire 1/10 Low
- Heat 3/10 Moderate 7 d/yr ≥107°F today · 17 d/yr by 30 yrs out
- Wind 2/10 Low
- Air quality 2/10 Low 1 unhealthy d/yr today · 1 by 30 yrs out
Nearby sold comps map
Loading sold comps map…
Walkable amenities ~0.75 mi
Loading nearby amenities…
Taxation est. · year 1
- Rental income
- $9,410
- − Mortgage interest
- −$2,459
- − Property taxes
- −$1,221
- − Insurance
- −$220
- − Repairs & maintenance
- −$753
- − Management
- −$753
- − Depreciation
- −$1,277
- Taxable income
- $2,727
- Est. tax owed @ 24.0%
- −$655
- After-tax cash flow
- $2,576/yr
For passive investors: Depreciation is non-cash, so a rental often shows a tax loss while cash-flowing — sheltering income. Rental losses are passive: they offset passive income freely, and up to $25,000/yr can offset ordinary (W-2) income if you actively participate and your MAGI is under $100k (phasing out to $0 by $150k); unused losses carry forward. On sale, claimed depreciation is recaptured at up to 25%, and gains may owe capital-gains tax (a 1031 exchange can defer both). Figures are a year-1 estimate at your 24.0% rate — not tax advice; consult a CPA.
Schools (NCES district)
- District
- Macomb CUSD 185
- NCES district ID
- 1723920
- Math proficiency
- 19% ▼ -7.00%
- Reading proficiency
- 26% ▼ -8.00%
- Median HH income
- $34,162
- Composite
- 18.45/100
- National rank
- #8927
- State rank
- #410 of 620 in IL
Livability — Macomb
- Score
- 70/100
- State rank
- #379
- US rank
- #7918
Category grades
Schools grade is shown separately in the Schools card above.
Census & demographics
- Census place
- Macomb, IL
- County
- McDonough County · 17,317 people
- City population
- 17,317
- Metro
- Macomb, IL
- Population (ZIP)
- 17,317
- Household income
- $48,679
- Rent vs Own
- Severe rent burden
- 1062.0
Population outlook (McDonough County) Hauer SSP2
- Today (2025)
- 33,242 people
- By 2030
- 33,318 · +0.2%
- By 2040
- 33,520 · +0.8%
- By 2050
- 33,630 · +1.2%
- By 2075
- 33,657 · +1.2%
- By 2100
- 33,127 · -0.3%
Race, ethnicity, and origin ACS 2023
- Neighborhood character
- Predominantly White (81%)
- Race & ethnicity
- White 81% Black 9% Two or more races 5% Hispanic / Latino 5% Asian 3%
- Common ancestry
- Romanian 3% Italian 3% Iranian 2%
- Foreign-born
- 4% · Canada, South Korea, China
- Languages at home
- 94% English-only · Spanish 2% Other Indo-European 1% Russian/Polish/Slavic 1%
Political lean MEDSL · McDonough
- 2024 margin
- R (+18.9) · D 39.7% · R 58.5% · Other 1.8%
- 2008→2024 swing
- -24.4pp toward R · 2008: 5.6pp · 2024: -18.9pp
- All cycles
- 2024: R+18.9 2020: R+16.6 2016: R+11.7 2012: R+1.5 2008: D+5.6
Not yet ingested
- Civics
- —
Market trends
- HPI YoY
- ▼ -70.20%
- Current HPI
- 140.4351
- Rent YoY
- —
- Metro
- Macomb, IL
- State GDP YoY
- ▲ 1.59%
- F500 in state
- 60
Industry mix (Fortune 500 HQ in IL)
| Industry | F500 HQs | Revenue |
|---|---|---|
| Insurance | 4 | $201B |
|
||
| Consumer Goods | 4 | $87B |
|
||
| Industrial Machinery | 3 | $64B |
|
||
| Healthcare | 2 | $55B |
|
||
| Retail / Pharmacy | 1 | $148B |
|
||
| Agriculture / Food | 1 | $86B |
|
||
Price history
1 event — show timeline
- 2026-04-14 Listed $43,900 RMLSA as Distributed by MLS Grid
Property tax history
+2.8%/yrLatest (2024): $1,221 · -0.0% YoY. Source: county tax records.
Cash-flow waterfall
monthlySold comps — $/sqft
last 12 mo · ≤1 miLoading sold comps…