 🏢 Co-op
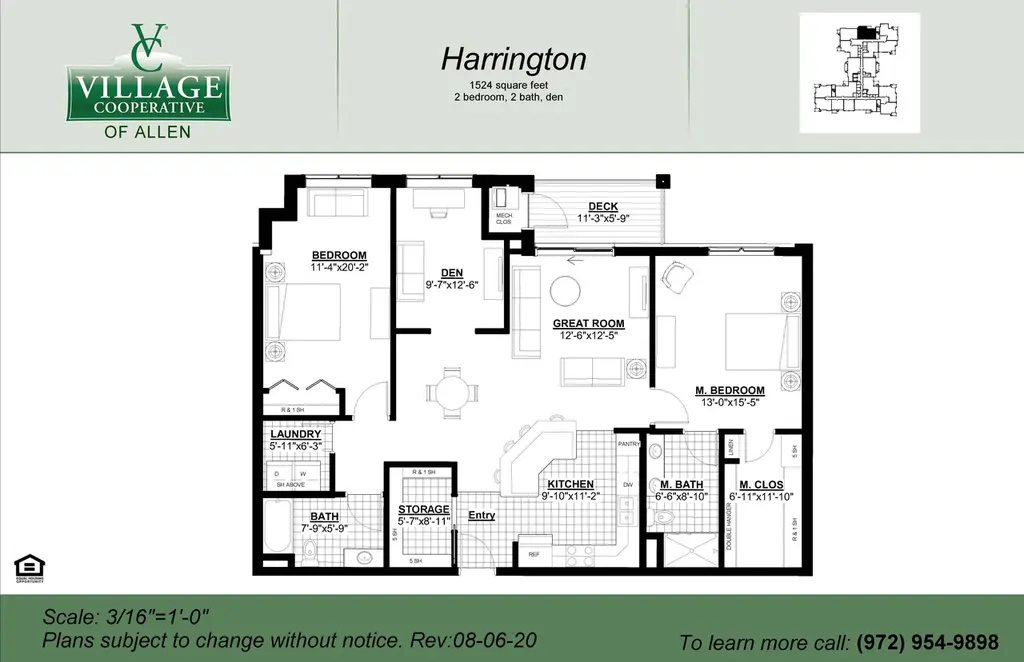
Harrington Plan · Allen, TX
Flood risk No data
- FEMA flood zone
- —
- Chance of flooding over 30 yrs
- —
- Est. flood insurance / yr
- —
Fire risk No data
- Est. fire insurance / yr
- —
Heat risk No data
- Hot days now (above threshold)
- —
- Hot days in 30 yrs
- —
Wind risk No data
- Chance of severe wind over 30 yrs
- —
Air-quality risk No data
- Unhealthy air days now
- —
- Unhealthy air days in 30 yrs
- —
Risk factors via First Street. Map © Google.
Why this score? — see what drove the F grade
The composite is a weighted blend of 9 inputs, each scored 0–100. Each bar is that input's sub-score; the figure is the points it added to the 100-point composite (weight × sub-score).
- ARV discount +7.5/15.0
- Schools +5.8/10.0
- Livability +4.0/5.0
- Rent growth +1.8/5.0
- Condition / age +1.0/5.0
- 1% rule +0.5/10.0
- Cash flow +0.0/30.0
- DSCR +0.0/10.0
- Appreciation +0.0/10.0
$249,000
🖨 Deal sheet 📄 Offer letter ✓ Due diligence
Listing remarks MLS
Regarded as one of the most desirable suburbs in the United States, Allen is absolutely one of the best places to live in Texas. With its dense suburban feel and numerous amenities, it's simply a great place to call home. And it is now open and home to our newest Village Cooperative and we are thrilled to bring this hassle-free home ownership option to active adults (62+) in the area! That's because the Village Cooperative of Allen offers a worry-free lifestyle to its member-owners. This housing option is built specifically for those who want to own their home but also want to work or retire without the headaches of maintenance, repairs and surprise bills that are associated with owning a house. Plus, you'll find the amenities, social opportunities and financial benefits just a few advantages of cooperative living.
Key facts
- 2 garage spots
- Listed 276 days
Neighborhood map
What this means for you Summary
Snapshot
- This is a 2-bed/2.0-bath condo listed at $249k. Condition is rated poor.
Deal economics
- At list price, monthly cash flow is $-3k ($-41k/yr) — negative.
- The deal already cash-flows at list — no discount required.
- To meet the 1% rule (rent ≥ 1% of price), the offer needs to be $227k (9.0% below list).
- Recommended offer: $219k (12.0% below list) — sets the bar for market timing.
- Cap rate -3.6% vs local median 2.6% in Allen — below-typical yield; the buyer is paying a premium for something (appreciation thesis, condition, location) that the cap rate doesn't capture.
Location & tenants
- Location reads 80/100 on livability (#34 in TX, #1,678 nationally) — a professional / high-income tenant draw. Strengths: crime A+, employment A+, housing A+; Watch: cost of living C-, commute F.
- Allen ISD (suburban): math 64% / reading 63% proficiency, ranked #22 of 826 in TX (top 3%) — acceptable for families but not a draw, mixed tenant base, ~2y average lease; only 16% free/reduced lunch — higher-income household profile.
- Market conditions: Rents soft (-3.0%/yr); 374 active listings in the ZIP; 40 comparable units currently listed for rent nearby; rentals at typical pace (median 25d on market — plan ~3-4 weeks tenant-placement turnaround); high-income renter base; 19,194 units permitted in Collin County in 2024 (3,988 in 5+ unit buildings).
Forward outlook
- Local home prices are declining (-3.0%/yr); year-one equity from $3k of loan paydown is wiped out by about $12k of value loss. Plan a longer hold.
- Collin County population projected at +60% by 2050 — long-run rental-demand tailwind backs the buy-and-hold thesis.
Negotiation context
- It's been on market 277 days — a 12% lower offer ($219k) is reasonable based on typical stale-listing flexibility.
Risks & watch-outs
- Watch-outs: HOA is 104% of rent.
Questions for the listing agent
- What do current leases actually rent for vs. the listed asking? Can we see a recent rent roll and the last 12 months of T-12 income?
- It's been on market 277 days. Have you received any prior offers? Is the seller open to a 12% concession, seller financing, or rate buy-down credit?
- Have any recent inspections been done? Can we get a copy of the seller's disclosures and any deferred-maintenance estimates?
- What does the HOA fee cover, when was the last increase, and are there any pending special assessments or reserve-fund shortfalls?
- Any open or pending special assessments — roof, HVAC, plumbing, elevator, façade? What's the per-unit balance and payoff schedule, and is the seller paying it off at close or rolling it to the buyer?
- Why hasn't it sold? Are there any deal-killer items the seller is aware of (foundation, flood, title, zoning, code violations)?
- Is there a deadline driving the sale (1031 exchange, divorce, estate, relocation)? That informs how much negotiation room exists.
- Schools are A-rated — typically a magnet for longer-tenancy family renters. What's the average tenant stay here, and is there a school-zone premium baked into asking?
- The area grade is low — what's the realistic commute time and amenity access for the typical tenant pool here? Any planned neighborhood developments (good or bad) we should know about?
- What's the average days-on-market for RENTAL listings here right now (not sales)? A rising rental-DOM trend means longer vacancies and softer asking-rent achievability than the comps imply.
- What's the recent tenant-quality profile in this submarket — average credit score on applications, eviction rate, late-payment / NSF rate, and stable-employment percentage? A property-management company in the area should have these aggregated.
- How much new apartment / multifamily construction is in the pipeline within 1–3 miles? Heavy new supply (>2% of stock underway) typically softens rents 12–24 months out; light construction supports rent growth.
Investment metrics
- 1% rule
- 0.55% ✗
- Cap rate
- -3.62%
- Cash-on-cash
- -35.41%
- DSCR
- -0.58
- GRM
- 15.1
CMA / ARV
- ARV (median comp)
- $411,095
- List price
- $249,000
- Delta
- -39.43%
- Verdict
- UNDERPRICED
- Comps
- 20 within 1.0 mi
Projected returns pro-forma
-3.0% appreciation · 0.0% rent growth · sell at horizon
- IRR
- —
- Equity multiple
- -1.50×
- Total profit
- $-288,096
- Equity at exit
- $61,296
- IRR
- —
- Equity multiple
- -3.77×
- Total profit
- $-549,076
- Equity at exit
- $35,544
Cash invested: $115,107 (down + closing). Projections, not guarantees.
Landlord ↔ Tenant lean methodology
- Overall (STATE)
- 87 Strongly Landlord-Friendly
- State Texas
- 87 Strongly Landlord-Friendly · R+5
- County
- — inherits STATE
- City
- — inherits STATE
ZIP-level market 75013
- Home prices YoY
- -23.4%
- Rents YoY
- -3.0%
- Active inventory
- 374
- Price-to-rent
- 9.2×
Monthly cashflow live
- Estimated rent
- $2,265 high interval (Pro) →
- Mortgage (P&I)
- −$2,156
- Tax est. 1.5%
- −$514 /mo · $6,166/yr
- Insurance
- −$171
- HOA est. from 1 same-building comp
- −$2,345
- Vacancy / Maint / Mgmt
- −$476
- Net cashflow
- $-3,396
Break-even live
UW: 25.0% down · 7.5% · 30yr · 1.5% tax · 5.0% vac · 8.0% maint · 8.0% mgmt
Financing live
Cash to close
- Down payment
- $102,774
- Closing costs
- $12,333
- Reserves months
- —
- Total cash needed
- —
Loan-product check · same deal, 3 products live
Conventional
25% down · 7.5% · 30yr
- Down + closing
- —
- Monthly P&I
- —
- Monthly cashflow
- —
- DSCR
- —
- Eligible?
- —
Personal DTI + credit; lowest rate.
DSCR
20% down · 8.5% · 30yr
- Down + closing
- —
- Monthly P&I
- —
- Monthly cashflow
- —
- DSCR
- —
- Eligible?
- —
No personal income docs; deal must DSCR.
Hard money
10% down · 12.0% · 12mo
- Down + closing
- —
- Monthly P&I
- —
- Monthly cashflow
- —
- DSCR
- —
- Eligible?
- —
Short-term bridge; refi at stabilization.
Rent comps 40 comps
| Address | Beds | Baths | Sqft | Rent | $/sqft | DOM | Units | Dist |
|---|---|---|---|---|---|---|---|---|
| 1006 Stockton Dr Allen, TX | 3.0 | 2.5 | 1859 | $2,800 | $1.51 | 24d | 1 | 0.12mi |
| 1226 Junction Dr Allen, TX | 3.0 | 3.0 | 1859 | $2,799 | $1.51 | 44d | 1 | 0.23mi |
| 1226 Junction Dr Allen, TX | 3.0 | 3.0 | 1840 | $2,799 | $1.52 | 24d | 1 | 0.23mi |
| 612 Club Dr Allen, TX | 3.0 | 2.5 | 1913 | $2,650 | $1.39 | 44d | 1 | 0.48mi |
| 979 Emil Pl Allen, TX | 2.0 | 2.5 | 1467 | $2,350 | $1.60 | 24d | 1 | 0.50mi |
| 860 Junction Dr Allen, TX | 1.0–2.0 | 1.0–2.0 | 1007 | $3,023 | $3.00 | 8d | 21 | 0.71mi |
| 1090 W Exchange Pkwy Allen, TX | 1.0–2.0 | 1.0–2.0 | 971 | $2,125 | $2.19 | 2d | 60 | 0.71mi |
| 875 Merino Dr Allen, TX | 3.0 | 2.5 | 1839 | $2,650 | $1.44 | 44d | 1 | 0.72mi |
| 880 Merino Dr Allen, TX | 3.0 | 3.5 | 2211 | $2,850 | $1.29 | 20d | 1 | 0.73mi |
| 1946 Sweetwater Ln Allen, TX | 3.0 | 2.5 | 1810 | $2,695 | $1.49 | 19d | 1 | 0.77mi |
| 1845 Chelsea Blvd Allen, TX | 1.0–2.0 | 1.0–2.0 | 875 | $1,835 | $2.10 | 2d | 17 | 0.78mi |
| 1963 Sweetwater Ln Allen, TX | 3.0 | 2.5 | 1986 | $2,895 | $1.46 | 24d | 1 | 0.79mi |
| 1962 Sweetwater Ln Allen, TX | 3.0 | 2.5 | 1890 | $2,850 | $1.51 | 24d | 1 | 0.80mi |
| 1089 W Exchange Pkwy Allen, TX | 1.0–3.0 | 1.0–2.0 | 1011 | $1,728 | $1.71 | 1d | 21 | 0.80mi |
| 729 Junction Dr Allen, TX | 1.0–3.0 | 1.0–2.0 | 1100 | $1,992 | $1.81 | 2d | 19 | 0.88mi |
| 705 Bray Central Dr Allen, TX | 1.0–3.0 | 1.0–2.0 | 1050 | $1,676 | $1.60 | 2d | 1 | 0.89mi |
| 1096 W Exchange Pkwy Allen, TX | 2.0 | 2.0 | 1104 | $1,745 | $1.58 | 44d | 1 | 0.92mi |
| 1095 W Exchange Pkwy Allen, TX | 2.0 | 2.0 | 1125 | $1,720 | $1.53 | 44d | 1 | 0.95mi |
| 403 Daisy Dr Allen, TX | 3.0 | 2.0 | 1647 | $2,090 | $1.27 | 19d | 1 | 0.97mi |
| 403 Daisy Dr Allen, TX | 3.0 | 2.0 | 1647 | $2,200 | $1.34 | 44d | 1 | 0.97mi |
| 505 Benton Dr Unit 538 Allen, TX | 3.0 | 2.0 | 1262 | $2,251 | $1.78 | 16d | 1 | 1.00mi |
| 505 Benton Dr Unit 3121 Allen, TX | 3.0 | 2.0 | 1262 | $2,175 | $1.72 | 3d | 1 | 1.00mi |
| 651 N Watters Rd #7101 Allen, TX | 2.0 | 2.0 | 1884 | $2,450 | $1.30 | 24d | 1 | 1.01mi |
| 659 Junction Dr Allen, TX | 1.0–2.0 | 1.0–2.0 | 963 | $1,900 | $1.97 | 2d | 37 | 1.01mi |
| 1400 Andrews Pkwy Unit 2121 Allen, TX | 2.0 | 2.0 | 1073 | $2,004 | $1.87 | 3d | 1 | 1.06mi |
| 1400 Andrews Pkwy Unit 3121 Allen, TX | 3.0 | 2.0 | 1364 | $2,616 | $1.92 | 3d | 1 | 1.06mi |
| 1400 Andrews Pkwy Unit 1437 Allen, TX | 2.0 | 2.0 | 1073 | $2,036 | $1.90 | 11d | 1 | 1.06mi |
| 1400 Andrews Pkwy Unit 1433 Allen, TX | 3.0 | 2.0 | 1364 | $2,659 | $1.95 | 5d | 1 | 1.06mi |
| 1951 Painted Trail Dr Allen, TX | 2.0–3.0 | 2.0–3.5 | 1759 | $2,915 | $1.66 | 2d | 82 | 1.13mi |
| 511 Benton Dr Allen, TX | 3.0 | 2.0 | 1262 | $1,836 | $1.45 | 44d | 1 | 1.14mi |
| 1038 Audrey Way Allen, TX | 3.0 | 2.5 | 1855 | $2,750 | $1.48 | 24d | 1 | 1.18mi |
| 505 E Exchange Pkwy Apt 8303 Allen, TX | 2.0 | 2.0 | 1136 | $1,909 | $1.68 | 44d | 1 | 1.21mi |
| 505 E Exchange Pkwy Unit 538 Allen, TX | 3.0 | 2.0 | 1298 | $1,835 | $1.41 | 44d | 1 | 1.22mi |
| 505 E Exchange Pkwy Unit 528 Allen, TX | 2.0 | 2.0 | 1074 | $1,741 | $1.62 | 3d | 1 | 1.22mi |
| 505 E Exchange Pkwy Apt 8210 Allen, TX | 2.0 | 2.0 | 1136 | $1,904 | $1.68 | 44d | 1 | 1.22mi |
| 505 E Exchange Pkwy Unit 3118 Allen, TX | 3.0 | 2.0 | 1298 | $2,386 | $1.84 | 3d | 1 | 1.22mi |
| 505 E Exchange Pkwy Unit 08104 Allen, TX | 2.0 | 2.0 | 1136 | $1,889 | $1.66 | 24d | 1 | 1.22mi |
| 505 E Exchange Pkwy Unit 10202 Allen, TX | 2.0 | 2.0 | 1074 | $1,908 | $1.78 | 44d | 1 | 1.22mi |
| 505 E Exchange Pkwy Unit 06305 Allen, TX | 2.0 | 2.0 | 1136 | $1,969 | $1.73 | 44d | 1 | 1.22mi |
| 505 E Exchange Pkwy Unit 10304 Allen, TX | 2.0 | 2.0 | 1074 | $1,729 | $1.61 | 44d | 1 | 1.22mi |
HOA detail condo
- Monthly dues
- $0 · $0/yr
- Assessments
- None detected in remarks — confirm with the listing agent.
Listing history 16 events
-
2026-06-18days on market $249,000 Active 277 DOM
-
2026-06-17days on market $249,000 Active 276 DOM
-
2026-06-16days on market $249,000 Active 275 DOM
-
2026-06-15days on market $249,000 Active 274 DOM
-
2026-06-13days on market $249,000 Active 272 DOM
-
2026-06-13days on market $249,000 Active 271 DOM
-
2026-06-09days on market $249,000 Active 268 DOM
-
2026-06-08days on market $249,000 Active 267 DOM
-
2026-06-07days on market $249,000 Active 266 DOM
-
2026-06-04days on market $249,000 Active 263 DOM
-
2026-06-03days on market $249,000 Active 262 DOM
-
2026-06-02days on market $249,000 Active 261 DOM
-
2026-06-01days on market $249,000 Active 260 DOM
-
2026-05-31days on market $249,000 Active 259 DOM
-
2026-01-21price $249,000 827-char remark
Show marketing remark (827 chars)
Regarded as one of the most desirable suburbs in the United States, Allen is absolutely one of the best places to live in Texas. With its dense suburban feel and numerous amenities, it's simply a great place to call home. And it is now open and home to our newest Village Cooperative and we are thrilled to bring this hassle-free home ownership option to active adults (62+) in the area! That's because the Village Cooperative of Allen offers a worry-free lifestyle to its member-owners. This housing option is built specifically for those who want to own their home but also want to work or retire without the headaches of maintenance, repairs and surprise bills that are associated with owning a house. Plus, you'll find the amenities, social opportunities and financial benefits just a few advantages of cooperative living.
-
2025-09-14$243,000 Active 827-char remark
Show marketing remark (827 chars)
Regarded as one of the most desirable suburbs in the United States, Allen is absolutely one of the best places to live in Texas. With its dense suburban feel and numerous amenities, it's simply a great place to call home. And it is now open and home to our newest Village Cooperative and we are thrilled to bring this hassle-free home ownership option to active adults (62+) in the area! That's because the Village Cooperative of Allen offers a worry-free lifestyle to its member-owners. This housing option is built specifically for those who want to own their home but also want to work or retire without the headaches of maintenance, repairs and surprise bills that are associated with owning a house. Plus, you'll find the amenities, social opportunities and financial benefits just a few advantages of cooperative living.
ⓘ Source: listings_history table (triggers on properties + properties_extension) + one-shot
backfill from property_details.listing_events for pre-trigger history.
Nearby sold comps map
Loading sold comps map…
Walkable amenities ~0.75 mi
Loading nearby amenities…
Taxation est. · year 1
- Rental income
- $27,184
- − Mortgage interest
- −$23,028
- − Property taxes
- −$6,166
- − Insurance
- −$2,055
- − Repairs & maintenance
- −$2,175
- − Management
- −$2,175
- − HOA
- −$28,140
- − Depreciation
- −$11,959
- Taxable loss
- −$48,514
- Est. tax savings @ 24.0%
- +$11,643
- After-tax cash flow
- $-29,113/yr
For passive investors: Depreciation is non-cash, so a rental often shows a tax loss while cash-flowing — sheltering income. Rental losses are passive: they offset passive income freely, and up to $25,000/yr can offset ordinary (W-2) income if you actively participate and your MAGI is under $100k (phasing out to $0 by $150k); unused losses carry forward. On sale, claimed depreciation is recaptured at up to 25%, and gains may owe capital-gains tax (a 1031 exchange can defer both). Figures are a year-1 estimate at your 24.0% rate — not tax advice; consult a CPA.
Condition & rehab AI · 2 photos
The property appears to be in a poor condition with significant repairs and maintenance needed, including roof and exterior work, and landscaping improvements. These issues significantly impact its value and should be addressed to increase its resale or rental potential.
Repairs flagged
- Major roof — The roof footprint is visible, but no specific details about the roof condition can be determined from the satellite image.
- Major exterior — The satellite image shows a large, open lot with no visible structures or landscaping.
- Major landscaping — The satellite image shows a large, open lot with no visible landscaping or curb appeal.
Value-add opportunities
- Both landscaping and curb appeal — Enhancing the landscaping and curb appeal would improve the home's visual appeal and potentially increase its value for both resale and rental.
- Both roof and exterior repairs — Addressing the roof and exterior issues would improve the home's structural integrity and overall appearance, enhancing its value for both resale and rental.
Renovation cost estimate screening
| Repair item | Severity | Est. cost |
|---|---|---|
| roof · The roof footprint is visible, but no specific details about the roof condition can be determined from the satellite image. | Major | $15,000–50,000 |
| exterior · The satellite image shows a large, open lot with no visible structures or landscaping. | Major | $15,000–50,000 |
| landscaping · The satellite image shows a large, open lot with no visible landscaping or curb appeal. | Major | $15,000–50,000 |
| Total estimated repair cost · 3 items | $45,000–150,000 |
Value-add ROI direction
- Both landscaping and curb appeal — Enhancing the landscaping and curb appeal would improve the home's visual appeal and potentially increase its value for both resale and rental. ↑
- Both roof and exterior repairs — Addressing the roof and exterior issues would improve the home's structural integrity and overall appearance, enhancing its value for both resale and rental. ↑
ⓘ Cost ranges are severity-bucket heuristics (US national rule-of-thumb). Get contractor quotes + a written scope before underwriting a rehab budget.
Schools (NCES district)
- District
- Allen ISD
- NCES district ID
- 4807890
- Math proficiency
- 64% ▼ -12.00%
- Reading proficiency
- 63% ▼ -9.00%
- Median HH income
- $96,635
- Composite
- 58.45/100
- National rank
- #1004
- State rank
- #22 of 826 in TX
Livability — Allen
- Score
- 80/100
- State rank
- #34
- US rank
- #1678
Category grades
Schools grade is shown separately in the Schools card above.
Census & demographics
- Census place
- Allen, TX
- County
- Collin County · 1,159,394 people
- City population
- 124,853
- Metro
- Dallas-Fort Worth-Arlington, TX
- Population (ZIP)
- 49,796
- Household income
- $146,891
- Rent vs Own
- Severe rent burden
- 1574.0
Population outlook (Collin County) Hauer SSP2
- Today (2025)
- 1,210,074 people
- By 2030
- 1,358,201 · +12.2%
- By 2040
- 1,654,061 · +36.7%
- By 2050
- 1,937,359 · +60.1%
- By 2075
- 2,567,039 · +112.1%
- By 2100
- 2,952,048 · +144.0%
Race, ethnicity, and origin ACS 2023
- Neighborhood character
- Diverse neighborhood (Simpson 0.65)
- Race & ethnicity
- White 50% Asian 30% Hispanic / Latino 10% Two or more races 8% Black 6%
- Hispanic origin (detail)
- Mexican 6%
- Common ancestry
- Romanian 2% Lithuanian 2% Slovak 2%
- Foreign-born
- 26% · China, Canada, South Korea
- Languages at home
- 65% English-only · Other Indo-European 8% Chinese 7% Spanish 6%
Political lean MEDSL · Collin
- 2024 margin
- R (+11.1) · D 43.1% · R 54.3% · Other 2.6%
- 2008→2024 swing
- +14.4pp toward D · 2008: -25.6pp · 2024: -11.1pp
- All cycles
- 2024: R+11.1 2020: R+4.3 2016: R+17.0 2012: R+31.6 2008: R+25.6
Not yet ingested
- Civics
- —
Market trends
- HPI YoY
- ▼ -68.74%
- Current HPI
- 225.417
- Rent YoY
- ▼ -2.97%
- Metro
- Dallas-Fort Worth-Arlington, TX
- State GDP YoY
- ▲ 3.95%
- F500 in state
- 110
Industry mix (Fortune 500 HQ in TX)
| Industry | F500 HQs | Revenue |
|---|---|---|
| Energy | 16 | $1,198B |
|
||
| Technology | 5 | $198B |
|
||
| Engineering / Construction | 4 | $72B |
|
||
| Energy Services | 3 | $60B |
|
||
| Utilities | 3 | $41B |
|
||
| Healthcare | 2 | $330B |
|
||
Price history
+2.5% since first listed2 events — show timeline
- 2026-01-21 Price Changed $249,000 Zillow
- 2025-09-14 Listed $243,000 Zillow
Cash-flow waterfall
monthlySold comps — $/sqft
last 12 mo · ≤1 miLoading sold comps…