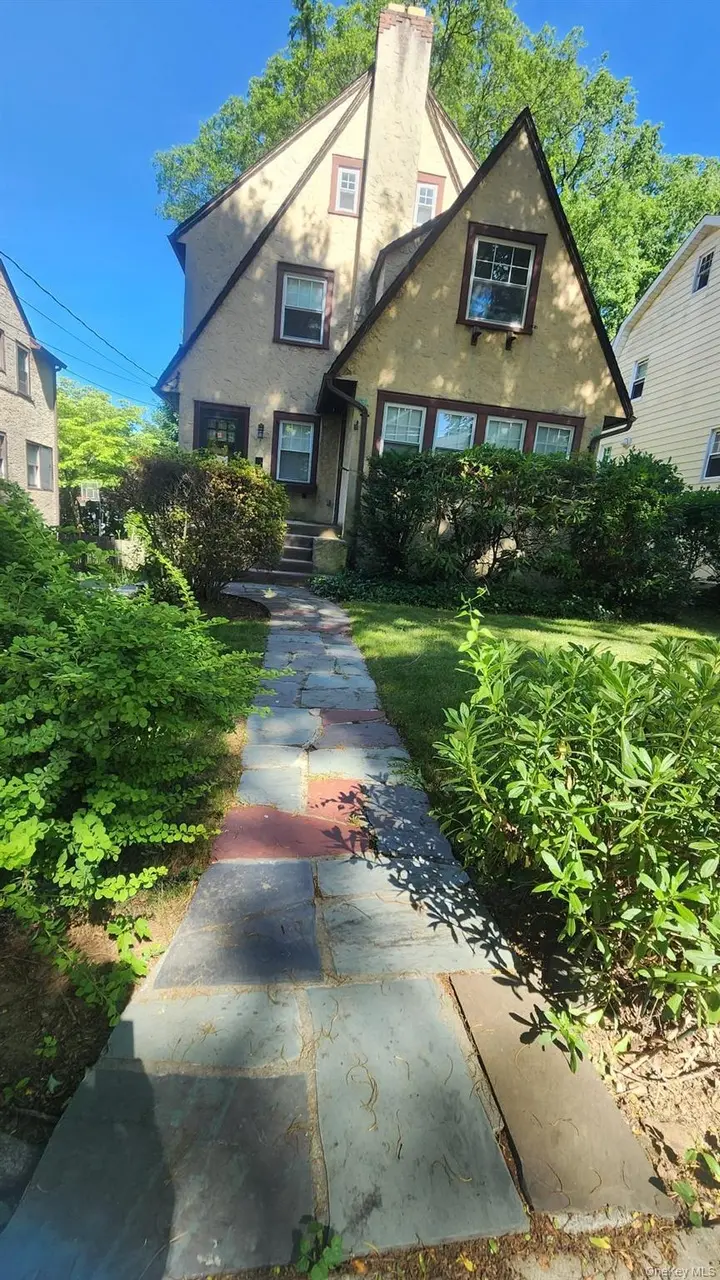
72 Archer Dr · Eastchester, NY
Flood risk 1/10 · Minimal
- FEMA flood zone
- X (unshaded)
- Chance of flooding over 30 yrs
- 0.0%
- Est. flood insurance / yr
- $507 – $1,088
Fire risk 1/10 · Minimal
- Est. fire insurance / yr
- $691 – $1,283
Heat risk 6/10 · Moderate
- Hot days now (above 98°F)
- 7 days/yr
- Hot days in 30 yrs
- 15 days/yr
Wind risk 6/10 · Moderate
- Chance of severe wind over 30 yrs
- 27.0%
Air-quality risk 5/10 · Moderate
- Unhealthy air days now
- 6 days/yr
- Unhealthy air days in 30 yrs
- 8 days/yr
Risk factors via First Street. Map © Google.
Why this score? — see what drove the D+ grade
The composite is a weighted blend of 9 inputs, each scored 0–100. Each bar is that input's sub-score; the figure is the points it added to the 100-point composite (weight × sub-score).
- ARV discount +15.0/15.0
- Cash flow +10.0/30.0
- Schools +6.4/10.0
- 1% rule +4.2/10.0
- Livability +3.9/5.0
- Rent growth +3.6/5.0
- DSCR +2.9/10.0
- Condition / age +2.5/5.0
- Appreciation +0.0/10.0
$769,000
🖨 Deal sheet 📄 Offer letter ✓ Due diligence
Listing remarks
Contract Vendee, As-Is, Large 4 Bedroom Tudor, hardwood floors, full basement and garage in Tuckahoe SD!
Key facts
- 4,809 sq ft lot
- Garage
- Built 1950
Property features AI
Exterior
- Parking: Driveway; 1-car garage
- Utilities: Public sewer; Electricity connected
- Home design: Single family residence
- Construction: Frame construction
- Exterior features: Frame construction; Not waterfront
Interior
- Kitchen: No appliances listed
- Bedrooms: Total of 8 rooms (bedroom count not specified)
- Bathrooms: 1 full bathroom
- Heating & cooling: Steam heating; No central air conditioning
- Interior features: Full unfinished basement; Attic with stairs; Fireplace
- Laundry & utility: No laundry appliances listed
Neighborhood map
What this means for you Summary
Snapshot
- This is a 4-bed/1.0-bath single-family listed at $769k.
Deal economics
- At list price, monthly cash flow is $-462 ($-6k/yr) — negative.
- To cash-flow at today's rent, offer at most $687k (10.6% below list).
- To meet the 1% rule (rent ≥ 1% of price), the offer needs to be $704k (8.5% below list).
- Recommended offer: $687k (10.6% below list) — sets the bar for cash-flow.
- Cap rate 5.6% vs local median 4.2% in Eastchester — top-decile yield for the area; either an underpriced asset or a hidden risk that comps aren't pricing in. Stress-test before assuming the spread holds.
Location & tenants
- Location reads 78/100 on livability (#159 in NY, #2,451 nationally) — a middle-class / working-renter tenant base. Strengths: crime A+, commute A+, employment A+; Watch: amenities D-, cost of living F, health & safety D-.
- Tuckahoe Union Free School District (suburban): math 71% / reading 69% proficiency, ranked #133 of 755 in NY (top 18%) — strong family-tenant draw, lease renewals of 3-5y typical; only 12% free/reduced lunch — higher-income household profile.
- Zoned schools: William E Cottle School (math 84% / reading 74%, grade A, #188 of 2,108 statewide, top 11%, 528 students, 17% FRL); Tuckahoe Middle School (math 50% / reading 70%, grade B, #161 of 729 statewide, top 24%, 278 students, 18% FRL); Tuckahoe High School (math 95%, 292 students, 23% FRL).
- Market conditions: Rents rising fast (+4.3%/yr); 245 active listings in the ZIP; 6 comparable units currently listed for rent nearby; rentals leasing fast (median 8d on market — plan ~1-2 weeks tenant-placement turnaround); high-income renter base; 954 units permitted in Westchester County in 2024 (649 in 5+ unit buildings).
- At $7,039/mo this rent would consume 67% of the median local household income ($126k/yr) (locally 357% of renters already pay >50% of income on rent) — very limited rent-growth headroom before tenants either downsize or default.
Forward outlook
- Local home prices are declining (-3.0%/yr); year-one equity from $5k of loan paydown is wiped out by about $23k of value loss. Plan a longer hold.
- Westchester County population projected at +10% by 2050 — modest demand growth; plan on rents tracking national, not racing it.
Negotiation context
- Only 10 days on market — expect competitive offers; lowballing is unlikely to land.
Risks & watch-outs
- Watch-outs: property tax is 2.6% of price; built in 1950 — expect roof / HVAC / electrical / plumbing capex.
- Climate carrying-cost: major wind risk, 27% chance of damaging wind over 30y; extreme-heat days projected 7→15/yr by 2055 (HVAC capex compounding) — expect insurance premiums to compound above CPI over the hold.
Questions for the listing agent
- What do current leases actually rent for vs. the listed asking? Can we see a recent rent roll and the last 12 months of T-12 income?
- Built in 1950 — when were the roof, HVAC, electrical panel, plumbing, and water heater last replaced?
- Property tax is high relative to price — has the assessment been appealed recently, and will the sale trigger a re-assessment?
- Is there a deadline driving the sale (1031 exchange, divorce, estate, relocation)? That informs how much negotiation room exists.
- Schools are A-rated — typically a magnet for longer-tenancy family renters. What's the average tenant stay here, and is there a school-zone premium baked into asking?
- The area grade is low — what's the realistic commute time and amenity access for the typical tenant pool here? Any planned neighborhood developments (good or bad) we should know about?
- What's the average days-on-market for RENTAL listings here right now (not sales)? A rising rental-DOM trend means longer vacancies and softer asking-rent achievability than the comps imply.
- What's the recent tenant-quality profile in this submarket — average credit score on applications, eviction rate, late-payment / NSF rate, and stable-employment percentage? A property-management company in the area should have these aggregated.
- How much new for-sale + rental construction is in the pipeline within 1–3 miles? Heavy new supply typically softens prices + rents 12–24 months out; constrained supply supports both.
Investment metrics
- 1% rule
- 0.92% ✗
- Cap rate
- 5.57%
- Cash-on-cash
- -2.57%
- DSCR
- 0.89
- GRM
- 9.1
CMA / ARV
- ARV (on-the-fly)
- $940,000
- Comps found
- 12
Show comp detail 12 sales within ~0.75 mi
| Address | Dist | Beds/Ba | Sqft | Sold | Price | $/sf | Match |
|---|---|---|---|---|---|---|---|
| 60 Westwood Ave | 0.32mi | 3/1.5 (-1) | 2,004 (+0%) | 0mo | $850,000 | $424 | 78 |
| 76 Parkview Dr | 0.11mi | 3/1.5 (-1) | 1,850 (-8%) | 9mo | $850,000 | $459 | 68 |
| 7 Central Dr | 0.15mi | 3/2.5 (-1) | 2,089 (+4%) | 8mo | $975,000 | $467 | 68 |
| 676 Webster Ave | 0.54mi | 3/2.5 (-1) | 2,036 (+2%) | 1mo | $850,110 | $418 | 60 |
| 77 Interlaken Ave | 0.37mi | 4/2.5 | 1,850 (-8%) | 9mo | $870,000 | $470 | 57 |
| 58 Hillside Ave | 0.74mi | 4/1.5 | 1,925 (-4%) | 1mo | $870,000 | $452 | 56 |
| 19 Glenorchy Pl | 0.38mi | 3/1.0 (-1) | 1,844 (-8%) | 10mo | $700,000 | $380 | 56 |
| 147 Norman Rd | 0.39mi | 3/2.5 (-1) | 1,776 (-11%) | 1mo | $1,101,776 | $620 | 52 |
| 466 California Rd | 0.23mi | 3/2.5 (-1) | 1,713 (-14%) | 5mo | $959,230 | $560 | 50 |
| 87 Inverness Rd | 0.59mi | 3/2.0 (-1) | 1,716 (-14%) | 2mo | $1,101,000 | $642 | 38 |
| 111 Berrian Rd | 0.65mi | 3/3.0 (-1) | 2,254 (+13%) | 1mo | $1,550,000 | $688 | 35 |
| 10 Poplar Ave | 0.56mi | 3/2.5 (-1) | 1,700 (-15%) | 5mo | $1,355,000 | $797 | 34 |
Match score weights: distance 35% · size 25% · config 20% · recency 20%. Top-matched comps best support the ARV.
Projected returns pro-forma
-3.0% appreciation · 4.27% rent growth · sell at horizon
- IRR
- -18.9%
- Equity multiple
- 0.33×
- Total profit
- $-144,370
- Equity at exit
- $114,660
- IRR
- -8.6%
- Equity multiple
- 0.43×
- Total profit
- $-123,031
- Equity at exit
- $66,489
Cash invested: $215,320 (down + closing). Projections, not guarantees.
Landlord ↔ Tenant lean methodology
- Overall (STATE)
- 15 Strongly Tenant-Friendly
- State New York
- 15 Strongly Tenant-Friendly · D+10
- County
- — inherits STATE
- City
- — inherits STATE
ZIP-level market 10708
- Rents YoY
- 4.3%
- Active inventory
- 245
- Price-to-rent
- 9.1×
Monthly cashflow live
- Estimated rent
- $7,039 high interval (Pro) →
- Mortgage (P&I)
- −$4,033
- Tax from tax record
- −$1,669 /mo · $20,028/yr
- Insurance
- −$320
- HOA
- −$0
- Vacancy / Maint / Mgmt
- −$1,478
- Net cashflow
- $-462
Break-even live
UW: 25.0% down · 7.5% · 30yr · 1.5% tax · 5.0% vac · 8.0% maint · 8.0% mgmt
Financing live
Cash to close
- Down payment
- $192,250
- Closing costs
- $23,070
- Reserves months
- —
- Total cash needed
- —
Loan-product check · same deal, 3 products live
Conventional
25% down · 7.5% · 30yr
- Down + closing
- —
- Monthly P&I
- —
- Monthly cashflow
- —
- DSCR
- —
- Eligible?
- —
Personal DTI + credit; lowest rate.
DSCR
20% down · 8.5% · 30yr
- Down + closing
- —
- Monthly P&I
- —
- Monthly cashflow
- —
- DSCR
- —
- Eligible?
- —
No personal income docs; deal must DSCR.
Hard money
10% down · 12.0% · 12mo
- Down + closing
- —
- Monthly P&I
- —
- Monthly cashflow
- —
- DSCR
- —
- Eligible?
- —
Short-term bridge; refi at stabilization.
Rent comps 6 comps
| Address | Beds | Baths | Sqft | Rent | $/sqft | DOM | Units | Dist |
|---|---|---|---|---|---|---|---|---|
| 15 Hillside Rd Bronxville, NY | 5.0 | 3.5 | 2750 | $13,500 | $4.91 | 2d | 1 | 0.70mi |
| 72 Chauncey Ave New Rochelle, NY | 5.0 | 1.0 | 2406 | $4,500 | $1.87 | 22d | 1 | 0.96mi |
| 375 Hawthorne Ter Mount Vernon, NY | 3.0 | 3.5 | 1975 | $10,000 | $5.06 | 1d | 1 | 1.03mi |
| 222 Lorraine Ave Mount Vernon, NY | 4.0 | 1.5 | 1948 | $5,500 | $2.82 | 7d | 1 | 1.09mi |
| 106 Pelhamdale Ave Mount Vernon, NY | 3.0 | 2.0 | 2699 | $3,300 | $1.22 | 6d | 1 | 1.48mi |
| 222 Primrose Ave Unit 2 Mt Vernon, NY | 5.0 | 2.0 | 1900 | $5,250 | $2.76 | 19d | 1 | 1.49mi |
Listing history 8 events
-
2026-06-18days on market $769,000 Active 10 DOM
-
2026-06-17days on market $769,000 Active 9 DOM
-
2026-06-16days on market $769,000 Active 8 DOM
-
2026-06-15days on market $769,000 Active 7 DOM
-
2026-06-13days on market $769,000 Active 5 DOM
-
2026-06-13days on market $769,000 Active 4 DOM
-
2026-06-09remarks 104-char remark
-
2026-06-09$769,000 Active 1 DOM
ⓘ Source: listings_history table (triggers on properties + properties_extension) + one-shot
backfill from property_details.listing_events for pre-trigger history.
Tax reassessment forecast NY · Partial reset (capped growth)
- Current annual tax
- $20,028 · $1,669/mo
- Projected year-2 tax
- $20,028 · $1,669/mo
- Expected delta
- $0/yr ($0/mo · 0.0%)
ⓘ Screening estimate from a state-policy table — verify with the county assessor before closing.
Climate risk First Street
- Flood 1/10 Low FEMA zone X (unshaded) · 0% chance over 30 yrs
- Wildfire 1/10 Low
- Heat 6/10 Major 7 d/yr ≥98°F today · 15 d/yr by 30 yrs out
- Wind 6/10 Major 27% chance of damaging wind over 30 yrs
- Air quality 5/10 Major 6 unhealthy d/yr today · 8 by 30 yrs out
Nearby sold comps map
Loading sold comps map…
Walkable amenities ~0.75 mi
Loading nearby amenities…
Taxation est. · year 1
- Rental income
- $84,462
- − Mortgage interest
- −$43,076
- − Property taxes
- −$20,028
- − Insurance
- −$3,845
- − Repairs & maintenance
- −$6,757
- − Management
- −$6,757
- − Depreciation
- −$22,371
- Taxable loss
- −$18,372
- Est. tax savings @ 24.0%
- +$4,409
- After-tax cash flow
- $-1,132/yr
For passive investors: Depreciation is non-cash, so a rental often shows a tax loss while cash-flowing — sheltering income. Rental losses are passive: they offset passive income freely, and up to $25,000/yr can offset ordinary (W-2) income if you actively participate and your MAGI is under $100k (phasing out to $0 by $150k); unused losses carry forward. On sale, claimed depreciation is recaptured at up to 25%, and gains may owe capital-gains tax (a 1031 exchange can defer both). Figures are a year-1 estimate at your 24.0% rate — not tax advice; consult a CPA.
Schools (NCES district)
- District
- Tuckahoe Union Free School District
- NCES district ID
- 3629040
- Math proficiency
- 71% ▼ -2.00%
- Reading proficiency
- 69% ▲ 2.00%
- Median HH income
- $88,563
- Composite
- 64.25/100
- National rank
- #1168
- State rank
- #133 of 755 in NY
Livability — Eastchester
- Score
- 78/100
- State rank
- #159
- US rank
- #2451
Category grades
Schools grade is shown separately in the Schools card above.
Census & demographics
- Census place
- Eastchester, NY
- County
- Westchester County · 709,332 people
- City population
- 10,274
- Metro
- New York-Newark-Jersey City, NY-NJ-PA
- Population (ZIP)
- 22,482
- Household income
- $126,343
- Rent vs Own
- Severe rent burden
- 357.0
Population outlook (Westchester County) Hauer SSP2
- Today (2025)
- 1,028,035 people
- By 2030
- 1,051,636 · +2.3%
- By 2040
- 1,098,520 · +6.9%
- By 2050
- 1,136,044 · +10.5%
- By 2075
- 1,196,925 · +16.4%
- By 2100
- 1,175,147 · +14.3%
Race, ethnicity, and origin ACS 2023
- Neighborhood character
- Predominantly White (69%)
- Race & ethnicity
- White 69% Hispanic / Latino 17% Two or more races 10% Black 6% Asian 4%
- Hispanic origin (detail)
- Puerto Rican 7% Dominican 3%
- Common ancestry
- Romanian 2% Lithuanian 2% Scotch-Irish 1%
- Foreign-born
- 16% · Canada, China
- Languages at home
- 76% English-only · Spanish 10% Other Indo-European 6% Other Asian/Pacific 2%
Political lean MEDSL · Westchester
- 2024 margin
- Strong D (+26.3) · D 63.1% · R 36.9%
- 2008→2024 swing
- -1.3pp toward R · 2008: 27.6pp · 2024: 26.3pp
- All cycles
- 2024: D+26.3 2020: D+36.3 2016: D+32.8 2012: D+22.2 2008: D+27.6
Not yet ingested
- Civics
- —
Market trends
- HPI YoY
- ▼ -668.11%
- Current HPI
- 203.4295
- Rent YoY
- ▲ 4.27%
- Metro
- New York-Newark-Jersey City, NY-NJ-PA
- State GDP YoY
- ▲ 2.60%
- F500 in state
- 92
Industry mix (Fortune 500 HQ in NY)
| Industry | F500 HQs | Revenue |
|---|---|---|
| Financial Services | 10 | $950B |
|
||
| Consumer Goods | 9 | $162B |
|
||
| Insurance | 4 | $225B |
|
||
| Telecommunications | 2 | $144B |
|
||
| Pharmaceuticals | 2 | $112B |
|
||
| Media / Entertainment | 2 | $69B |
|
||
Price history
1 event — show timeline
- 2026-06-08 Listed $769,000 OneKey® MLS as Distributed by MLS Grid
Property tax history
+4.9%/yrLatest (2025): $20,028 · +15.6% YoY. Source: county tax records.
Cash-flow waterfall
monthlySold comps — $/sqft
last 12 mo · ≤1 miLoading sold comps…