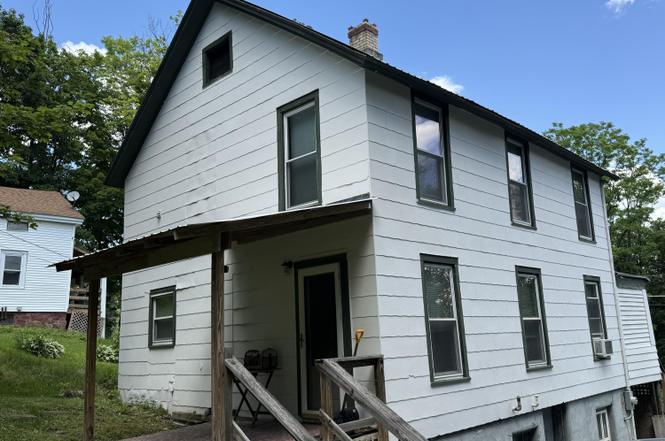
88 Saunders St · Whitehall, NY
Flood risk 1/10 · Minimal
- FEMA flood zone
- X
- Chance of flooding over 30 yrs
- 0.0%
- Est. flood insurance / yr
- $473 – $860
Fire risk 3/10 · Minor
- Est. fire insurance / yr
- $691 – $1,283
Heat risk 3/10 · Minor
- Hot days now (above 99°F)
- 7 days/yr
- Hot days in 30 yrs
- 16 days/yr
Wind risk 2/10 · Minimal
- Chance of severe wind over 30 yrs
- 3.0%
Air-quality risk 1/10 · Minimal
- Unhealthy air days now
- 0 days/yr
- Unhealthy air days in 30 yrs
- 0 days/yr
Risk factors via First Street. Map © Google.
Why this score? — see what drove the D+ grade
The composite is a weighted blend of 9 inputs, each scored 0–100. Each bar is that input's sub-score; the figure is the points it added to the 100-point composite (weight × sub-score).
- Cash flow +12.7/30.0
- Appreciation +10.0/10.0
- ARV discount +7.5/15.0
- 1% rule +3.8/10.0
- DSCR +3.8/10.0
- Schools +3.3/10.0
- Livability +2.8/5.0
- Rent growth +2.5/5.0
- Condition / age +2.5/5.0
$149,000
🖨 Deal sheet (PDF) 📄 Offer letter ✓ Due diligence
Listing remarks MLS
Prepare to fall in love with this well maintained, upgraded home, full of charm & move in ready. Delightful, freshly painted, with 4 bedrooms, 1.5 baths; just perfect for a first home or downsizing.The First Floor is gracious with an open plan, wood floors & an office/ or small bedroom.The spacious country kitchen is well equipped & ideal for family living. Front porch adds more comfortable living & lounging space. Upstairs, you'll find 3 more bright bedrooms and wood floors, upgraded bath with washer/dryer. New replacement windows, sheetrock, totally insulated, new wiring and electric service. Lovely yard with room for a fenced area and a garden. All Village amenities, including Lake Champlain, the marina, Amtrak, shops and restaurants are less than a mile away. Must see
Key facts
- Open floor plan
- Newer appliances
- Hardwood floors
Tags
Property features AI
Exterior
- Parking: Three parking spaces; Off-street stone driveway
- Utilities: Public water; Public sewer
- Home design: Single-family residence
- Construction: Drywall construction
- Exterior features: Lot approximately 0.15 acre (6,534 sq ft); Stone driveway and off-street parking
Interior
- Kitchen: Electric oven; Range; Range hood; Microwave; Dishwasher; Refrigerator
- Bedrooms: Three bedrooms on the second floor
- Bathrooms: One full bathroom on the second floor; One half bathroom on the first floor
- Heating & cooling: Forced-air heating; Oil heating
- Interior features: 10 total rooms; Full, unfinished basement; Three-seasons room; Office (could be a first-floor bedroom)
- Laundry & utility: Washer; Dryer
Neighborhood map
What this means for you Summary
Snapshot
- This is a 3-bed/1.0-bath single-family listed at $149k.
Deal economics
- At list price, monthly cash flow is $-15 ($-184/yr) — negative.
- To cash-flow at today's rent, offer at most $146k (1.8% below list).
- To meet the 1% rule (rent ≥ 1% of price), the offer needs to be $131k (12.0% below list).
- Recommended offer: $131k (12.0% below list) — sets the bar for 1% rule.
Location & tenants
- Location reads 56/100 on livability (#1,103 in NY) — a working-class tenant base; expect higher turnover. Strengths: cost of living A+, housing A+, crime B+; Watch: amenities F, commute F, employment F.
- Whitehall Central School District (rural): math 32% / reading 47% proficiency, ranked #530 of 590 in NY (top 90%) — families likely to look elsewhere, expect single-tenant / working-renter base with shorter leases.
- Zoned schools: Whitehall Elementary School (math 17% / reading 37%, grade F, #1,786 of 2,108 statewide, top 86%, 353 students, 63% FRL); Whitehall Junior-Senior High School (math 47% / reading 62%, grade C-, #912 of 1,100 statewide, top 85%, 320 students, 54% FRL) — zoned schools average 58% FRL vs 43% district-wide (16 pts higher); higher-poverty schools than district average — tighter screening recommended.
- Market conditions: 41 active listings in the ZIP; 106 units permitted in Washington County in 2024 (0 in 5+ unit buildings).
Forward outlook
- In year one you build about $16k of equity ($1k loan paydown + $15k appreciation (10.0% local appreciation)).
- Washington County population projected at -20% by 2050 — secular population decline; favor cash flow + early exit over multi-decade hold.
- At projected returns (10.0% appreciation + 3.0% rent growth), your $42k cash investment doubles in ~3 years — after that, you're playing with house money.
- By year 3, paydown + projected appreciation supports a ~$40k cash-out refi (75% LTV) — recoverable capital for the next deal without selling this one.
Negotiation context
- Only 5 days on market — expect competitive offers; lowballing is unlikely to land.
- 6 sale attempts since 25y ago with the ask held roughly flat each time — persistent listings suggest the price (not the market) is what's stuck; bring a comps-based counter.
- Current owner paid $120k; 25% above their basis — modest negotiation headroom, anchor on the comps not their cost.
Risks & watch-outs
- Watch-outs: built in 1900 — expect roof / HVAC / electrical / plumbing capex.
Questions for the listing agent
- What do current leases actually rent for vs. the listed asking? Can we see a recent rent roll and the last 12 months of T-12 income?
- Built in 1900 — when were the roof, HVAC, electrical panel, plumbing, and water heater last replaced?
- Is there a deadline driving the sale (1031 exchange, divorce, estate, relocation)? That informs how much negotiation room exists.
- Schools are F-rated, which usually means shorter tenancies and higher turnover. Who's the typical renter profile here, and what's been the actual vacancy rate?
- The area grade is low — what's the realistic commute time and amenity access for the typical tenant pool here? Any planned neighborhood developments (good or bad) we should know about?
- What's the average days-on-market for RENTAL listings here right now (not sales)? A rising rental-DOM trend means longer vacancies and softer asking-rent achievability than the comps imply.
- What's the recent tenant-quality profile in this submarket — average credit score on applications, eviction rate, late-payment / NSF rate, and stable-employment percentage? A property-management company in the area should have these aggregated.
- How much new for-sale + rental construction is in the pipeline within 1–3 miles? Heavy new supply typically softens prices + rents 12–24 months out; constrained supply supports both.
Investment metrics
- 1% rule
- 0.88% ✗
- Cap rate
- 6.17%
- Cash-on-cash
- -0.44%
- DSCR
- 0.98
- GRM
- 9.5
CMA / ARV
- ARV (on-the-fly)
- $84,042
- Comps found
- 10
Show comp detail 10 sales within ~0.75 mi
| Address | Dist | Beds/Ba | Sqft | Sold | Price | $/sf | Match |
|---|---|---|---|---|---|---|---|
| 48 Saunders St | 0.24mi | 3/1.0 | 1,360 (+2%) | 12mo | $137,000 | $101 | 76 |
| 1 Brookdale Ave | 0.29mi | 3/1.0 | 1,434 (+8%) | 2mo | $90,000 | $63 | 72 |
| 27 School St | 0.42mi | 3/1.5 | 1,395 (+5%) | 4mo | $95,000 | $68 | 67 |
| 59 West St | 0.41mi | 3/1.5 | 1,232 (-8%) | 9mo | $150,000 | $122 | 59 |
| 28 School St | 0.44mi | 2/1.0 (-1) | 1,363 (+2%) | 16mo | $12,500 | $9 | 57 |
| 17 Bellamy St | 0.22mi | 2/1.5 (-1) | 1,476 (+11%) | 10mo | $65,000 | $44 | 56 |
| 11 Gilmore St | 0.55mi | 3/1.0 | 1,181 (-12%) | 2mo | $63,000 | $53 | 54 |
| 31 Queen St | 0.60mi | 3/1.0 | 1,239 (-7%) | 8mo | $23,000 | $19 | 54 |
| 31 Williams St | 0.59mi | 4/1.0 (+1) | 1,376 (+3%) | 11mo | $14,500 | $11 | 53 |
| 39 West St | 0.34mi | 3/2.0 | 1,452 (+9%) | 19mo | $196,000 | $135 | 50 |
Match score weights: distance 35% · size 25% · config 20% · recency 20%. Top-matched comps best support the ARV.
Projected returns pro-forma
10.0% appreciation · 3.0% rent growth · sell at horizon
- IRR
- 24.0%
- Equity multiple
- 2.92×
- Total profit
- $80,205
- Equity at exit
- $134,231
- IRR
- 21.3%
- Equity multiple
- 6.68×
- Total profit
- $237,025
- Equity at exit
- $289,474
Cash invested: $41,720 (down + closing). Projections, not guarantees.
Landlord ↔ Tenant lean methodology
- Overall (STATE)
- 15 Strongly Tenant-Friendly
- State New York
- 15 Strongly Tenant-Friendly · D+10
- County
- — inherits STATE
- City
- — inherits STATE
ZIP-level market 12887
- Active inventory
- 41
- Price-to-rent
- 9.5×
Monthly cashflow live
- Estimated rent
- $1,312 medium interval (Pro) →
- Mortgage (P&I)
- −$781
- Tax from tax record
- −$208 /mo · $2,496/yr
- Insurance
- −$62
- HOA
- −$0
- Vacancy / Maint / Mgmt
- −$275
- Net cashflow
- $-15
Break-even live
Sensitivity live
| Price | -10% $69 | -5% $27 | +0% $-15 | +5% $-58 | +10% $-100 |
|---|---|---|---|---|---|
| Rent | -10% $-119 | -5% $-67 | +0% $-15 | +5% $36 | +10% $88 |
| Rate | -1.0pp $60 | -0.5pp $23 | base $-15 | +0.5pp $-54 | +1.0pp $-93 |
UW: 25.0% down · 7.5% · 30yr · 1.5% tax · 5.0% vac · 8.0% maint · 8.0% mgmt
Financing live
Cash to close
- Down payment
- $37,250
- Closing costs
- $4,470
- Reserves months
- —
- Total cash needed
- —
Loan-product check · same deal, 3 products live
Conventional
25% down · 7.5% · 30yr
- Down + closing
- —
- Monthly P&I
- —
- Monthly cashflow
- —
- DSCR
- —
- Eligible?
- —
Personal DTI + credit; lowest rate.
DSCR
20% down · 8.5% · 30yr
- Down + closing
- —
- Monthly P&I
- —
- Monthly cashflow
- —
- DSCR
- —
- Eligible?
- —
No personal income docs; deal must DSCR.
Hard money
10% down · 12.0% · 12mo
- Down + closing
- —
- Monthly P&I
- —
- Monthly cashflow
- —
- DSCR
- —
- Eligible?
- —
Short-term bridge; refi at stabilization.
Listing history 5 events
-
2026-06-21days on market $149,000 Active 5 DOM
-
2026-06-18days on market $149,000 Active 3 DOM
-
2026-06-17days on market $149,000 Active 2 DOM
-
2026-06-16remarks 466-char remark
-
2026-06-16$149,000 Active 1 DOM
ⓘ Source: listings_history table (triggers on properties + properties_extension) + one-shot
backfill from property_details.listing_events for pre-trigger history.
Tax reassessment forecast NY · Partial reset (capped growth)
- Current annual tax
- $2,496 · $208/mo
- Projected year-2 tax
- $2,507 · $209/mo
- Expected delta
- +$11/yr (+$1/mo · 0.4%)
ⓘ Screening estimate from a state-policy table — verify with the county assessor before closing.
Climate risk First Street
- Flood 1/10 Low FEMA zone X · 0% chance over 30 yrs
- Wildfire 3/10 Moderate
- Heat 3/10 Moderate 7 d/yr ≥99°F today · 16 d/yr by 30 yrs out
- Wind 2/10 Low 3% chance of damaging wind over 30 yrs
- Air quality 1/10 Low 0 unhealthy d/yr today · 0 by 30 yrs out
Nearby sold comps map
Loading sold comps map…
Walkable amenities ~0.75 mi
Loading nearby amenities…
Taxation est. · year 1
- Rental income
- $15,739
- − Mortgage interest
- −$8,346
- − Property taxes
- −$2,496
- − Insurance
- −$745
- − Repairs & maintenance
- −$1,259
- − Management
- −$1,259
- − Depreciation
- −$4,335
- Taxable loss
- −$2,702
- Est. tax savings @ 24.0%
- +$648
- After-tax cash flow
- $464/yr
For passive investors: Depreciation is non-cash, so a rental often shows a tax loss while cash-flowing — sheltering income. Rental losses are passive: they offset passive income freely, and up to $25,000/yr can offset ordinary (W-2) income if you actively participate and your MAGI is under $100k (phasing out to $0 by $150k); unused losses carry forward. On sale, claimed depreciation is recaptured at up to 25%, and gains may owe capital-gains tax (a 1031 exchange can defer both). Figures are a year-1 estimate at your 24.0% rate — not tax advice; consult a CPA.
Schools (NCES district)
- District
- Whitehall Central School District
- NCES district ID
- 3631290
- Math proficiency
- 32% ▼ -1.00%
- Reading proficiency
- 47% ▲ 5.00%
- Median HH income
- $43,563
- Composite
- 33.4/100
- National rank
- #5477
- State rank
- #530 of 590 in NY
Livability — Whitehall
- Score
- 56/100
- State rank
- #1103
- US rank
- #22538
Category grades
Schools grade is shown separately in the Schools card above.
Census & demographics
- Census place
- Whitehall, NY
- Population (ZIP)
- 4,629
Population outlook (Washington County) Hauer SSP2
- Today (2025)
- 59,576 people
- By 2030
- 57,618 · -3.3%
- By 2040
- 52,751 · -11.5%
- By 2050
- 47,514 · -20.2%
- By 2075
- 35,690 · -40.1%
- By 2100
- 24,807 · -58.4%
Race, ethnicity, and origin ACS 2023
- Neighborhood character
- Predominantly White (88%)
- Race & ethnicity
- White 88% Two or more races 9% Hispanic / Latino 3%
- Common ancestry
- Lithuanian 15% Polish 5% Romanian 3%
- Foreign-born
- 2% · Canada
- Languages at home
- 95% English-only · German/W. Germanic 3% Spanish 1%
Political lean MEDSL · Washington
- 2024 margin
- Strong R (+21.2) · D 39.4% · R 60.6%
- 2008→2024 swing
- -22.0pp toward R · 2008: 0.8pp · 2024: -21.2pp
- All cycles
- 2024: R+21.2 2020: R+15.6 2016: R+20.2 2012: D+1.6 2008: D+0.8
Not yet ingested
- Civics
- —
Market trends
- HPI YoY
- ▲ 122.64%
- Current HPI
- 354.5975
- Rent YoY
- —
- Metro
- —
- State GDP YoY
- ▲ 2.60%
- F500 in state
- 92
Industry mix (Fortune 500 HQ in NY)
| Industry | F500 HQs | Revenue |
|---|---|---|
| Financial Services | 10 | $950B |
|
||
| Consumer Goods | 9 | $162B |
|
||
| Insurance | 4 | $225B |
|
||
| Telecommunications | 2 | $144B |
|
||
| Pharmaceuticals | 2 | $112B |
|
||
| Media / Entertainment | 2 | $69B |
|
||
Price history
+238.6% since first listed14 events — show timeline
- 2026-06-15 Listed $149,000 Global MLS
- 2022-09-22 Sold (Public Records) $119,600 Public Records
- 2022-09-15 Sold (MLS) $119,600 Global MLS
- 2022-08-06 Pending — Global MLS
- 2022-08-02 Relisted — Global MLS
- 2022-07-11 Pending — Global MLS
- 2022-07-03 Listed $109,900 Global MLS
- 2019-02-28 Listing Removed — Global MLS
- 2007-05-07 Sold (Public Records) $37,000 Public Records
- 2007-05-01 Sold (MLS) $37,000 Global MLS
- 2006-07-12 Listed $40,000 Global MLS
- 2006-03-24 Listing Removed — Global MLS
- 2005-03-24 Listed $55,000 Global MLS
- 2001-11-20 Listed $44,000 Global MLS
Property tax history
+0.4%/yrLatest (2025): $2,496 · +19.6% YoY. Source: county tax records.
Cash-flow waterfall
monthlySold comps — $/sqft
last 12 mo · ≤1 miLoading sold comps…