1004 Chestnut St · LaFayette, GA
Flood risk 1/10 · Minimal
- FEMA flood zone
- X (unshaded)
- Chance of flooding over 30 yrs
- 0.0%
- Est. flood insurance / yr
- $507 – $1,088
Fire risk 5/10 · Moderate
- Est. fire insurance / yr
- $963 – $1,789
Heat risk 6/10 · Moderate
- Hot days now (above 104°F)
- 7 days/yr
- Hot days in 30 yrs
- 20 days/yr
Wind risk 4/10 · Minor
- Chance of severe wind over 30 yrs
- 13.0%
Air-quality risk 3/10 · Minor
- Unhealthy air days now
- 2 days/yr
- Unhealthy air days in 30 yrs
- 2 days/yr
Risk factors via First Street. Map © Google.
Why this score? — see what drove the B- grade
The composite is a weighted blend of 9 inputs, each scored 0–100. Each bar is that input's sub-score; the figure is the points it added to the 100-point composite (weight × sub-score).
- Cash flow +29.5/30.0
- DSCR +10.0/10.0
- 1% rule +8.3/10.0
- ARV discount +7.5/15.0
- Livability +3.1/5.0
- Rent growth +2.5/5.0
- Condition / age +2.5/5.0
- Schools +2.3/10.0
- Appreciation +0.0/10.0
$119,900
🖨 Deal sheet 📄 Offer letter ✓ Due diligence
Listing remarks MLS
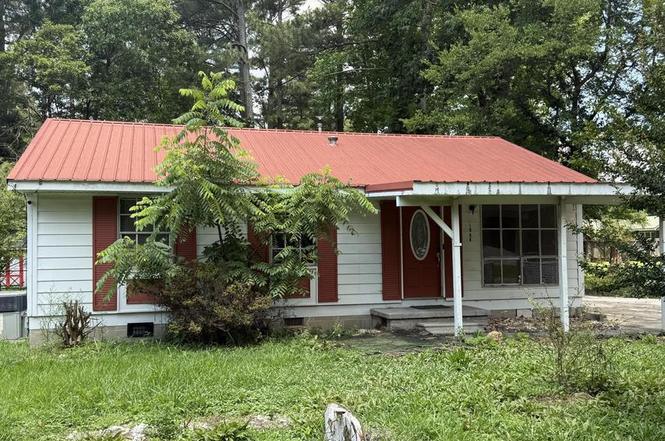
Opportunity awaits with this fixer-upper full of potential. This spacious 4-bedroom, 2-bath home offers plenty of room to spread out with both a living room and a separate den, providing flexible space for entertaining, relaxing, or working from home. The property features include a covered front and back porch, metal roof, gazebo, double detached carport and two outbuildings that offer additional storage or workshop space. Conveniently located near schools, shopping, dining, and downtown LaFayette. With some vision and updates this property presents a great opportunity for a homeowner or investor. Seller has never resided at this property and is selling 'AS-IS'. Buyer to verify all information including to determine if HVAC unit is functional.
Key facts
- Metal roof
- Gazebo
- Two outbuildings
Tags
Property features AI
Finance
- HOA & community: No community amenities listed
Exterior
- Parking: Carport with 2 spaces; Concrete driveway; Off-street parking
- Utilities: Public water; Public sewer; Electricity connected; Water connected
- Home design: Single-family residence; One story; Fixer condition
- Construction: Metal siding; Wood siding; Metal roof; Block foundation; House structure; Built on one level
- Exterior features: Covered front and rear porches; Storage areas; Gazebo; Outbuilding; Fenced yard; Other outdoor storage
Interior
- Flooring: Carpet; Linoleum; Tile
- Bathrooms: 2 full bathrooms
- Heating & cooling: Central heating; Central air; Ceiling fans (cooling)
- Interior features: Ceiling fans
- Laundry & utility: Dedicated laundry room
Neighborhood map
What this means for you Summary
Snapshot
- This is a 4-bed/1.0-bath single-family listed at $120k.
Deal economics
- At list price, monthly cash flow is $428 ($5k/yr) — positive.
- The deal already cash-flows at list — no discount required.
- Meets the 1% rule at list price ($2k rent vs $120k).
- Cap rate 10.6% vs local median 4.1% in LaFayette — top-decile yield for the area; either an underpriced asset or a hidden risk that comps aren't pricing in. Stress-test before assuming the spread holds.
Location & tenants
- Location reads 61/100 on livability (#345 in GA) — a middle-class / working-renter tenant base. Strengths: cost of living A+, housing A; Watch: crime D+, amenities F, commute F.
- Walker County (rural): math 25% / reading 29% proficiency, ranked #114 of 174 in GA (top 66%) — low school quality limits family demand, transient renter base, plan for 1-2y turnover; 61% free/reduced lunch — lower-income household profile, screen leases tightly.
- Zoned schools: Gilbert Elementary School (math 22% / reading 22%, grade F, #810 of 1,228 statewide, top 69%, 508 students, 80% FRL); Lafayette Middle School (math 23% / reading 27%, grade F, #291 of 470 statewide, top 64%, 575 students, 77% FRL); Lafayette High School (math 5% / reading 15%, grade F, #353 of 424 statewide, top 86%, 1,164 students, 62% FRL).
- Market conditions: 218 active listings in the ZIP; 347 units permitted in Walker County in 2024 (24 in 5+ unit buildings).
- This rent runs 34% of the median local income ($55k/yr) — at the standard rent-burdened threshold; future hikes will face affordability resistance.
Forward outlook
- Local home prices are declining (-3.0%/yr); year-one equity from $829 of loan paydown is wiped out by about $4k of value loss. Plan a longer hold.
- Walker County population projected at -16% by 2050 — secular population decline; favor cash flow + early exit over multi-decade hold.
- At projected returns (-3.0% appreciation + 3.0% rent growth), your $34k cash investment doubles in ~8 years — after that, you're playing with house money.
Negotiation context
- Only 7 days on market — expect competitive offers; lowballing is unlikely to land.
- 2 sale attempts with the ask held roughly flat each time — persistent listings suggest the price (not the market) is what's stuck; bring a comps-based counter.
Risks & watch-outs
- Climate carrying-cost: moderate wildfire risk; extreme-heat days projected 7→20/yr by 2055 (HVAC capex compounding) — expect insurance premiums to compound above CPI over the hold.
Questions for the listing agent
- Built in 1967 — when were the roof, HVAC, electrical panel, plumbing, and water heater last replaced?
- Is there a deadline driving the sale (1031 exchange, divorce, estate, relocation)? That informs how much negotiation room exists.
- Schools are F-rated, which usually means shorter tenancies and higher turnover. Who's the typical renter profile here, and what's been the actual vacancy rate?
- Crime grade is D in this area — have there been break-ins, vandalism, or insurance claims at this property in the last 3 years? What carrier currently insures it and at what premium?
- What's the average days-on-market for RENTAL listings here right now (not sales)? A rising rental-DOM trend means longer vacancies and softer asking-rent achievability than the comps imply.
- What's the recent tenant-quality profile in this submarket — average credit score on applications, eviction rate, late-payment / NSF rate, and stable-employment percentage? A property-management company in the area should have these aggregated.
- How much new for-sale + rental construction is in the pipeline within 1–3 miles? Heavy new supply typically softens prices + rents 12–24 months out; constrained supply supports both.
Investment metrics
- 1% rule
- 1.33% ✓
- Cap rate
- 10.58%
- Cash-on-cash
- 15.31%
- DSCR
- 1.68
- GRM
- 6.3
CMA / ARV
- ARV (on-the-fly)
- $242,720
- Comps found
- 12
Show comp detail 12 sales within ~0.75 mi
| Address | Dist | Beds/Ba | Sqft | Sold | Price | $/sf | Match |
|---|---|---|---|---|---|---|---|
| 801 S Chattanooga St | 0.35mi | 3/2.0 (-1) | 1,532 (+1%) | 7mo | $245,000 | $160 | 67 |
| 1125 S Chattanooga St | 0.26mi | 3/1.5 (-1) | 1,368 (-10%) | 5mo | $170,000 | $124 | 61 |
| 414 Magnolia St | 0.47mi | 3/1.0 (-1) | 1,568 (+3%) | 8mo | $190,000 | $121 | 61 |
| 535 Church St | 0.36mi | 3/2.0 (-1) | 1,443 (-5%) | 8mo | $50,500 | $35 | 59 |
| 211 Thurman St | 0.36mi | 3/2.0 (-1) | 1,358 (-10%) | 4mo | $45,000 | $33 | 53 |
| 908 Gilbert Ln | 0.32mi | 3/2.0 (-1) | 1,704 (+12%) | 6mo | $205,000 | $120 | 50 |
| 712 Mclemore St | 0.26mi | 3/2.0 (-1) | 1,294 (-15%) | 5mo | $230,000 | $178 | 50 |
| 802 Mclemore St | 0.26mi | 3/2.0 (-1) | 1,294 (-15%) | 6mo | $212,000 | $164 | 50 |
| 506 Daugherty St | 0.46mi | 3/1.5 (-1) | 1,340 (-12%) | 3mo | $109,871 | $82 | 49 |
| 800 Mclemore St | 0.26mi | 3/2.0 (-1) | 1,294 (-15%) | 7mo | $212,000 | $164 | 48 |
| 505 Mclemore St | 0.38mi | 3/2.0 (-1) | 1,334 (-12%) | 6mo | $253,900 | $190 | 48 |
| 307 Cavender St | 0.53mi | 3/2.0 (-1) | 1,311 (-14%) | 6mo | $243,900 | $186 | 38 |
Match score weights: distance 35% · size 25% · config 20% · recency 20%. Top-matched comps best support the ARV.
Projected returns pro-forma
-3.0% appreciation · 3.0% rent growth · sell at horizon
- IRR
- 6.0%
- Equity multiple
- 1.23×
- Total profit
- $7,878
- Equity at exit
- $17,877
- IRR
- 15.4%
- Equity multiple
- 2.25×
- Total profit
- $42,090
- Equity at exit
- $10,367
Cash invested: $33,572 (down + closing). Projections, not guarantees.
Landlord ↔ Tenant lean methodology
- Overall (STATE)
- 90 Strongly Landlord-Friendly
- State Georgia
- 90 Strongly Landlord-Friendly · R+3
- County
- — inherits STATE
- City
- — inherits STATE
ZIP-level market 30728
- Home prices YoY
- -14.2%
- Active inventory
- 218
- Price-to-rent
- 6.3×
Monthly cashflow live
- Estimated rent
- $1,591 medium interval (Pro) →
- Mortgage (P&I)
- −$629
- Tax est. 1.5%
- −$150 /mo · $1,798/yr
- Insurance
- −$50
- HOA
- −$0
- Vacancy / Maint / Mgmt
- −$334
- Net cashflow
- $428
Break-even live
UW: 25.0% down · 7.5% · 30yr · 1.5% tax · 5.0% vac · 8.0% maint · 8.0% mgmt
Financing live
Cash to close
- Down payment
- $29,975
- Closing costs
- $3,597
- Reserves months
- —
- Total cash needed
- —
Loan-product check · same deal, 3 products live
Conventional
25% down · 7.5% · 30yr
- Down + closing
- —
- Monthly P&I
- —
- Monthly cashflow
- —
- DSCR
- —
- Eligible?
- —
Personal DTI + credit; lowest rate.
DSCR
20% down · 8.5% · 30yr
- Down + closing
- —
- Monthly P&I
- —
- Monthly cashflow
- —
- DSCR
- —
- Eligible?
- —
No personal income docs; deal must DSCR.
Hard money
10% down · 12.0% · 12mo
- Down + closing
- —
- Monthly P&I
- —
- Monthly cashflow
- —
- DSCR
- —
- Eligible?
- —
Short-term bridge; refi at stabilization.
Listing history 8 events
-
2026-06-18status $119,900 Pending 7 DOM
-
2026-06-18days on market $119,900 Active 7 DOM
-
2026-06-17days on market $119,900 Active 6 DOM
-
2026-06-16days on market $119,900 Active 5 DOM
-
2026-06-15days on market $119,900 Active 4 DOM
-
2026-06-14days on market $119,900 Active 2 DOM
-
2026-06-13remarks 699-char remark
-
2026-06-13$119,900 Active 1 DOM
ⓘ Source: listings_history table (triggers on properties + properties_extension) + one-shot
backfill from property_details.listing_events for pre-trigger history.
Climate risk First Street
- Flood 1/10 Low FEMA zone X (unshaded) · 0% chance over 30 yrs
- Wildfire 5/10 Major
- Heat 6/10 Major 7 d/yr ≥104°F today · 20 d/yr by 30 yrs out
- Wind 4/10 Moderate 13% chance of damaging wind over 30 yrs
- Air quality 3/10 Moderate 2 unhealthy d/yr today · 2 by 30 yrs out
Nearby sold comps map
Loading sold comps map…
Walkable amenities ~0.75 mi
Loading nearby amenities…
Taxation est. · year 1
- Rental income
- $19,093
- − Mortgage interest
- −$6,716
- − Property taxes
- −$1,798
- − Insurance
- −$600
- − Repairs & maintenance
- −$1,527
- − Management
- −$1,527
- − Depreciation
- −$3,488
- Taxable income
- $3,436
- Est. tax owed @ 24.0%
- −$825
- After-tax cash flow
- $4,316/yr
For passive investors: Depreciation is non-cash, so a rental often shows a tax loss while cash-flowing — sheltering income. Rental losses are passive: they offset passive income freely, and up to $25,000/yr can offset ordinary (W-2) income if you actively participate and your MAGI is under $100k (phasing out to $0 by $150k); unused losses carry forward. On sale, claimed depreciation is recaptured at up to 25%, and gains may owe capital-gains tax (a 1031 exchange can defer both). Figures are a year-1 estimate at your 24.0% rate — not tax advice; consult a CPA.
Schools (NCES district)
- District
- Walker County
- NCES district ID
- 1305370
- Math proficiency
- 25% ▼ -10.00%
- Reading proficiency
- 29% ▼ -10.00%
- Median HH income
- $39,889
- Composite
- 22.74/100
- National rank
- #8035
- State rank
- #114 of 174 in GA
Livability — LaFayette
- Score
- 61/100
- State rank
- #345
- US rank
- #17893
Category grades
Schools grade is shown separately in the Schools card above.
Census & demographics
- Census place
- LaFayette, GA
- County
- Walker County · 48,831 people
- City population
- 18,790
- Metro
- Chattanooga, TN-GA
- Population (ZIP)
- 18,790
- Household income
- $55,455
- Rent vs Own
- Severe rent burden
- 233.0
Population outlook (Walker County) Hauer SSP2
- Today (2025)
- 66,050 people
- By 2030
- 64,305 · -2.6%
- By 2040
- 60,127 · -9.0%
- By 2050
- 55,551 · -15.9%
- By 2075
- 44,886 · -32.0%
- By 2100
- 34,015 · -48.5%
Race, ethnicity, and origin ACS 2023
- Neighborhood character
- Predominantly White (90%)
- Race & ethnicity
- White 90% Two or more races 5% Black 3% Hispanic / Latino 2% Asian 1%
- Common ancestry
- Slovak 3% Lithuanian 2% Iranian 2%
- Foreign-born
- 2% · South Korea
- Languages at home
- 97% English-only · Spanish 2% Korean 1%
Political lean MEDSL · Walker
- 2024 margin
- Solid R (+59.3) · D 20.1% · R 79.4%
- 2008→2024 swing
- -12.5pp toward R · 2008: -46.8pp · 2024: -59.3pp
- All cycles
- 2024: R+59.3 2020: R+59.3 2016: R+61.5 2012: R+50.2 2008: R+46.8
Not yet ingested
- Civics
- —
Market trends
- HPI YoY
- ▼ -45.02%
- Current HPI
- 271.2944
- Rent YoY
- —
- Metro
- Chattanooga, TN-GA
- State GDP YoY
- ▲ 2.66%
- F500 in state
- 28
Industry mix (Fortune 500 HQ in GA)
| Industry | F500 HQs | Revenue |
|---|---|---|
| Paper / Packaging | 2 | $29B |
|
||
| Retail | 1 | $160B |
|
||
| Transportation / Logistics | 1 | $91B |
|
||
| Airlines | 1 | $62B |
|
||
| Consumer Goods | 1 | $47B |
|
||
| Utilities | 1 | $25B |
|
||
Price history
+0.0% since first listed2 events — show timeline
- 2026-06-09 Listed $119,900 GAMLS
- 2026-06-09 Listed $119,900 GCAR
Property tax history
-16.1%/yrLatest (2024): $41 · -32.7% YoY. Source: county tax records.
Cash-flow waterfall
monthlySold comps — $/sqft
last 12 mo · ≤1 miLoading sold comps…