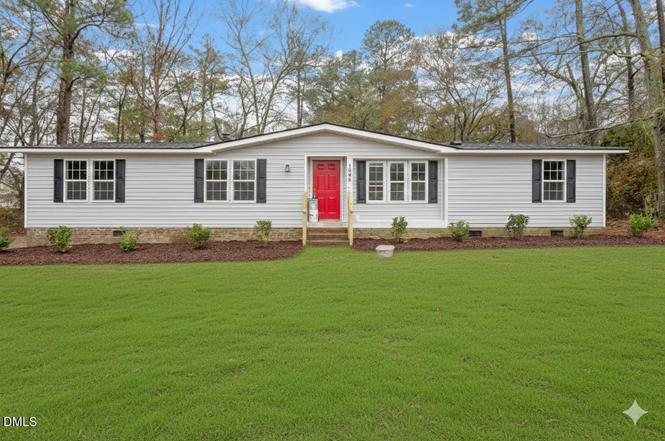
1008 Amanda Ln · Angier, NC
Flood risk 1/10 · Minimal
- FEMA flood zone
- X (unshaded)
- Chance of flooding over 30 yrs
- 0.0%
- Est. flood insurance / yr
- $507 – $1,088
Fire risk 4/10 · Minor
- Est. fire insurance / yr
- $906 – $1,684
Heat risk 6/10 · Moderate
- Hot days now (above 106°F)
- 7 days/yr
- Hot days in 30 yrs
- 17 days/yr
Wind risk 6/10 · Moderate
- Chance of severe wind over 30 yrs
- 73.0%
Air-quality risk 2/10 · Minimal
- Unhealthy air days now
- 1 days/yr
- Unhealthy air days in 30 yrs
- 1 days/yr
Risk factors via First Street. Map © Google.
Why this score? — see what drove the C- grade
The composite is a weighted blend of 9 inputs, each scored 0–100. Each bar is that input's sub-score; the figure is the points it added to the 100-point composite (weight × sub-score).
- Cash flow +18.0/30.0
- ARV discount +10.9/15.0
- DSCR +5.6/10.0
- Livability +3.7/5.0
- 1% rule +3.5/10.0
- Schools +3.5/10.0
- Rent growth +2.9/5.0
- Condition / age +2.5/5.0
- Appreciation +0.0/10.0
$253,900
🖨 Deal sheet (PDF) 📄 Offer letter ✓ Due diligence
Listing remarks MLS
$12,000 DOWN AND THE OWNER WILL FINANCE-ROOMY HOME FOR A BIG FAMILY-CHECK T HE SIZE OF THE FAMILY ROOM WITH A WOOD BURNING FIREPLACE-DOUBLE OVEN-LARGE KITCHEN WITH EATING BAR-WILL NOT GO FHA OR VA-KEYED LOCKBOX-BRING AN OFFER.
Key facts
- Quartz countertops
- Updated ranch home
- Quiet cul-de-sac
Tags
Neighborhood map
What this means for you Summary
Snapshot
- This is a 3-bed/2.0-bath manufactured listed at $254k.
Deal economics
- At list price, monthly cash flow is $216 ($3k/yr) — positive.
- The deal already cash-flows at list — no discount required.
- To meet the 1% rule (rent ≥ 1% of price), the offer needs to be $216k (15.1% below list).
- Recommended offer: $216k (15.1% below list) — sets the bar for 1% rule.
- Cap rate 7.3% vs local median 3.9% in Angier — top-decile yield for the area; either an underpriced asset or a hidden risk that comps aren't pricing in. Stress-test before assuming the spread holds.
Location & tenants
- Location reads 73/100 on livability (#69 in NC) — a middle-class / working-renter tenant base. Strengths: cost of living A+, housing A+, health & safety A+; Watch: employment C-, amenities D, commute F.
- Johnston County Public Schools (rural): math 39% / reading 42% proficiency, ranked #105 of 178 in NC (top 59%) — families likely to look elsewhere, expect single-tenant / working-renter base with shorter leases.
- Zoned schools: Mcgee'S Crossroads Elem (math 38% / reading 41%, grade F, #694 of 1,410 statewide, top 53%, 890 students, 56% FRL); Mcgee'S Crossroads Middle (math 26% / reading 40%, grade F, #305 of 475 statewide, top 65%, 749 students, 47% FRL); West Johnston High (math 44% / reading 47%, grade D-, #347 of 535 statewide, top 65%, 1,469 students, 38% FRL).
- Market conditions: Rents rising (+1.5%/yr); 662 active listings in the ZIP; 3 comparable units currently listed for rent nearby; rentals at typical pace (median 26d on market — plan ~3-4 weeks tenant-placement turnaround); 2,783 units permitted in Johnston County in 2024 (6 in 5+ unit buildings).
- This rent runs 35% of the median local income ($73k/yr) — at the standard rent-burdened threshold; future hikes will face affordability resistance.
Forward outlook
- Local home prices are declining (-3.0%/yr); year-one equity from $2k of loan paydown is wiped out by about $8k of value loss. Plan a longer hold.
- Johnston County population projected at +37% by 2050 — long-run rental-demand tailwind backs the buy-and-hold thesis.
Negotiation context
- It's been on market 38 days — a 3% lower offer ($246k) is reasonable based on typical stale-listing flexibility.
- 4 sale attempts since 26y ago with the ask held roughly flat each time — persistent listings suggest the price (not the market) is what's stuck; bring a comps-based counter.
- Current owner paid $76k; list at $254k implies a 236% gain — meaningful room to come down on a strong offer.
Risks & watch-outs
- Climate carrying-cost: major wind risk, 73% chance of damaging wind over 30y; extreme-heat days projected 7→17/yr by 2055 (HVAC capex compounding) — expect insurance premiums to compound above CPI over the hold.
Questions for the listing agent
- It's been on market 38 days. Have you received any prior offers? Is the seller open to a 15% concession, seller financing, or rate buy-down credit?
- Is there a deadline driving the sale (1031 exchange, divorce, estate, relocation)? That informs how much negotiation room exists.
- Schools are F-rated, which usually means shorter tenancies and higher turnover. Who's the typical renter profile here, and what's been the actual vacancy rate?
- What's the average days-on-market for RENTAL listings here right now (not sales)? A rising rental-DOM trend means longer vacancies and softer asking-rent achievability than the comps imply.
- What's the recent tenant-quality profile in this submarket — average credit score on applications, eviction rate, late-payment / NSF rate, and stable-employment percentage? A property-management company in the area should have these aggregated.
- How much new for-sale + rental construction is in the pipeline within 1–3 miles? Heavy new supply typically softens prices + rents 12–24 months out; constrained supply supports both.
Investment metrics
- 1% rule
- 0.85% ✗
- Cap rate
- 7.32%
- Cash-on-cash
- 3.65%
- DSCR
- 1.16
- GRM
- 9.8
CMA / ARV
- ARV (on-the-fly)
- $274,560
- Comps found
- 1
Show comp detail 1 sale within ~0.75 mi
| Address | Dist | Beds/Ba | Sqft | Sold | Price | $/sf | Match |
|---|---|---|---|---|---|---|---|
| 1008 Amanda Ln | 0.00mi | 3/2.0 | 1,396 (-10%) | 1mo | $245,000 | $176 | 82 |
Match score weights: distance 35% · size 25% · config 20% · recency 20%. Top-matched comps best support the ARV.
Projected returns pro-forma
-3.0% appreciation · 1.47% rent growth · sell at horizon
- IRR
- -12.1%
- Equity multiple
- 0.57×
- Total profit
- $-30,759
- Equity at exit
- $37,857
- IRR
- -5.2%
- Equity multiple
- 0.68×
- Total profit
- $-22,579
- Equity at exit
- $21,953
Cash invested: $71,092 (down + closing). Projections, not guarantees.
Landlord ↔ Tenant lean methodology
- Overall (STATE)
- 85 Strongly Landlord-Friendly
- State North Carolina
- 85 Strongly Landlord-Friendly · R+3
- County
- — inherits STATE
- City
- — inherits STATE
ZIP-level market 27501
- Home prices YoY
- -11.4%
- Rents YoY
- 1.5%
- Active inventory
- 662
- Price-to-rent
- 9.8×
Monthly cashflow live
- Estimated rent
- $2,156 medium interval (Pro) →
- Mortgage (P&I)
- −$1,331
- Tax from tax record
- −$50 /mo · $596/yr
- Insurance
- −$106
- HOA
- −$0
- Vacancy / Maint / Mgmt
- −$453
- Net cashflow
- $216
Break-even live
Sensitivity live
| Price | -10% $360 | -5% $288 | +0% $216 | +5% $145 | +10% $73 |
|---|---|---|---|---|---|
| Rent | -10% $46 | -5% $131 | +0% $216 | +5% $302 | +10% $387 |
| Rate | -1.0pp $344 | -0.5pp $281 | base $216 | +0.5pp $151 | +1.0pp $84 |
UW: 25.0% down · 7.5% · 30yr · 1.5% tax · 5.0% vac · 8.0% maint · 8.0% mgmt
Financing live
Cash to close
- Down payment
- $63,475
- Closing costs
- $7,617
- Reserves months
- —
- Total cash needed
- —
Loan-product check · same deal, 3 products live
Conventional
25% down · 7.5% · 30yr
- Down + closing
- —
- Monthly P&I
- —
- Monthly cashflow
- —
- DSCR
- —
- Eligible?
- —
Personal DTI + credit; lowest rate.
DSCR
20% down · 8.5% · 30yr
- Down + closing
- —
- Monthly P&I
- —
- Monthly cashflow
- —
- DSCR
- —
- Eligible?
- —
No personal income docs; deal must DSCR.
Hard money
10% down · 12.0% · 12mo
- Down + closing
- —
- Monthly P&I
- —
- Monthly cashflow
- —
- DSCR
- —
- Eligible?
- —
Short-term bridge; refi at stabilization.
Rent comps 3 comps
| Address | Beds | Baths | Sqft | Rent | $/sqft | DOM | Units | Dist |
|---|---|---|---|---|---|---|---|---|
| 81 Combine Trl Benson, NC | 3.0 | 2.5 | 1913 | $1,795 | $0.94 | 3d | 1 | 1.00mi |
| 147 Langston Ridge Dr Angier, NC | 3.0 | 2.5 | 1801 | $2,120 | $1.18 | 25d | 1 | 1.38mi |
| 113 Prosperity Ct Angier, NC | 3.0 | 2.5 | 2122 | $2,230 | $1.05 | 25d | 1 | 1.42mi |
Listing history 14 events
-
2026-03-27status Pending
-
2026-03-06price $253,900
-
2026-02-25status Active
-
2026-01-16status Pending
-
2026-01-08$254,900 Active
-
2026-01-07historical
-
2025-12-20price $258,900
-
2025-12-06$259,900 Active
-
2025-10-17soldstatus $75,500
-
2001-06-14soldstatus $56,000 226-char remark
Show marketing remark (226 chars)
$12,000 DOWN AND THE OWNER WILL FINANCE-ROOMY HOME FOR A BIG FAMILY-CHECK T HE SIZE OF THE FAMILY ROOM WITH A WOOD BURNING FIREPLACE-DOUBLE OVEN-LARGE KITCHEN WITH EATING BAR-WILL NOT GO FHA OR VA-KEYED LOCKBOX-BRING AN OFFER.
-
2001-06-01soldstatus $56,000
-
2000-11-28$59,900 226-char remark
Show marketing remark (226 chars)
$12,000 DOWN AND THE OWNER WILL FINANCE-ROOMY HOME FOR A BIG FAMILY-CHECK T HE SIZE OF THE FAMILY ROOM WITH A WOOD BURNING FIREPLACE-DOUBLE OVEN-LARGE KITCHEN WITH EATING BAR-WILL NOT GO FHA OR VA-KEYED LOCKBOX-BRING AN OFFER.
-
1995-11-01soldstatus $14,000
-
1995-11-01soldstatus $4,700
ⓘ Source: listings_history table (triggers on properties + properties_extension) + one-shot
backfill from property_details.listing_events for pre-trigger history.
Tax reassessment forecast NC · Resets to sale price
- Current annual tax
- $596 · $50/mo
- Projected year-2 tax
- $2,082 · $173/mo
- Expected delta
- +$1,486/yr (+$124/mo · 249.4%)
ⓘ Screening estimate from a state-policy table — verify with the county assessor before closing.
Climate risk First Street
- Flood 1/10 Low FEMA zone X (unshaded) · 0% chance over 30 yrs
- Wildfire 4/10 Moderate
- Heat 6/10 Major 7 d/yr ≥106°F today · 17 d/yr by 30 yrs out
- Wind 6/10 Major 73% chance of damaging wind over 30 yrs
- Air quality 2/10 Low 1 unhealthy d/yr today · 1 by 30 yrs out
Nearby sold comps map
Loading sold comps map…
Walkable amenities ~0.75 mi
Loading nearby amenities…
Taxation est. · year 1
- Rental income
- $25,874
- − Mortgage interest
- −$14,222
- − Property taxes
- −$596
- − Insurance
- −$1,270
- − Repairs & maintenance
- −$2,070
- − Management
- −$2,070
- − Depreciation
- −$7,386
- Taxable loss
- −$1,740
- Est. tax savings @ 24.0%
- +$418
- After-tax cash flow
- $3,015/yr
For passive investors: Depreciation is non-cash, so a rental often shows a tax loss while cash-flowing — sheltering income. Rental losses are passive: they offset passive income freely, and up to $25,000/yr can offset ordinary (W-2) income if you actively participate and your MAGI is under $100k (phasing out to $0 by $150k); unused losses carry forward. On sale, claimed depreciation is recaptured at up to 25%, and gains may owe capital-gains tax (a 1031 exchange can defer both). Figures are a year-1 estimate at your 24.0% rate — not tax advice; consult a CPA.
Schools (NCES district)
- District
- Johnston County Public Schools
- NCES district ID
- 3702370
- Math proficiency
- 39% ▲ 4.00%
- Reading proficiency
- 42% ▲ 2.00%
- Median HH income
- $50,912
- Composite
- 34.99/100
- National rank
- #5052
- State rank
- #105 of 178 in NC
Livability — Angier
- Score
- 73/100
- State rank
- #69
- US rank
- #5182
Category grades
Schools grade is shown separately in the Schools card above.
Census & demographics
- County
- Harnett County · 125,715 people
- City population
- 24,806
- Metro
- Fayetteville, NC
- Population (ZIP)
- 24,806
- Household income
- $73,336
- Rent vs Own
- Severe rent burden
- 339.0
Population outlook (Johnston County) Hauer SSP2
- Today (2025)
- 222,440 people
- By 2030
- 240,227 · +8.0%
- By 2040
- 274,616 · +23.5%
- By 2050
- 304,915 · +37.1%
- By 2075
- 369,507 · +66.1%
- By 2100
- 406,280 · +82.6%
Race, ethnicity, and origin ACS 2023
- Neighborhood character
- Majority White (65%)
- Race & ethnicity
- White 65% Hispanic / Latino 20% Black 10% Two or more races 7% Asian 1%
- Hispanic origin (detail)
- Mexican 13%
- Common ancestry
- Slovak 2% Romanian 2% Lithuanian 1%
- Foreign-born
- 11% · Canada, China
- Languages at home
- 81% English-only · Spanish 16% Other Indo-European 1%
Political lean MEDSL · Johnston
- 2024 margin
- Strong R (+21.5) · D 38.7% · R 60.2% · Other 1.1%
- 2008→2024 swing
- +2.2pp toward D · 2008: -23.7pp · 2024: -21.5pp
- All cycles
- 2024: R+21.5 2020: R+24.3 2016: R+30.7 2012: R+27.8 2008: R+23.7
Not yet ingested
- Civics
- —
Market trends
- HPI YoY
- ▼ -31.84%
- Current HPI
- 248.5302
- Rent YoY
- ▲ 1.47%
- Metro
- Fayetteville, NC
- State GDP YoY
- ▲ 3.28%
- F500 in state
- 26
Industry mix (Fortune 500 HQ in NC)
| Industry | F500 HQs | Revenue |
|---|---|---|
| Financial Services | 2 | $213B |
|
||
| Retail | 2 | $95B |
|
||
| Industrial Conglomerate | 1 | $38B |
|
||
| Metals / Steel | 1 | $35B |
|
||
| Utilities | 1 | $30B |
|
||
| Industrial Machinery | 1 | $19B |
|
||
Price history
+1713.6% since first listed14 events — show timeline
- 2026-03-27 Pending — TMLS
- 2026-03-06 Price Changed $253,900 TMLS
- 2026-02-25 Relisted — TMLS
- 2026-01-16 Pending — TMLS
- 2026-01-08 Listed $254,900 TMLS
- 2026-01-07 Listing Removed — TMLS
- 2025-12-20 Price Changed $258,900 TMLS
- 2025-12-06 Listed $259,900 TMLS
- 2025-10-17 Sold (Public Records) $75,500 Public Records
- 2001-06-14 Sold (MLS) $56,000 TMLS
- 2001-06-01 Sold (Public Records) $56,000 Public Records
- 2000-11-28 Listed $59,900 TMLS
- 1995-11-01 Sold (Public Records) $4,700 Public Records
- 1995-11-01 Sold (Public Records) $14,000 Public Records
Property tax history
+1.5%/yrLatest (2025): $596 · +125.1% YoY. Source: county tax records.
Cash-flow waterfall
monthlySold comps — $/sqft
last 12 mo · ≤1 miLoading sold comps…