 Multi-family
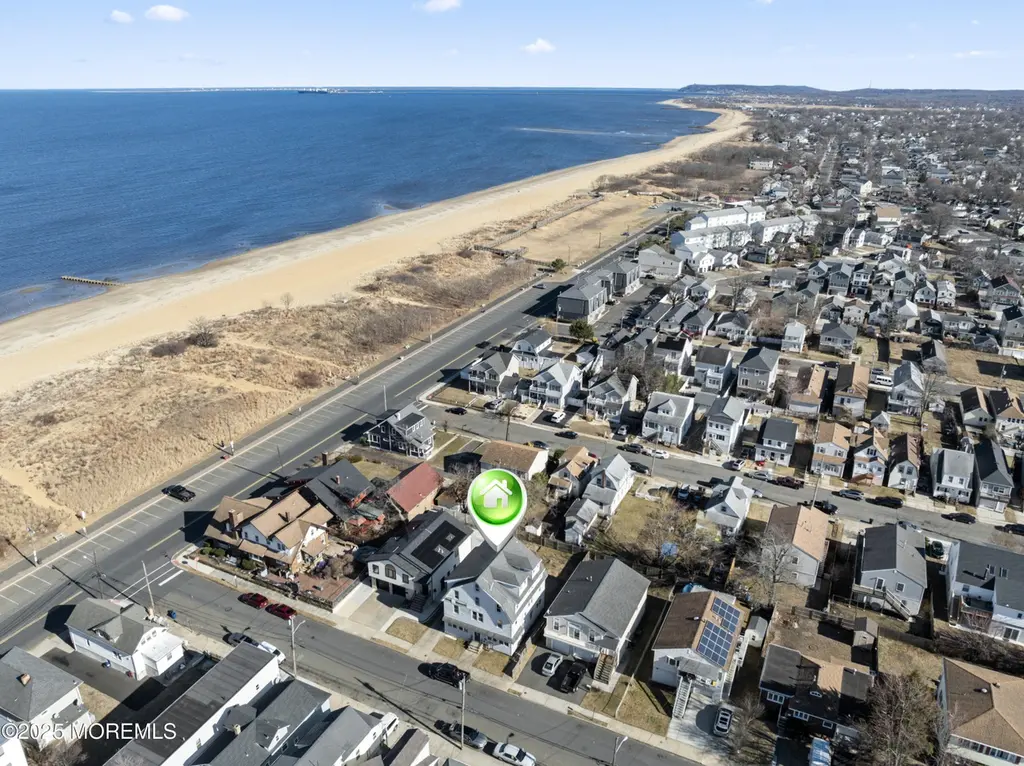
8 Oceanview Ave · Keansburg, NJ
Flood risk 9/10 · Severe
- FEMA flood zone
- AE
- Chance of flooding over 30 yrs
- 0.99%
- Est. flood insurance / yr
- $1,737 – $8,500
Fire risk 1/10 · Minimal
- Est. fire insurance / yr
- $526 – $976
Heat risk 8/10 · Major
- Hot days now (above 95°F)
- 8 days/yr
- Hot days in 30 yrs
- 18 days/yr
Wind risk 6/10 · Moderate
- Chance of severe wind over 30 yrs
- 72.0%
Air-quality risk 4/10 · Minor
- Unhealthy air days now
- 4 days/yr
- Unhealthy air days in 30 yrs
- 5 days/yr
Risk factors via First Street. Map © Google.
Why this score? — see what drove the F grade
The composite is a weighted blend of 9 inputs, each scored 0–100. Each bar is that input's sub-score; the figure is the points it added to the 100-point composite (weight × sub-score).
- ARV discount +7.5/15.0
- Livability +3.3/5.0
- Rent growth +2.5/5.0
- Condition / age +2.5/5.0
- Cash flow +1.6/30.0
- Schools +1.6/10.0
- 1% rule +0.0/10.0
- DSCR +0.0/10.0
- Appreciation +0.0/10.0
$650,000
🖨 Deal sheet 📄 Offer letter ✓ Due diligence
Multi-family units
County records classify this as Multi-Family (5+ Unit). Listing-text estimate: 1 unit. estimate disagrees with records
5+ unit building — per-unit beds/baths from public records are typically unavailable; the breakdown below (if shown) is an estimate from the listing text.
Listing remarks
Rare oversized 50x100 lot just homes from the beach offering a unique opportunity to build in a prime coastal location. This property presents potential for subdivision (buyer to verify) along with the ability to create a custom single-family home with possible waterviews from upper levels. Plans are currently in progress, providing a strong head start for future development. Located in close proximity to the beach, local amenities, and major transportation routes, this lot offers both lifestyle appeal and investment potential. A versatile opportunity for builders, investors, or end users looking to create a coastal residence with upside.
Key facts
- Steps to the beach
- 50 x100 lot
- Prime location
Tags
Property features AI
Finance
- Financial info: Parcel number 23-00017-0000-00012; Tax block 17, lot 12 (Tax year 2025); Tax assessed at 420000; Annual tax amount 9001
Exterior
- Home design: Individual ownership
- Construction: No construction details provided
- Exterior features: Bayfront location; Bayside exposure; Bayview
Interior
- Bathrooms: No bathrooms specified
- Interior features: No bathrooms specified
Neighborhood map
What this means for you Summary
Snapshot
- This is a multifamily listed at $650k.
Deal economics
- At list price, monthly cash flow is $-3k ($-35k/yr) — negative.
- To cash-flow at today's rent, offer at most $180k (72.3% below list).
- To meet the 1% rule (rent ≥ 1% of price), the offer needs to be $244k (62.5% below list).
- Recommended offer: $180k (72.3% below list) — sets the bar for cash-flow.
- Cap rate 1.7% vs local median 3.2% in Keansburg — below-typical yield; the buyer is paying a premium for something (appreciation thesis, condition, location) that the cap rate doesn't capture.
Location & tenants
- Location reads 66/100 on livability (#355 in NJ) — a middle-class / working-renter tenant base. Strengths: employment A+, housing A+, crime A-; Watch: cost of living D, schools F, amenities F.
- Keansburg School District (suburban): math 6% / reading 30% proficiency, ranked #443 of 472 in NJ (top 94%) — low school quality limits family demand, transient renter base, plan for 1-2y turnover.
- Market conditions: 106 active listings in the ZIP; solid renter incomes; 2,840 units permitted in Monmouth County in 2024 (484 in 5+ unit buildings).
- This rent runs 36% of the median local income ($82k/yr) — at the standard rent-burdened threshold; future hikes will face affordability resistance.
Forward outlook
- Local home prices are declining (-3.0%/yr); year-one equity from $4k of loan paydown is wiped out by about $20k of value loss. Plan a longer hold.
- Monmouth County population projected at -11% by 2050 — secular population decline; favor cash flow + early exit over multi-decade hold.
Negotiation context
- It's been on market 91 days — a 9% lower offer ($592k) is reasonable based on typical stale-listing flexibility.
- 4 sale attempts since 3y ago with the ask held roughly flat each time — persistent listings suggest the price (not the market) is what's stuck; bring a comps-based counter.
- Current owner paid $420k; list at $650k implies a 55% gain — meaningful room to come down on a strong offer.
Risks & watch-outs
- Watch-outs: flood insurance adds $427/mo; built in 1920 — expect roof / HVAC / electrical / plumbing capex.
- Climate carrying-cost: in FEMA flood zone AE (mandatory federal flood insurance); major wind risk, 72% chance of damaging wind over 30y; extreme-heat days projected 8→18/yr by 2055 (HVAC capex compounding) — expect insurance premiums to compound above CPI over the hold.
Questions for the listing agent
- What do current leases actually rent for vs. the listed asking? Can we see a recent rent roll and the last 12 months of T-12 income?
- It's been on market 91 days. Have you received any prior offers? Is the seller open to a 72% concession, seller financing, or rate buy-down credit?
- Built in 1920 — when were the roof, HVAC, electrical panel, plumbing, and water heater last replaced?
- What's the actual annual flood-insurance premium (NFIP or private), and is the property in a SFHA with mandatory coverage?
- Why hasn't it sold? Are there any deal-killer items the seller is aware of (foundation, flood, title, zoning, code violations)?
- Is there a deadline driving the sale (1031 exchange, divorce, estate, relocation)? That informs how much negotiation room exists.
- Schools are F-rated, which usually means shorter tenancies and higher turnover. Who's the typical renter profile here, and what's been the actual vacancy rate?
- The area grade is low — what's the realistic commute time and amenity access for the typical tenant pool here? Any planned neighborhood developments (good or bad) we should know about?
- What's the average days-on-market for RENTAL listings here right now (not sales)? A rising rental-DOM trend means longer vacancies and softer asking-rent achievability than the comps imply.
- What's the recent tenant-quality profile in this submarket — average credit score on applications, eviction rate, late-payment / NSF rate, and stable-employment percentage? A property-management company in the area should have these aggregated.
- How much new apartment / multifamily construction is in the pipeline within 1–3 miles? Heavy new supply (>2% of stock underway) typically softens rents 12–24 months out; light construction supports rent growth.
Investment metrics
- 1% rule
- 0.38% ✗
- Cap rate
- 1.67%
- Cash-on-cash
- -16.50%
- DSCR
- 0.27
- GRM
- 22.2
CMA / ARV
No comps found within radius.
Projected returns pro-forma
-3.0% appreciation · 3.0% rent growth · sell at horizon
- IRR
- -55.8%
- Equity multiple
- -0.60×
- Total profit
- $-291,585
- Equity at exit
- $96,917
- IRR
- —
- Equity multiple
- -1.71×
- Total profit
- $-493,019
- Equity at exit
- $56,200
Cash invested: $182,000 (down + closing). Projections, not guarantees.
Landlord ↔ Tenant lean methodology
- Overall (STATE)
- 21 Tenant-Leaning
- State New Jersey
- 21 Tenant-Leaning · D+6
- County
- — inherits STATE
- City
- — inherits STATE
ZIP-level market 07734
- Active inventory
- 106
- Price-to-rent
- 22.2×
Monthly cashflow live
- Estimated rent
- $2,440 medium interval (Pro) →
- Mortgage (P&I)
- −$3,409
- Tax from tax record
- −$750 /mo · $9,001/yr
- Insurance
- −$271
- Flood insurance flood zone
- −$427 /mo · $5,118/yr
- HOA
- −$0
- Vacancy / Maint / Mgmt
- −$512
- Net cashflow
- $-2,928
Break-even live
UW: 25.0% down · 7.5% · 30yr · 1.5% tax · 5.0% vac · 8.0% maint · 8.0% mgmt
Financing live
Cash to close
- Down payment
- $162,500
- Closing costs
- $19,500
- Reserves months
- —
- Total cash needed
- —
Loan-product check · same deal, 3 products live
Conventional
25% down · 7.5% · 30yr
- Down + closing
- —
- Monthly P&I
- —
- Monthly cashflow
- —
- DSCR
- —
- Eligible?
- —
Personal DTI + credit; lowest rate.
DSCR
20% down · 8.5% · 30yr
- Down + closing
- —
- Monthly P&I
- —
- Monthly cashflow
- —
- DSCR
- —
- Eligible?
- —
No personal income docs; deal must DSCR.
Hard money
10% down · 12.0% · 12mo
- Down + closing
- —
- Monthly P&I
- —
- Monthly cashflow
- —
- DSCR
- —
- Eligible?
- —
Short-term bridge; refi at stabilization.
Listing history 25 events
-
2026-06-18days on market $650,000 Active 91 DOM
-
2026-06-17days on market $650,000 Active 90 DOM
-
2026-06-16days on market $650,000 Active 89 DOM
-
2026-06-15days on market $650,000 Active 88 DOM
-
2026-06-13days on market $650,000 Active 86 DOM
-
2026-06-09days on market $650,000 Active 82 DOM
-
2026-06-08days on market $650,000 Active 81 DOM
-
2026-06-07days on market $650,000 Active 80 DOM
-
2026-06-04days on market $650,000 Active 77 DOM
-
2026-06-03days on market $650,000 Active 76 DOM
-
2026-06-02days on market $650,000 Active 75 DOM
-
2026-06-01days on market $650,000 Active 74 DOM
-
2026-05-31days on market $650,000 Active 73 DOM
-
2026-03-19$650,000 Active
-
2025-05-27$495,000 Active
-
2025-03-03$495,000 Active
-
2024-03-26soldstatus $419,900
-
2024-03-21soldstatus $419,900 Closed
-
2024-01-10status Pending
-
2023-10-06$419,900 Active
-
2018-09-04soldstatus $125,000
-
1999-03-23soldstatus $200,000
-
1998-01-26soldstatus $25,000
-
1987-09-18soldstatus $210,000
-
1985-08-01soldstatus $75,000
ⓘ Source: listings_history table (triggers on properties + properties_extension) + one-shot
backfill from property_details.listing_events for pre-trigger history.
Tax reassessment forecast NJ · Partial reset (capped growth)
- Current annual tax
- $9,001 · $750/mo
- Projected year-2 tax
- $12,593 · $1,049/mo
- Expected delta
- +$3,592/yr (+$299/mo · 39.9%)
ⓘ Screening estimate from a state-policy table — verify with the county assessor before closing.
Climate risk First Street
- Flood 9/10 Extreme FEMA zone AE · 99% chance over 30 yrs
- Wildfire 1/10 Low
- Heat 8/10 Severe 8 d/yr ≥95°F today · 18 d/yr by 30 yrs out
- Wind 6/10 Major 72% chance of damaging wind over 30 yrs
- Air quality 4/10 Moderate 4 unhealthy d/yr today · 5 by 30 yrs out
Nearby sold comps map
Loading sold comps map…
Walkable amenities ~0.75 mi
Loading nearby amenities…
Taxation est. · year 1
- Rental income
- $29,280
- − Mortgage interest
- −$36,410
- − Property taxes
- −$9,001
- − Insurance
- −$8,368
- − Repairs & maintenance
- −$2,342
- − Management
- −$2,342
- − Depreciation
- −$18,909
- Taxable loss
- −$48,093
- Est. tax savings @ 24.0%
- +$11,542
- After-tax cash flow
- $-23,600/yr
For passive investors: Depreciation is non-cash, so a rental often shows a tax loss while cash-flowing — sheltering income. Rental losses are passive: they offset passive income freely, and up to $25,000/yr can offset ordinary (W-2) income if you actively participate and your MAGI is under $100k (phasing out to $0 by $150k); unused losses carry forward. On sale, claimed depreciation is recaptured at up to 25%, and gains may owe capital-gains tax (a 1031 exchange can defer both). Figures are a year-1 estimate at your 24.0% rate — not tax advice; consult a CPA.
Schools (NCES district)
- District
- Keansburg School District
- NCES district ID
- 3407860
- Math proficiency
- 6% ▼ -12.00%
- Reading proficiency
- 30% ▲ 2.00%
- Median HH income
- $45,296
- Composite
- 15.71/100
- National rank
- #9281
- State rank
- #443 of 472 in NJ
Livability — Keansburg
- Score
- 66/100
- State rank
- #355
- US rank
- #11775
Category grades
Schools grade is shown separately in the Schools card above.
Census & demographics
- Census place
- Keansburg, NJ
- County
- Monmouth County · 505,557 people
- City population
- 12,925
- Metro
- New York-Newark-Jersey City, NY-NJ-PA
- Population (ZIP)
- 12,925
- Household income
- $82,029
- Rent vs Own
- Severe rent burden
- 485.0
Population outlook (Monmouth County) Hauer SSP2
- Today (2025)
- 620,308 people
- By 2030
- 612,309 · -1.3%
- By 2040
- 587,297 · -5.3%
- By 2050
- 551,342 · -11.1%
- By 2075
- 472,934 · -23.8%
- By 2100
- 381,534 · -38.5%
Race, ethnicity, and origin ACS 2023
- Neighborhood character
- Predominantly White (67%)
- Race & ethnicity
- White 67% Hispanic / Latino 19% Black 8% Two or more races 8% Asian 2%
- Hispanic origin (detail)
- Mexican 4% Puerto Rican 8% Cuban 1% Dominican 1%
- Common ancestry
- Romanian 3% Iranian 2% Lithuanian 1%
- Foreign-born
- 7% · Canada, Jamaica
- Languages at home
- 86% English-only · Spanish 10% Other Indo-European 2% German/W. Germanic 1%
Political lean MEDSL · Monmouth
- 2024 margin
- R (+11.4) · D 43.4% · R 54.8% · Other 1.8%
- 2008→2024 swing
- -7.7pp toward R · 2008: -3.7pp · 2024: -11.4pp
- All cycles
- 2024: R+11.4 2020: R+2.8 2016: R+9.5 2012: R+5.5 2008: R+3.7
Not yet ingested
- Civics
- —
Market trends
- HPI YoY
- ▼ -218.47%
- Current HPI
- 379.3764
- Rent YoY
- —
- Metro
- New York-Newark-Jersey City, NY-NJ-PA
- State GDP YoY
- ▲ 2.05%
- F500 in state
- 34
Industry mix (Fortune 500 HQ in NJ)
| Industry | F500 HQs | Revenue |
|---|---|---|
| Consumer Goods | 3 | $31B |
|
||
| Pharmaceuticals | 2 | $153B |
|
||
| Technology | 2 | $21B |
|
||
| Insurance | 2 | $20B |
|
||
| Healthcare | 2 | $19B |
|
||
| Financial Services | 1 | $70B |
|
||
Price history
+766.7% since first listed12 events — show timeline
- 2026-03-19 Listed $650,000 MOMLS
- 2025-05-27 Listed $495,000 MOMLS
- 2025-03-03 Listed $495,000 MOMLS
- 2024-03-26 Sold (Public Records) $419,900 Public Records
- 2024-03-21 Sold (MLS) $419,900 MOMLS
- 2024-01-10 Pending — MOMLS
- 2023-10-06 Listed $419,900 MOMLS
- 2018-09-04 Sold (Public Records) $125,000 Public Records
- 1999-03-23 Sold (Public Records) $200,000 Public Records
- 1998-01-26 Sold (Public Records) $25,000 Public Records
- 1987-09-18 Sold (Public Records) $210,000 Public Records
- 1985-08-01 Sold (Public Records) $75,000 Public Records
Property tax history
-1.3%/yrLatest (2025): $9,001 · -11.0% YoY. Source: county tax records.
Cash-flow waterfall
monthlySold comps — $/sqft
last 12 mo · ≤1 miLoading sold comps…