21269 Bracewell Rd · Bedias, TX
Flood risk 1/10 · Minimal
- FEMA flood zone
- X (unshaded)
- Chance of flooding over 30 yrs
- 0.0%
- Est. flood insurance / yr
- $507 – $1,088
Fire risk 6/10 · Moderate
- Est. fire insurance / yr
- $1,222 – $2,270
Heat risk 8/10 · Major
- Hot days now (above 111°F)
- 7 days/yr
- Hot days in 30 yrs
- 24 days/yr
Wind risk 8/10 · Major
- Chance of severe wind over 30 yrs
- 80.0%
Air-quality risk 1/10 · Minimal
- Unhealthy air days now
- 0 days/yr
- Unhealthy air days in 30 yrs
- 0 days/yr
Risk factors via First Street. Map © Google.
Why this score? — see what drove the D grade
The composite is a weighted blend of 9 inputs, each scored 0–100. Each bar is that input's sub-score; the figure is the points it added to the 100-point composite (weight × sub-score).
- ARV discount +15.0/15.0
- Cash flow +8.1/30.0
- Schools +4.3/10.0
- Appreciation +3.4/10.0
- Rent growth +2.5/5.0
- Condition / age +2.5/5.0
- DSCR +2.1/10.0
- 1% rule +2.0/10.0
- Livability +2.0/5.0
$175,000
🖨 Deal sheet (PDF) 📄 Offer letter ✓ Due diligence
Listing remarks MLS
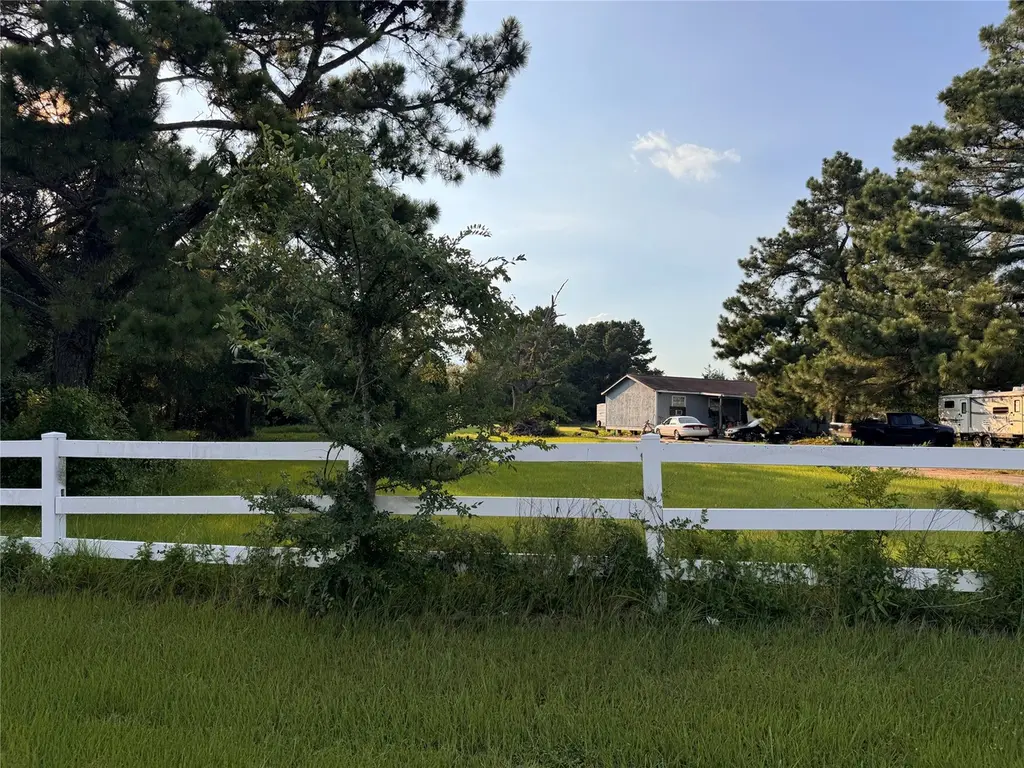
If you are looking for a piece of property in an unrestricted area, quiet neighborhood, with city water, scattered trees, wooded area in the back where you can observe wildlife you must take a look at this land. The house on the property is in need of many repairs. The house has 4 bedrooms, 2 bathrooms, living area, kitchen and dining area. There is a paved county-maintained road to the property which is located at the end of the street.
Key facts
- Observe wildlife
- City water
- Scattered trees
Tags
Neighborhood map
What this means for you Summary
Snapshot
- This is a 4-bed/2.0-bath single-family listed at $175k.
Deal economics
- At list price, monthly cash flow is $-175 ($-2k/yr) — negative.
- To cash-flow at today's rent, offer at most $144k (17.6% below list).
- To meet the 1% rule (rent ≥ 1% of price), the offer needs to be $123k (29.8% below list).
- Recommended offer: $123k (29.8% below list) — sets the bar for 1% rule.
- Cap rate 5.1% vs local median 2.8% in Bedias — top-decile yield for the area; either an underpriced asset or a hidden risk that comps aren't pricing in. Stress-test before assuming the spread holds.
Location & tenants
- Location reads 40/100 on livability (#1,601 in TX) — a working-class tenant base; expect higher turnover. Strengths: cost of living A+, crime A, housing B+; Watch: amenities F, commute F, employment F.
- Madisonville CISD (town): math 53% / reading 50% proficiency, ranked #177 of 826 in TX (top 21%) — acceptable for families but not a draw, mixed tenant base, ~2y average lease; 63% free/reduced lunch — lower-income household profile, screen leases tightly.
- Zoned schools: Madisonville El (700 students, 80% FRL); Madisonville J H (math 54% / reading 50%, grade C+, #301 of 1,662 statewide, top 19%, 546 students, 71% FRL); Madisonville H S (math 52% / reading 57%, grade C-, #379 of 1,632 statewide, top 26%, 695 students, 67% FRL).
- Market conditions: 117 active listings in the ZIP; 110 units permitted in Grimes County in 2024 (0 in 5+ unit buildings).
Forward outlook
- Local home prices are declining (-3.0%/yr); year-one equity from $1k of loan paydown is wiped out by about $5k of value loss. Plan a longer hold.
- Grimes County population projected at +10% by 2050 — modest demand growth; plan on rents tracking national, not racing it.
Negotiation context
- It's been on market 356 days — a 12% lower offer ($154k) is reasonable based on typical stale-listing flexibility.
Risks & watch-outs
- Climate carrying-cost: severe wind risk, 80% chance of damaging wind over 30y; major wildfire risk; extreme-heat days projected 7→24/yr by 2055 (HVAC capex compounding) — expect insurance premiums to compound above CPI over the hold.
Questions for the listing agent
- What do current leases actually rent for vs. the listed asking? Can we see a recent rent roll and the last 12 months of T-12 income?
- It's been on market 356 days. Have you received any prior offers? Is the seller open to a 30% concession, seller financing, or rate buy-down credit?
- Why hasn't it sold? Are there any deal-killer items the seller is aware of (foundation, flood, title, zoning, code violations)?
- Is there a deadline driving the sale (1031 exchange, divorce, estate, relocation)? That informs how much negotiation room exists.
- Schools are F-rated, which usually means shorter tenancies and higher turnover. Who's the typical renter profile here, and what's been the actual vacancy rate?
- The area grade is low — what's the realistic commute time and amenity access for the typical tenant pool here? Any planned neighborhood developments (good or bad) we should know about?
- What's the average days-on-market for RENTAL listings here right now (not sales)? A rising rental-DOM trend means longer vacancies and softer asking-rent achievability than the comps imply.
- What's the recent tenant-quality profile in this submarket — average credit score on applications, eviction rate, late-payment / NSF rate, and stable-employment percentage? A property-management company in the area should have these aggregated.
- How much new for-sale + rental construction is in the pipeline within 1–3 miles? Heavy new supply typically softens prices + rents 12–24 months out; constrained supply supports both.
Investment metrics
- 1% rule
- 0.70% ✗
- Cap rate
- 5.09%
- Cash-on-cash
- -4.28%
- DSCR
- 0.81
- GRM
- 11.9
CMA / ARV
- ARV (median comp)
- $254,989
- List price
- $175,000
- Delta
- -31.37%
- Verdict
- UNDERPRICED
- Comps
- 8 within 1.0 mi
Show comp detail 3 sales within ~0.75 mi
| Address | Dist | Beds/Ba | Sqft | Sold | Price | $/sf | Match |
|---|---|---|---|---|---|---|---|
| 4689 Oak Rdg | 0.30mi | 3/2.0 (-1) | 1,168 (-3%) | 12mo | $199,250 | $171 | 66 |
| 21692 Harrison Dr | 0.37mi | 3/2.0 (-1) | 1,218 (+2%) | 15mo | $275,000 | $226 | 63 |
| 21479 Harrison Dr | 0.53mi | 4/2.0 | 1,200 (0%) | 23mo | $166,000 | $138 | 56 |
Match score weights: distance 35% · size 25% · config 20% · recency 20%. Top-matched comps best support the ARV.
Projected returns pro-forma
-3.0% appreciation · 3.0% rent growth · sell at horizon
- IRR
- -23.5%
- Equity multiple
- 0.19×
- Total profit
- $-39,508
- Equity at exit
- $26,093
- IRR
- -18.4%
- Equity multiple
- 0.00×
- Total profit
- $-48,819
- Equity at exit
- $15,131
Cash invested: $49,000 (down + closing). Projections, not guarantees.
Landlord ↔ Tenant lean methodology
- Overall (STATE)
- 87 Strongly Landlord-Friendly
- State Texas
- 87 Strongly Landlord-Friendly · R+5
- County
- — inherits STATE
- City
- — inherits STATE
ZIP-level market 77831
- Home prices YoY
- -1.4%
- Active inventory
- 117
- Price-to-rent
- 11.9×
Monthly cashflow live
- Estimated rent
- $1,228 medium interval (Pro) →
- Mortgage (P&I)
- −$918
- Tax from tax record
- −$154 /mo · $1,848/yr
- Insurance
- −$73
- HOA
- −$0
- Vacancy / Maint / Mgmt
- −$258
- Net cashflow
- $-175
Break-even live
Sensitivity live
| Price | -10% $-76 | -5% $-125 | +0% $-175 | +5% $-224 | +10% $-274 |
|---|---|---|---|---|---|
| Rent | -10% $-272 | -5% $-223 | +0% $-175 | +5% $-126 | +10% $-78 |
| Rate | -1.0pp $-87 | -0.5pp $-130 | base $-175 | +0.5pp $-220 | +1.0pp $-266 |
UW: 25.0% down · 7.5% · 30yr · 1.5% tax · 5.0% vac · 8.0% maint · 8.0% mgmt
Financing live
Cash to close
- Down payment
- $43,750
- Closing costs
- $5,250
- Reserves months
- —
- Total cash needed
- —
Loan-product check · same deal, 3 products live
Conventional
25% down · 7.5% · 30yr
- Down + closing
- —
- Monthly P&I
- —
- Monthly cashflow
- —
- DSCR
- —
- Eligible?
- —
Personal DTI + credit; lowest rate.
DSCR
20% down · 8.5% · 30yr
- Down + closing
- —
- Monthly P&I
- —
- Monthly cashflow
- —
- DSCR
- —
- Eligible?
- —
No personal income docs; deal must DSCR.
Hard money
10% down · 12.0% · 12mo
- Down + closing
- —
- Monthly P&I
- —
- Monthly cashflow
- —
- DSCR
- —
- Eligible?
- —
Short-term bridge; refi at stabilization.
Listing history 20 events
-
2026-06-22days on market $175,000 Active 356 DOM
-
2026-06-19days on market $175,000 Active 354 DOM
-
2026-06-18days on market $175,000 Active 353 DOM
-
2026-06-17days on market $175,000 Active 352 DOM
-
2026-06-16days on market $175,000 Active 351 DOM
-
2026-06-15days on market $175,000 Active 350 DOM
-
2026-06-14days on market $175,000 Active 348 DOM
-
2026-06-13days on market $175,000 Active 347 DOM
-
2026-06-10days on market $175,000 Active 345 DOM
-
2026-06-09days on market $175,000 Active 344 DOM
-
2026-06-08days on market $175,000 Active 343 DOM
-
2026-06-07days on market $175,000 Active 342 DOM
-
2026-06-02days on market $175,000 Active 337 DOM
-
2026-06-01days on market $175,000 Active 336 DOM
-
2026-05-31days on market $175,000 Active 335 DOM
-
2026-05-30days on market $175,000 Active 334 DOM
-
2026-03-17price $175,000 444-char remark
Show marketing remark (444 chars)
If you are looking for a piece of property in an unrestricted area, quiet neighborhood, with city water, scattered trees, wooded area in the back where you can observe wildlife you must take a look at this land. The house on the property is in need of many repairs. The house has 4 bedrooms, 2 bathrooms, living area, kitchen and dining area. There is a paved county-maintained road to the property which is located at the end of the street.
-
2025-06-30$199,500 Active 444-char remark
Show marketing remark (444 chars)
If you are looking for a piece of property in an unrestricted area, quiet neighborhood, with city water, scattered trees, wooded area in the back where you can observe wildlife you must take a look at this land. The house on the property is in need of many repairs. The house has 4 bedrooms, 2 bathrooms, living area, kitchen and dining area. There is a paved county-maintained road to the property which is located at the end of the street.
-
2006-10-16soldstatus
-
2006-10-16soldstatus
ⓘ Source: listings_history table (triggers on properties + properties_extension) + one-shot
backfill from property_details.listing_events for pre-trigger history.
Tax reassessment forecast TX · Resets to sale price
- Current annual tax
- $1,848 · $154/mo
- Projected year-2 tax
- $3,202 · $267/mo
- Expected delta
- +$1,355/yr (+$113/mo · 73.3%)
ⓘ Screening estimate from a state-policy table — verify with the county assessor before closing.
Climate risk First Street
- Flood 1/10 Low FEMA zone X (unshaded) · 0% chance over 30 yrs
- Wildfire 6/10 Major
- Heat 8/10 Severe 7 d/yr ≥111°F today · 24 d/yr by 30 yrs out
- Wind 8/10 Severe 80% chance of damaging wind over 30 yrs
- Air quality 1/10 Low 0 unhealthy d/yr today · 0 by 30 yrs out
Nearby sold comps map
Loading sold comps map…
Walkable amenities ~0.75 mi
Loading nearby amenities…
Taxation est. · year 1
- Rental income
- $14,732
- − Mortgage interest
- −$9,803
- − Property taxes
- −$1,848
- − Insurance
- −$875
- − Repairs & maintenance
- −$1,179
- − Management
- −$1,179
- − Depreciation
- −$5,091
- Taxable loss
- −$5,241
- Est. tax savings @ 24.0%
- +$1,258
- After-tax cash flow
- $-839/yr
For passive investors: Depreciation is non-cash, so a rental often shows a tax loss while cash-flowing — sheltering income. Rental losses are passive: they offset passive income freely, and up to $25,000/yr can offset ordinary (W-2) income if you actively participate and your MAGI is under $100k (phasing out to $0 by $150k); unused losses carry forward. On sale, claimed depreciation is recaptured at up to 25%, and gains may owe capital-gains tax (a 1031 exchange can defer both). Figures are a year-1 estimate at your 24.0% rate — not tax advice; consult a CPA.
Schools (NCES district)
- District
- Madisonville CISD
- NCES district ID
- 4828710
- Math proficiency
- 53% ▼ -1.00%
- Reading proficiency
- 50% ▲ 7.00%
- Median HH income
- $39,234
- Composite
- 43.02/100
- National rank
- #3102
- State rank
- #177 of 826 in TX
Livability — Bedias
- Score
- 40/100
- State rank
- #1601
- US rank
- #27239
Category grades
Schools grade is shown separately in the Schools card above.
Census & demographics
- Population (ZIP)
- 3,163
Population outlook (Grimes County) Hauer SSP2
- Today (2025)
- 28,910 people
- By 2030
- 29,539 · +2.2%
- By 2040
- 30,648 · +6.0%
- By 2050
- 31,698 · +9.6%
- By 2075
- 34,351 · +18.8%
- By 2100
- 33,565 · +16.1%
Race, ethnicity, and origin ACS 2023
- Neighborhood character
- Predominantly White (75%)
- Race & ethnicity
- White 75% Hispanic / Latino 16% Two or more races 9% Black 8%
- Hispanic origin (detail)
- Mexican 15% Cuban 1%
- Common ancestry
- Italian 6% Iranian 3% Scottish 2%
- Foreign-born
- 3% · Canada
- Languages at home
- 91% English-only · Spanish 9%
Political lean MEDSL · Grimes
- 2024 margin
- Solid R (+60.3) · D 19.5% · R 79.7%
- 2008→2024 swing
- -25.9pp toward R · 2008: -34.3pp · 2024: -60.3pp
- All cycles
- 2024: R+60.3 2020: R+53.2 2016: R+51.1 2012: R+44.2 2008: R+34.3
Not yet ingested
- Civics
- —
Market trends
- HPI YoY
- ▼ -3.27%
- Current HPI
- 240.0197
- Rent YoY
- —
- Metro
- —
- State GDP YoY
- ▲ 3.95%
- F500 in state
- 110
Industry mix (Fortune 500 HQ in TX)
| Industry | F500 HQs | Revenue |
|---|---|---|
| Energy | 16 | $1,198B |
|
||
| Technology | 5 | $198B |
|
||
| Engineering / Construction | 4 | $72B |
|
||
| Energy Services | 3 | $60B |
|
||
| Utilities | 3 | $41B |
|
||
| Healthcare | 2 | $330B |
|
||
Price history
-12.3% since first listed4 events — show timeline
- 2026-03-17 Price Changed $175,000 HARMLS
- 2025-06-30 Listed $199,500 HARMLS
- 2006-10-16 Sold (Public Records) — Public Records
- 2006-10-16 Sold (Public Records) — Public Records
Property tax history
+6.7%/yrLatest (2025): $1,848 · +7.2% YoY. Source: county tax records.
Cash-flow waterfall
monthlySold comps — $/sqft
last 12 mo · ≤1 miLoading sold comps…