 Triplex
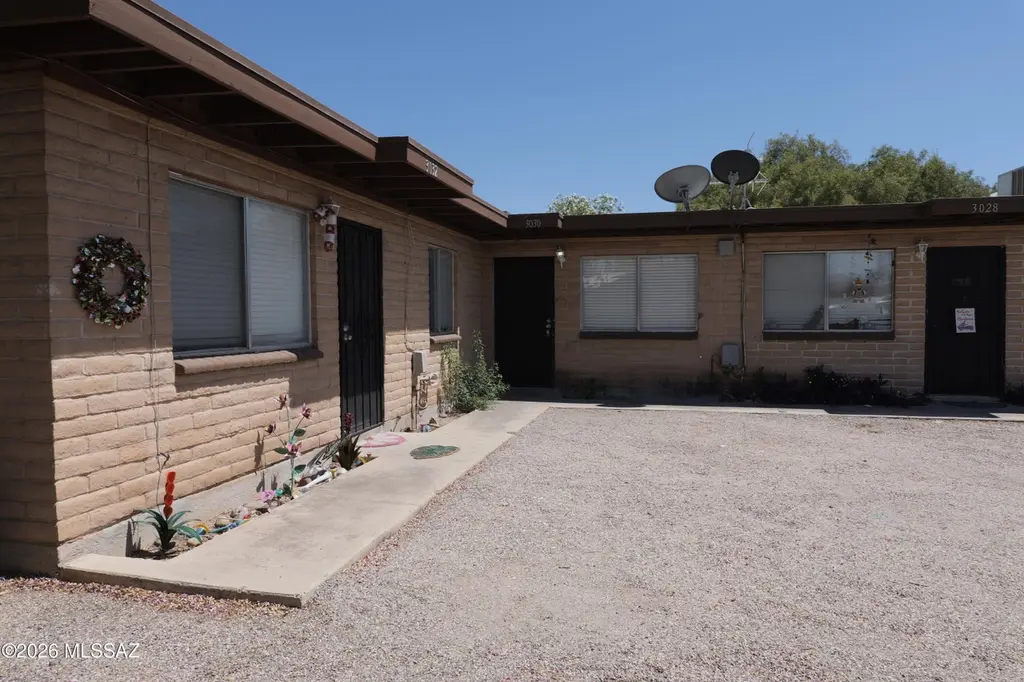
3028-3032 E Presidio Rd · Tucson, AZ
Flood risk 1/10 · Minimal
- FEMA flood zone
- X (unshaded)
- Chance of flooding over 30 yrs
- 0.0%
- Est. flood insurance / yr
- $507 – $1,088
Fire risk 1/10 · Minimal
- Est. fire insurance / yr
- $610 – $1,132
Heat risk 8/10 · Major
- Hot days now (above 106°F)
- 7 days/yr
- Hot days in 30 yrs
- 17 days/yr
Wind risk 1/10 · Minimal
- Chance of severe wind over 30 yrs
- —
Air-quality risk 1/10 · Minimal
- Unhealthy air days now
- 0 days/yr
- Unhealthy air days in 30 yrs
- 0 days/yr
Risk factors via First Street. Map © Google.
Why this score? — see what drove the F grade
The composite is a weighted blend of 9 inputs, each scored 0–100. Each bar is that input's sub-score; the figure is the points it added to the 100-point composite (weight × sub-score).
- Cash flow +8.0/30.0
- ARV discount +7.5/15.0
- Livability +3.7/5.0
- Rent growth +2.8/5.0
- Condition / age +2.5/5.0
- DSCR +2.1/10.0
- 1% rule +1.6/10.0
- Schools +1.6/10.0
- Appreciation +0.0/10.0
$469,000
🖨 Deal sheet 📄 Offer letter ✓ Due diligence
Multi-family units
County records classify this as Multi-Family (2-4 Unit). Listing-text estimate: 3 units. confirmed
Listing remarks MLS
Cash-conv-assume Qualifying. Units In Excellent Condition.Tenant Are Long Time Residents.Expense $ Are 1996 Actual.Rental Income $ Are Current.Sits Back Off Street.Units Include Refrigerators.Pls Do Not Disturb Tenants. Owner Lives In 3018.Ideal For Owner/Manager.Must Be Bought Separately
Key facts
- Central ac
- Off street parking
- Washer dryer hook up
Tags
Property features AI
Finance
- Other: Zoning: Tucson - R2
- Financial info: Three total units; Gross scheduled income: $38,100; Gross income: $36,957; Net operating income: $29,649; Operating expenses: $7,308; Insurance expense: $1,100; Water/sewer expense: $1,400; Annual taxes (2024): $2,808
Exterior
- Parking: Six parking spaces total; Parking on property for each unit
- Utilities: Public water; Sewer connected
- Home design: Triplex (multifamily property); Single-story units
- Construction: Block construction; Built-up roof
- Exterior features: Chain link and wood fencing; North/South exposure; Paved city-maintained road
Interior
- Kitchen: Electric range; Dishwasher; Refrigerator
- Bedrooms: Two 2-bedroom units (both single-story, first-floor); One 1-bedroom unit (single-story)
- Flooring: Ceramic tile; Vinyl
- Bathrooms: Each unit has one full bathroom
- Heating & cooling: Gas pack heating; Central air conditioning
- Interior features: Electric range, dishwasher, refrigerator; Storage
- Laundry & utility: On-site storage
Neighborhood map
What this means for you Summary
Snapshot
- This is a 2×2bd/1.0ba + 1×1bd/1.0ba units multifamily listed at $469k.
Deal economics
- At list price, monthly cash flow is $-471 ($-6k/yr) — negative. Per door: $-157/mo.
- To cash-flow at today's rent, offer at most $386k (17.7% below list).
- To meet the 1% rule (rent ≥ 1% of price), the offer needs to be $307k (34.5% below list).
- Recommended offer: $307k (34.5% below list) — sets the bar for 1% rule.
- Cap rate 5.1% vs local median 3.7% in Tucson — top-decile yield for the area; either an underpriced asset or a hidden risk that comps aren't pricing in. Stress-test before assuming the spread holds.
Location & tenants
- Location reads 74/100 on livability (#17 in AZ, #4,502 nationally) — a middle-class / working-renter tenant base. Strengths: commute A+, cost of living A+, housing A+; Watch: health & safety C-, crime F, employment D-.
- Tucson Unified District (4403) (urban): math 14% / reading 23% proficiency, ranked #190 of 249 in AZ (top 76%) — low school quality limits family demand, transient renter base, plan for 1-2y turnover.
- Zoned schools: Blenman Elementary School (math 2% / reading 12%, grade F, #1,064 of 1,109 statewide, top 97%, 267 students, 78% FRL); Doolen Middle School (math 11% / reading 17%, grade F, #164 of 218 statewide, top 76%, 538 students, 67% FRL); Sabino High School (math 27% / reading 37%, grade F, #104 of 381 statewide, top 28%, 862 students, 25% FRL) — zoned schools at 56% FRL track the district average.
- Market conditions: Rents rising (+1.4%/yr); 143 active listings in the ZIP; 5,268 units permitted in Pima County in 2024 (996 in 5+ unit buildings).
- At $3,073/mo this rent would consume 75% of the median local household income ($49k/yr) (locally 2241% of renters already pay >50% of income on rent) — very limited rent-growth headroom before tenants either downsize or default.
Forward outlook
- Local home prices are declining (-3.0%/yr); year-one equity from $3k of loan paydown is wiped out by about $14k of value loss. Plan a longer hold.
- Pima County population projected at +8% by 2050 — modest demand growth; plan on rents tracking national, not racing it.
Negotiation context
- Only 8 days on market — expect competitive offers; lowballing is unlikely to land.
- 3 sale attempts since 29y ago with the ask held roughly flat each time — persistent listings suggest the price (not the market) is what's stuck; bring a comps-based counter.
- Current owner paid $249k; list at $469k implies a 88% gain — meaningful room to come down on a strong offer.
Risks & watch-outs
- Climate carrying-cost: extreme-heat days projected 7→17/yr by 2055 (HVAC capex compounding) — expect insurance premiums to compound above CPI over the hold.
Questions for the listing agent
- What do current leases actually rent for vs. the listed asking? Can we see a recent rent roll and the last 12 months of T-12 income?
- Can we see the unit-by-unit rent roll, current vacancy, and any below-market leases? What's the average tenancy length?
- What capital expenditures (roof, boiler, parking lot, exteriors) have been made in the last 5 years, and what's planned in the next 2?
- Built in 1979 — when were the roof, HVAC, electrical panel, plumbing, and water heater last replaced?
- Is there a deadline driving the sale (1031 exchange, divorce, estate, relocation)? That informs how much negotiation room exists.
- Schools are D-rated, which usually means shorter tenancies and higher turnover. Who's the typical renter profile here, and what's been the actual vacancy rate?
- Crime grade is F in this area — have there been break-ins, vandalism, or insurance claims at this property in the last 3 years? What carrier currently insures it and at what premium?
- The area grade is low — what's the realistic commute time and amenity access for the typical tenant pool here? Any planned neighborhood developments (good or bad) we should know about?
- What's the average days-on-market for RENTAL listings here right now (not sales)? A rising rental-DOM trend means longer vacancies and softer asking-rent achievability than the comps imply.
- What's the recent tenant-quality profile in this submarket — average credit score on applications, eviction rate, late-payment / NSF rate, and stable-employment percentage? A property-management company in the area should have these aggregated.
- How much new apartment / multifamily construction is in the pipeline within 1–3 miles? Heavy new supply (>2% of stock underway) typically softens rents 12–24 months out; light construction supports rent growth.
Investment metrics
- 1% rule
- 0.66% ✗
- Cap rate
- 5.09%
- Cash-on-cash
- -4.31%
- DSCR
- 0.81
- GRM
- 12.7
CMA / ARV
No comps found within radius.
Projected returns pro-forma
-3.0% appreciation · 1.39% rent growth · sell at horizon
- IRR
- -25.2%
- Equity multiple
- 0.15×
- Total profit
- $-111,070
- Equity at exit
- $69,929
- IRR
- -26.4%
- Equity multiple
- -0.18×
- Total profit
- $-155,490
- Equity at exit
- $40,551
Cash invested: $131,320 (down + closing). Projections, not guarantees.
Landlord ↔ Tenant lean methodology
- Overall (STATE)
- 87 Strongly Landlord-Friendly
- State Arizona
- 87 Strongly Landlord-Friendly · R+3
- County
- — inherits STATE
- City
- — inherits STATE
ZIP-level market 85716
- Rents YoY
- 1.4%
- Active inventory
- 143
- Price-to-rent
- 37.2×
Monthly cashflow live
- Estimated rent
- $3,073 high interval (Pro) →
- Mortgage (P&I)
- −$2,459
- Tax from tax record
- −$244 /mo · $2,927/yr
- Insurance
- −$195
- HOA
- −$0
- Vacancy / Maint / Mgmt
- −$645
- Net cashflow
- $-471
Break-even live
3-unit breakdown (identical units grouped — click to expand)
| Units | Beds | Baths | Est. rent |
|---|---|---|---|
| 2× units | 2 | 1 | $2,100 |
| #1 | 2 | 1 | $1,050 |
| #2 | 2 | 1 | $1,050 |
| 1× unit | 1 | 1 | $972 |
| Total (3 units) | $3,073 | ||
UW: 25.0% down · 7.5% · 30yr · 1.5% tax · 5.0% vac · 8.0% maint · 8.0% mgmt
Financing live
Cash to close
- Down payment
- $117,250
- Closing costs
- $14,070
- Reserves months
- —
- Total cash needed
- —
Loan-product check · same deal, 3 products live
Conventional
25% down · 7.5% · 30yr
- Down + closing
- —
- Monthly P&I
- —
- Monthly cashflow
- —
- DSCR
- —
- Eligible?
- —
Personal DTI + credit; lowest rate.
DSCR
20% down · 8.5% · 30yr
- Down + closing
- —
- Monthly P&I
- —
- Monthly cashflow
- —
- DSCR
- —
- Eligible?
- —
No personal income docs; deal must DSCR.
Hard money
10% down · 12.0% · 12mo
- Down + closing
- —
- Monthly P&I
- —
- Monthly cashflow
- —
- DSCR
- —
- Eligible?
- —
Short-term bridge; refi at stabilization.
Listing history 6 events
-
2026-06-18days on market $469,000 Active 8 DOM
-
2026-06-17days on market $469,000 Active 7 DOM
-
2026-06-16days on market $469,000 Active 6 DOM
-
2026-06-15days on market $469,000 Active 5 DOM
-
2026-06-13remarks 654-char remark
-
2026-06-13$469,000 Active 3 DOM
ⓘ Source: listings_history table (triggers on properties + properties_extension) + one-shot
backfill from property_details.listing_events for pre-trigger history.
Tax reassessment forecast AZ · Resets to sale price
- Current annual tax
- $2,927 · $244/mo
- Projected year-2 tax
- $3,095 · $258/mo
- Expected delta
- +$168/yr (+$14/mo · 5.7%)
ⓘ Screening estimate from a state-policy table — verify with the county assessor before closing.
Climate risk First Street
- Flood 1/10 Low FEMA zone X (unshaded) · 0% chance over 30 yrs
- Wildfire 1/10 Low
- Heat 8/10 Severe 7 d/yr ≥106°F today · 17 d/yr by 30 yrs out
- Wind 1/10 Low
- Air quality 1/10 Low 0 unhealthy d/yr today · 0 by 30 yrs out
Nearby sold comps map
Loading sold comps map…
Walkable amenities ~0.75 mi
Loading nearby amenities…
Taxation est. · year 1
- Rental income
- $36,876
- − Mortgage interest
- −$26,271
- − Property taxes
- −$2,927
- − Insurance
- −$2,345
- − Repairs & maintenance
- −$2,950
- − Management
- −$2,950
- − Depreciation
- −$13,644
- Taxable loss
- −$14,211
- Est. tax savings @ 24.0%
- +$3,411
- After-tax cash flow
- $-2,243/yr
For passive investors: Depreciation is non-cash, so a rental often shows a tax loss while cash-flowing — sheltering income. Rental losses are passive: they offset passive income freely, and up to $25,000/yr can offset ordinary (W-2) income if you actively participate and your MAGI is under $100k (phasing out to $0 by $150k); unused losses carry forward. On sale, claimed depreciation is recaptured at up to 25%, and gains may owe capital-gains tax (a 1031 exchange can defer both). Figures are a year-1 estimate at your 24.0% rate — not tax advice; consult a CPA.
Schools (NCES district)
- District
- Tucson Unified District (4403)
- NCES district ID
- 0408800
- Math proficiency
- 14% ▼ -17.00%
- Reading proficiency
- 23% ▼ -11.00%
- Median HH income
- $40,962
- Composite
- 15.78/100
- National rank
- #9270
- State rank
- #190 of 249 in AZ
Livability — Tucson
- Score
- 74/100
- State rank
- #17
- US rank
- #4502
Category grades
Schools grade is shown separately in the Schools card above.
Census & demographics
- Census place
- Tucson, AZ
- County
- Pima County · 1,012,107 people
- City population
- 839,336
- Metro
- Tucson, AZ
- Population (ZIP)
- 32,976
- Household income
- $49,061
- Rent vs Own
- Severe rent burden
- 2241.0
Population outlook (Pima County) Hauer SSP2
- Today (2025)
- 1,066,056 people
- By 2030
- 1,086,684 · +1.9%
- By 2040
- 1,117,160 · +4.8%
- By 2050
- 1,149,778 · +7.9%
- By 2075
- 1,271,480 · +19.3%
- By 2100
- 1,321,160 · +23.9%
Race, ethnicity, and origin ACS 2023
- Neighborhood character
- Diverse neighborhood (Simpson 0.57)
- Race & ethnicity
- White 60% Hispanic / Latino 25% Two or more races 16% Black 5% Pacific Islander 2% Asian 2%
- Hispanic origin (detail)
- Mexican 22%
- Common ancestry
- Lithuanian 3% Slovak 3% Portuguese 3%
- Foreign-born
- 11% · Canada, China
- Languages at home
- 80% English-only · Spanish 14% Other Asian/Pacific 1% Russian/Polish/Slavic 1%
Political lean MEDSL · Pima
- 2024 margin
- D (+15.2) · D 57.0% · R 41.8% · Other 1.2%
- 2008→2024 swing
- +9.1pp toward D · 2008: 6.1pp · 2024: 15.2pp
- All cycles
- 2024: D+15.2 2020: D+18.7 2016: D+13.5 2012: D+5.8 2008: D+6.1
Not yet ingested
- Civics
- —
Market trends
- HPI YoY
- ▼ -438.84%
- Current HPI
- 274.9061
- Rent YoY
- ▲ 1.39%
- Metro
- Tucson, AZ
- State GDP YoY
- ▲ 4.54%
- F500 in state
- 20
Industry mix (Fortune 500 HQ in AZ)
| Industry | F500 HQs | Revenue |
|---|---|---|
| Technology | 2 | $13B |
|
||
| Mining / Metals | 1 | $23B |
|
||
| Environmental Services | 1 | $16B |
|
||
| Metals / Steel | 1 | $14B |
|
||
| Technology Distribution | 1 | $9B |
|
||
| Homebuilding | 1 | $8B |
|
||
Price history
+369.0% since first listed10 events — show timeline
- 2026-06-10 Listed $469,000 MLSSAZ
- 2025-09-28 Listing Removed — MLSSAZ
- 2025-08-24 Price Changed $459,000 MLSSAZ
- 2025-07-24 Price Changed $469,000 MLSSAZ
- 2025-07-07 Listed $479,000 MLSSAZ
- 2021-06-21 Sold (Public Records) $248,937 Public Records
- 1998-01-30 Sold (Public Records) $131,000 Public Records
- 1998-01-30 Sold (MLS) $131,000 MLSSAZ
- 1997-09-25 Listed $135,000 MLSSAZ
- 1987-02-18 Sold (Public Records) $100,000 Public Records
Property tax history
+2.8%/yrLatest (2025): $2,927 · +4.2% YoY. Source: county tax records.
Cash-flow waterfall
monthlySold comps — $/sqft
last 12 mo · ≤1 miLoading sold comps…