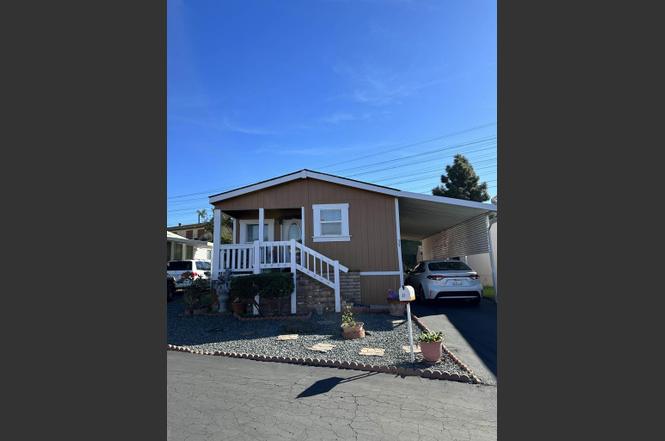
1425 Second Ave #37 · Chula Vista, CA
Flood risk 1/10 · Minimal
- FEMA flood zone
- X (unshaded)
- Chance of flooding over 30 yrs
- 0.0%
- Est. flood insurance / yr
- $507 – $1,088
Fire risk 1/10 · Minimal
- Est. fire insurance / yr
- $659 – $1,223
Heat risk 4/10 · Minor
- Hot days now (above 86°F)
- 6 days/yr
- Hot days in 30 yrs
- 16 days/yr
Wind risk 1/10 · Minimal
- Chance of severe wind over 30 yrs
- —
Air-quality risk 1/10 · Minimal
- Unhealthy air days now
- 0 days/yr
- Unhealthy air days in 30 yrs
- 0 days/yr
Risk factors via First Street. Map © Google.
Why this score? — see what drove the C grade
The composite is a weighted blend of 9 inputs, each scored 0–100. Each bar is that input's sub-score; the figure is the points it added to the 100-point composite (weight × sub-score).
- Cash flow +30.0/30.0
- DSCR +10.0/10.0
- 1% rule +7.8/10.0
- Schools +3.9/10.0
- Livability +3.8/5.0
- Condition / age +2.5/5.0
- Rent growth +1.9/5.0
- ARV discount +0.0/15.0
- Appreciation +0.0/10.0
$240,000
🖨 Deal sheet 📄 Offer letter ✓ Due diligence
Listing remarks
Beautifully maintained 3 bedroom, 2 full bath manufactured home nestled in the heart of Chula Vista with new water proof laminate flooring and recent master bathroom upgrades and walk in shower. This home has been well cared for and it shows! You will love the location close to shopping, freeways, schools, SD/MX border and light drive to downtown San Diego. Carport fits two vehicles comfortaby and there is a storage shed already on site. Quiet location with laundry, pool and special events on site. Buyers must submit application for approval by office management. Space rental fee is $1240/month. 55+ community.
Key facts
- Storage shed
- Laundry on site
- Walk in shower
Tags
Property features AI
Finance
- Other: Rent (land lease) includes gardener, gas, electric, water, sewer, trash, pool and all utilities
- Financial info: Land lease applies
- HOA & community: Senior community; Park name: Palace Garden Mobile Home Park; Community features include biking, sidewalks and urban setting; Manager approval required; Pets allowed (dogs and cats)
Exterior
- Parking: 3 parking spaces total; 2 covered carport spaces (attached carport); 1 uncovered space; On-site parking with asphalt driveway and built-in storage
- Utilities: Public sewer
- Home design: Mobile home (20' x 59') — mobile home remains on site; Single-story; North-facing; Raised foundation; Lot is level/flat and landscaped; Near public transit and park; close to clubhouse; front and back yard; garden
- Construction: Raised foundation
- Exterior features: Covered front porch; Awning; Balcony; In-ground community pool; Shed
Interior
- Kitchen: Free standing gas range; Dishwasher; Gas water heater
- Bedrooms: All bedrooms on main level
- Flooring: Laminate flooring
- Bathrooms: 2 full bathrooms
- Heating & cooling: Forced air heating; Wall/window cooling
- Interior features: Front entry; One-level living; Updated / remodeled condition; Primary bedroom; Living room; Entry; Primary bathroom
- Laundry & utility: Indoor laundry area
Neighborhood map
What this means for you Summary
Snapshot
- This is a 3-bed/2.0-bath manufactured listed at $240k.
Deal economics
- At list price, monthly cash flow is $984 ($12k/yr) — positive.
- The deal already cash-flows at list — no discount required.
- Meets the 1% rule at list price ($3k rent vs $240k).
- Recommended offer: $211k (12.0% below list) — sets the bar for market timing.
- Cap rate 11.2% vs local median 2.7% in Chula Vista — top-decile yield for the area; either an underpriced asset or a hidden risk that comps aren't pricing in. Stress-test before assuming the spread holds.
Location & tenants
- Location reads 75/100 on livability (#127 in CA, #4,345 nationally) — a middle-class / working-renter tenant base. Strengths: amenities A+, commute A+, employment A+; Watch: health & safety C-, cost of living F.
- Sweetwater Union High (suburban): math 36% / reading 52% proficiency, ranked #187 of 517 in CA (top 36%) — families likely to look elsewhere, expect single-tenant / working-renter base with shorter leases.
- Zoned schools: Castle Park Middle (math 26% / reading 27%, grade F, #252 of 498 statewide, top 51%, 724 students, 80% FRL); Castle Park Senior High (math 30% / reading 56%, grade F, #460 of 1,170 statewide, top 40%, 1,433 students, 81% FRL) — zoned schools average 80% FRL vs 53% district-wide (27 pts higher); higher-poverty schools than district average — tighter screening recommended.
- Market conditions: Rents soft (-2.6%/yr); 159 active listings in the ZIP; 30 comparable units currently listed for rent nearby; rentals leasing fast (median 2d on market — plan ~1-2 weeks tenant-placement turnaround); solid renter incomes; 11,759 units permitted in San Diego County in 2024 (7,244 in 5+ unit buildings).
- This rent runs 45% of the median local income ($82k/yr) — at the standard rent-burdened threshold; future hikes will face affordability resistance.
Forward outlook
- Local home prices are declining (-3.0%/yr); year-one equity from $2k of loan paydown is wiped out by about $7k of value loss. Plan a longer hold.
- San Diego County population projected at +20% by 2050 — long-run rental-demand tailwind backs the buy-and-hold thesis.
- At projected returns (-3.0% appreciation + 0.0% rent growth), your $67k cash investment doubles in ~10 years — after that, you're playing with house money.
Negotiation context
- It's been on market 162 days — a 12% lower offer ($211k) is reasonable based on typical stale-listing flexibility.
- 4 sale attempts since 3y ago; this cycle's ask has dropped $20k (8%) from the opening price — seller is motivated, your offer sets the floor, not the list.
Questions for the listing agent
- It's been on market 162 days. Have you received any prior offers? Is the seller open to a 12% concession, seller financing, or rate buy-down credit?
- Why hasn't it sold? Are there any deal-killer items the seller is aware of (foundation, flood, title, zoning, code violations)?
- Is there a deadline driving the sale (1031 exchange, divorce, estate, relocation)? That informs how much negotiation room exists.
- Schools are B-rated — typically a magnet for longer-tenancy family renters. What's the average tenant stay here, and is there a school-zone premium baked into asking?
- What's the average days-on-market for RENTAL listings here right now (not sales)? A rising rental-DOM trend means longer vacancies and softer asking-rent achievability than the comps imply.
- What's the recent tenant-quality profile in this submarket — average credit score on applications, eviction rate, late-payment / NSF rate, and stable-employment percentage? A property-management company in the area should have these aggregated.
- How much new for-sale + rental construction is in the pipeline within 1–3 miles? Heavy new supply typically softens prices + rents 12–24 months out; constrained supply supports both.
Investment metrics
- 1% rule
- 1.28% ✓
- Cap rate
- 11.21%
- Cash-on-cash
- 17.58%
- DSCR
- 1.78
- GRM
- 6.5
CMA / ARV
- ARV (on-the-fly)
- $204,258
- Comps found
- 12
Show comp detail 12 sales within ~0.75 mi
| Address | Dist | Beds/Ba | Sqft | Sold | Price | $/sf | Match |
|---|---|---|---|---|---|---|---|
| 1425 2nd Ave #88 | 0.00mi | 2/2.0 (-1) | 1,120 (-3%) | 8mo | $174,000 | $155 | 84 |
| 121 Orange Ave Spc 32 | 0.29mi | 3/2.0 | 1,139 (-1%) | 8mo | $185,000 | $162 | 77 |
| 1425 Second Ave #156 | 0.05mi | 2/2.0 (-1) | 1,101 (-5%) | 11mo | $195,000 | $177 | 76 |
| 1425 2nd Ave #150 | 0.00mi | 2/2.0 (-1) | 1,018 (-12%) | 0mo | $242,000 | $238 | 75 |
| 1425 2nd Ave #15 | 0.05mi | 3/2.0 | 1,238 (+7%) | 18mo | $260,000 | $210 | 71 |
| 1425 ST 2nd Ave | 0.11mi | 2/2.0 (-1) | 1,000 (-13%) | 2mo | $145,000 | $145 | 66 |
| 1425 2nd Ave #27 | 0.05mi | 3/2.0 | 1,020 (-12%) | 16mo | $230,719 | $226 | 65 |
| 1500 3rd Ave #76 | 0.48mi | 3/2.0 | 1,200 (+4%) | 11mo | $185,000 | $154 | 62 |
| 121 Orange #6 | 0.29mi | 2/2.0 (-1) | 1,250 (+8%) | 8mo | $230,000 | $184 | 61 |
| 1500 Third Ave #88 | 0.48mi | 3/2.0 | 1,198 (+4%) | 14mo | $249,900 | $209 | 60 |
| 121 Orange Ave Spc 75 | 0.29mi | 3/2.0 | 1,027 (-11%) | 14mo | $150,000 | $146 | 56 |
| 444 Anita St #55 | 0.71mi | 2/2.0 (-1) | 1,022 (-11%) | 11mo | $153,000 | $150 | 34 |
Match score weights: distance 35% · size 25% · config 20% · recency 20%. Top-matched comps best support the ARV.
Projected returns pro-forma
-3.0% appreciation · 0.0% rent growth · sell at horizon
- IRR
- 5.8%
- Equity multiple
- 1.22×
- Total profit
- $14,700
- Equity at exit
- $35,785
- IRR
- 12.6%
- Equity multiple
- 1.87×
- Total profit
- $58,349
- Equity at exit
- $20,751
Cash invested: $67,200 (down + closing). Projections, not guarantees.
Landlord ↔ Tenant lean methodology
- Overall (STATE)
- 18 Strongly Tenant-Friendly
- State California
- 18 Strongly Tenant-Friendly · D+13
- County
- — inherits STATE
- City
- — inherits STATE
ZIP-level market 91911
- Rents YoY
- -2.6%
- Active inventory
- 159
- Price-to-rent
- 6.5×
Monthly cashflow live
- Estimated rent
- $3,075 high interval (Pro) →
- Mortgage (P&I)
- −$1,259
- Tax from tax record
- −$86 /mo · $1,038/yr
- Insurance
- −$100
- HOA
- −$0
- Vacancy / Maint / Mgmt
- −$646
- Net cashflow
- $984
Break-even live
UW: 25.0% down · 7.5% · 30yr · 1.5% tax · 5.0% vac · 8.0% maint · 8.0% mgmt
Financing live
Cash to close
- Down payment
- $60,000
- Closing costs
- $7,200
- Reserves months
- —
- Total cash needed
- —
Loan-product check · same deal, 3 products live
Conventional
25% down · 7.5% · 30yr
- Down + closing
- —
- Monthly P&I
- —
- Monthly cashflow
- —
- DSCR
- —
- Eligible?
- —
Personal DTI + credit; lowest rate.
DSCR
20% down · 8.5% · 30yr
- Down + closing
- —
- Monthly P&I
- —
- Monthly cashflow
- —
- DSCR
- —
- Eligible?
- —
No personal income docs; deal must DSCR.
Hard money
10% down · 12.0% · 12mo
- Down + closing
- —
- Monthly P&I
- —
- Monthly cashflow
- —
- DSCR
- —
- Eligible?
- —
Short-term bridge; refi at stabilization.
Rent comps 30 comps
| Address | Beds | Baths | Sqft | Rent | $/sqft | DOM | Units | Dist |
|---|---|---|---|---|---|---|---|---|
| 240 Quintard St Chula Vista, CA | 1.0–2.0 | 1.0 | 662 | $2,400 | $3.62 | 1d | 4 | 0.19mi |
| 172 Palomar St Chula Vista, CA | 3.0 | 1.5 | 1152 | $3,400 | $2.95 | 10d | 1 | 0.36mi |
| 307 Orange Ave Chula Vista, CA | 1.0–2.0 | 1.0–2.0 | 662 | $2,225 | $3.36 | 1d | 2 | 0.42mi |
| 317 Tremont St Unit 5 Chula Vista, CA | 2.0 | 1.0 | 870 | $2,295 | $2.64 | 1d | 1 | 0.52mi |
| 128 Henry Ln Unit B Chula Vista, CA | 2.0 | 1.0 | 1000 | $2,100 | $2.10 | 1d | 1 | 0.59mi |
| 1311 Fourth Ave Chula Vista, CA | 3.0 | 1.0–2.0 | 824 | $3,840 | $4.66 | 1d | 9 | 0.65mi |
| 393 Montgomery St Unit 4 Chula Vista, CA | 2.0 | 1.0 | 757 | $2,095 | $2.77 | 10d | 1 | 0.71mi |
| 71 E Palomar St Chula Vista, CA | 3.0 | 2.0 | 1388 | $3,500 | $2.52 | 13d | 1 | 0.72mi |
| 1240 Fourth Ave Chula Vista, CA | 3.0 | 1.0 | 1000 | $4,588 | $4.59 | 2d | 1 | 0.80mi |
| 3865 Main St Chula Vista, CA | 2.0 | 2.0 | 741 | $2,950 | $3.98 | 14d | 1 | 0.82mi |
| 1169 Hilltop Dr Chula Vista, CA | 3.0 | 2.0 | 1120 | $4,000 | $3.57 | 2d | 1 | 0.84mi |
| 3875 Main St Chula Vista, CA | 1.0–2.0 | 1.0–2.0 | 813 | $2,950 | $3.63 | 1d | 9 | 0.84mi |
| 156 Date St Chula Vista, CA | 4.0 | 1.5 | 1324 | $3,480 | $2.63 | 1d | 1 | 0.88mi |
| 156 Date St Chula Vista, CA | 4.0 | 1.5 | 1324 | $3,480 | $2.63 | 14d | 1 | 0.88mi |
| 128 E Orlando St Chula Vista, CA | 2.0 | 1.0 | 750 | $2,300 | $3.07 | 1d | 1 | 0.90mi |
| 217 Date St Unit B Chula Vista, CA | 3.0 | 2.5 | 1228 | $3,500 | $2.85 | 2d | 1 | 0.95mi |
| 1105 Fourth Ave Chula Vista, CA | 1.0–2.0 | 1.0–2.0 | 848 | $2,775 | $3.27 | 1d | 1 | 1.03mi |
| 1250 Fifth Ave Chula Vista, CA | 2.0–3.0 | 2.0 | 1045 | $2,900 | $2.78 | 1d | 4 | 1.03mi |
| 495 Queen Anne Dr Unit 1 Chula Vista, CA | 2.0 | 1.0 | 1000 | $2,800 | $2.80 | 2d | 1 | 1.07mi |
| 1067 Fourth Ave Chula Vista, CA | 2.0 | 1.0–2.0 | 702 | $2,855 | $4.06 | 1d | 1 | 1.10mi |
| 1649 Marl Ave Unit 1 Chula Vista, CA | 2.0 | 1.0 | 750 | $2,500 | $3.33 | 1d | 1 | 1.12mi |
| 1649 Marl Ave Unit 2 Chula Vista, CA | 2.0 | 2.0 | 750 | $2,750 | $3.67 | 1d | 1 | 1.12mi |
| 1225 Broadway Chula Vista, CA | 1.0–2.0 | 1.0–2.0 | 837 | $2,701 | $3.23 | 1d | 12 | 1.15mi |
| 1035 Fourth Ave Chula Vista, CA | 2.0 | 2.0 | 910 | $2,495 | $2.74 | 17d | 2 | 1.16mi |
| 930 3rd Ave Chula Vista, CA | 2.0–3.0 | 2.0 | 1099 | $3,556 | $3.23 | 1d | 4 | 1.26mi |
| 1110 Melrose Ave Chula Vista, CA | 3.0 | 2.0 | 1461 | $4,395 | $3.01 | 2d | 1 | 1.34mi |
| 1727 Melrose Ave #35 Chula Vista, CA | 2.0 | 2.0 | 1225 | $2,750 | $2.24 | 19d | 1 | 1.36mi |
| 511 Wykes St Chula Vista, CA | 2.0 | 1.0 | 1000 | $2,650 | $2.65 | 2d | 1 | 1.37mi |
| 1051 Broadway Unit 49 Chula Vista, CA | 2.0 | 2.0 | 770 | $2,225 | $2.89 | 1d | 1 | 1.42mi |
| 1051 Broadway Unit 13 Chula Vista, CA | 2.0 | 2.0 | 875 | $2,325 | $2.66 | 1d | 1 | 1.42mi |
Listing history 24 events
-
2026-06-18days on market $240,000 Active 162 DOM
-
2026-06-17days on market $240,000 Active 161 DOM
-
2026-06-16days on market $240,000 Active 160 DOM
-
2026-06-15days on market $240,000 Active 159 DOM
-
2026-06-13days on market $240,000 Active 157 DOM
-
2026-06-13days on market $240,000 Active 156 DOM
-
2026-06-09days on market $240,000 Active 153 DOM
-
2026-06-08days on market $240,000 Active 152 DOM
-
2026-06-07days on market $240,000 Active 151 DOM
-
2026-06-04days on market $240,000 Active 148 DOM
-
2026-06-03days on market $240,000 Active 147 DOM
-
2026-06-02days on market $240,000 Active 146 DOM
-
2026-06-01days on market $240,000 Active 145 DOM
-
2026-05-31days on market $240,000 Active 144 DOM
-
2026-05-08price $240,000
-
2026-01-21status Active
-
2026-01-21status Pending Sale
-
2025-03-30historical
-
2025-01-01$260,000 Active
-
2024-10-05$260,000 Active
-
2024-09-01historical
-
2024-07-13price $260,000
-
2024-02-22price $285,000
-
2023-12-01$285,000,000 Active
ⓘ Source: listings_history table (triggers on properties + properties_extension) + one-shot
backfill from property_details.listing_events for pre-trigger history.
Tax reassessment forecast CA · Resets to sale price
- Current annual tax
- $1,038 · $86/mo
- Projected year-2 tax
- $1,824 · $152/mo
- Expected delta
- +$786/yr (+$66/mo · 75.7%)
ⓘ Screening estimate from a state-policy table — verify with the county assessor before closing.
Climate risk First Street
- Flood 1/10 Low FEMA zone X (unshaded) · 0% chance over 30 yrs
- Wildfire 1/10 Low
- Heat 4/10 Moderate 6 d/yr ≥86°F today · 16 d/yr by 30 yrs out
- Wind 1/10 Low
- Air quality 1/10 Low 0 unhealthy d/yr today · 0 by 30 yrs out
Nearby sold comps map
Loading sold comps map…
Walkable amenities ~0.75 mi
Loading nearby amenities…
Taxation est. · year 1
- Rental income
- $36,901
- − Mortgage interest
- −$13,444
- − Property taxes
- −$1,038
- − Insurance
- −$1,200
- − Repairs & maintenance
- −$2,952
- − Management
- −$2,952
- − Depreciation
- −$6,982
- Taxable income
- $8,334
- Est. tax owed @ 24.0%
- −$2,000
- After-tax cash flow
- $9,811/yr
For passive investors: Depreciation is non-cash, so a rental often shows a tax loss while cash-flowing — sheltering income. Rental losses are passive: they offset passive income freely, and up to $25,000/yr can offset ordinary (W-2) income if you actively participate and your MAGI is under $100k (phasing out to $0 by $150k); unused losses carry forward. On sale, claimed depreciation is recaptured at up to 25%, and gains may owe capital-gains tax (a 1031 exchange can defer both). Figures are a year-1 estimate at your 24.0% rate — not tax advice; consult a CPA.
Schools (NCES district)
- District
- Sweetwater Union High
- NCES district ID
- 0638640
- Math proficiency
- 36% ▲ 3.00%
- Reading proficiency
- 52% ▼ -2.00%
- Median HH income
- $59,051
- Composite
- 38.61/100
- National rank
- #4158
- State rank
- #187 of 517 in CA
Livability — Chula Vista
- Score
- 75/100
- State rank
- #127
- US rank
- #4345
Category grades
Schools grade is shown separately in the Schools card above.
Census & demographics
- Census place
- Chula Vista, CA
- County
- San Diego County · 3,178,799 people
- City population
- 255,708
- Metro
- San Diego-Chula Vista-Carlsbad, CA
- Population (ZIP)
- 85,542
- Household income
- $82,350
- Rent vs Own
- Severe rent burden
- 3751.0
Population outlook (San Diego County) Hauer SSP2
- Today (2025)
- 3,678,185 people
- By 2030
- 3,856,546 · +4.8%
- By 2040
- 4,171,407 · +13.4%
- By 2050
- 4,421,607 · +20.2%
- By 2075
- 4,831,599 · +31.4%
- By 2100
- 4,832,502 · +31.4%
Race, ethnicity, and origin ACS 2023
- Neighborhood character
- Predominantly Hispanic (75%)
- Race & ethnicity
- Hispanic / Latino 75% Two or more races 34% White 12% Asian 7% Black 4% Native American 1%
- Hispanic origin (detail)
- Mexican 71%
- Common ancestry
- Italian 1% Lithuanian 1%
- Foreign-born
- 32% · Canada, South Korea, Dominican Republic
- Languages at home
- 35% English-only · Spanish 59% Tagalog/Filipino 3% Other Asian/Pacific 1%
Political lean MEDSL · San Diego
- 2024 margin
- D (+16.8) · D 56.9% · R 40.1% · Other 2.9%
- 2008→2024 swing
- +6.6pp toward D · 2008: 10.2pp · 2024: 16.8pp
- All cycles
- 2024: D+16.8 2020: D+22.8 2016: D+17.8 2012: D+5.1 2008: D+10.2
Not yet ingested
- Civics
- —
Market trends
- HPI YoY
- ▼ -669.25%
- Current HPI
- 413.8287
- Rent YoY
- ▼ -2.56%
- Metro
- San Diego-Chula Vista-Carlsbad, CA
- State GDP YoY
- ▲ 3.21%
- F500 in state
- 116
Industry mix (Fortune 500 HQ in CA)
| Industry | F500 HQs | Revenue |
|---|---|---|
| Technology | 27 | $1,492B |
|
||
| Financial Services | 3 | $174B |
|
||
| Retail | 3 | $44B |
|
||
| Insurance | 3 | $26B |
|
||
| Media / Entertainment | 2 | $115B |
|
||
| Pharmaceuticals / Biotech | 2 | $62B |
|
||
Price history
-99.9% since first listed10 events — show timeline
- 2026-05-08 Price Changed $240,000 CRMLS
- 2026-01-21 Relisted — CRMLS
- 2026-01-21 Pending — CRMLS
- 2025-03-30 Listing Removed — CRMLS
- 2025-01-01 Listed $260,000 CRMLS
- 2024-10-05 Listed $260,000 CRMLS
- 2024-09-01 Listing Removed — CRMLS
- 2024-07-13 Price Changed $260,000 CRMLS
- 2024-02-22 Price Changed $285,000 CRMLS
- 2023-12-01 Listed $285,000,000 CRMLS
Property tax history
+2.6%/yrLatest (2013): $1,038 · +3.9% YoY. Source: county tax records.
Cash-flow waterfall
monthlySold comps — $/sqft
last 12 mo · ≤1 miLoading sold comps…