 Duplex
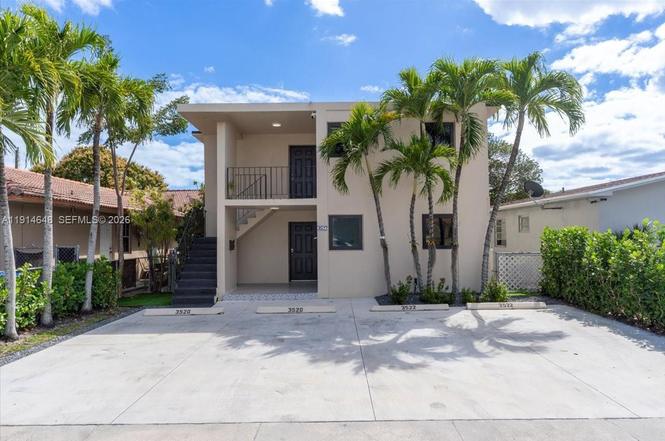
3520 SW 25th St · Miami, FL
Flood risk 1/10 · Minimal
- FEMA flood zone
- X (unshaded)
- Chance of flooding over 30 yrs
- 0.0%
- Est. flood insurance / yr
- $507 – $1,088
Fire risk 1/10 · Minimal
- Est. fire insurance / yr
- $947 – $1,759
Heat risk 10/10 · Severe
- Hot days now (above 104°F)
- 7 days/yr
- Hot days in 30 yrs
- 30 days/yr
Wind risk 10/10 · Severe
- Chance of severe wind over 30 yrs
- 99.0%
Air-quality risk 2/10 · Minimal
- Unhealthy air days now
- 1 days/yr
- Unhealthy air days in 30 yrs
- 1 days/yr
Risk factors via First Street. Map © Google.
Why this score? — see what drove the F grade
The composite is a weighted blend of 9 inputs, each scored 0–100. Each bar is that input's sub-score; the figure is the points it added to the 100-point composite (weight × sub-score).
- Cash flow +7.7/30.0
- Schools +4.2/10.0
- Livability +3.9/5.0
- Rent growth +3.2/5.0
- Condition / age +2.5/5.0
- 1% rule +1.9/10.0
- DSCR +1.8/10.0
- ARV discount +0.0/15.0
- Appreciation +0.0/10.0
$1,249,000
🖨 Deal sheet (PDF) 📄 Offer letter ✓ Due diligence
Multi-family units
County records classify this as Multi-Family (2-4 Unit). Listing-text estimate: 2 units. confirmed
Listing remarks MLS
This duplex offers an exceptional investment opportunity in a prime location nestled between Coral Gables and Coral Way Situated close to prestigious schools, hospitals, and landmarks such as the Biltmore Miami Hotel and the Shops at Merrick Park mall, its strategic position adds extra value to the property The flexibility it provides, with two independent units and separate entrances, allows for various investment strategies. Whether choosing to live in one unit and rent out the other, or capitalize on the long-term rental market or vacation rentals like Airbnbs, there are multiple avenues to generate consistent income. Charming patio features an outdoor entertaining area including a cozy caney the promise of property appreciation in a neighborhood undergoing constant development modern,
Key facts
- Renovated bathrooms
- Updated kitchens
- Comfortable backyard
Tags
Neighborhood map
What this means for you Summary
Snapshot
- This is a 2 × 2-bed/1.5-bath units multifamily listed at $1.25M.
Deal economics
- At list price, monthly cash flow is $-1k ($-17k/yr) — negative. Per door: $-722/mo.
- To cash-flow at today's rent, offer at most $994k (20.4% below list).
- To meet the 1% rule (rent ≥ 1% of price), the offer needs to be $857k (31.4% below list).
- Recommended offer: $857k (31.4% below list) — sets the bar for 1% rule.
- Cap rate 4.9% vs local median 1.9% in Miami — top-decile yield for the area; either an underpriced asset or a hidden risk that comps aren't pricing in. Stress-test before assuming the spread holds.
Location & tenants
- Location reads 78/100 on livability (#177 in FL, #2,724 nationally) — a middle-class / working-renter tenant base. Strengths: amenities A+, commute A+, health & safety A+; Watch: employment C-, crime F, cost of living F.
- Miami-Dade (suburban): math 45% / reading 54% proficiency, ranked #40 of 73 in FL (top 55%) — families likely to look elsewhere, expect single-tenant / working-renter base with shorter leases; 64% free/reduced lunch — lower-income household profile, screen leases tightly.
- Market conditions: Rents rising (+2.7%/yr); 452 active listings in the ZIP; 2 comparable units currently listed for rent nearby; solid renter incomes; 10,051 units permitted in Miami-Dade County in 2024 (7,758 in 5+ unit buildings).
- At $8,573/mo this rent would consume 99% of the median local household income ($103k/yr) (locally 2105% of renters already pay >50% of income on rent) — very limited rent-growth headroom before tenants either downsize or default.
Forward outlook
- Local home prices are declining (-3.0%/yr); year-one equity from $9k of loan paydown is wiped out by about $37k of value loss. Plan a longer hold.
- Miami-Dade County population projected at +28% by 2050 — long-run rental-demand tailwind backs the buy-and-hold thesis.
Negotiation context
- It's been on market 152 days — a 12% lower offer ($1.10M) is reasonable based on typical stale-listing flexibility.
- 6 sale attempts since 3y ago; this cycle's ask is 35586% above the opening price — seller raised mid-cycle; expect resistance to lowballs.
- Current owner paid $1.07M; 17% above their basis — modest negotiation headroom, anchor on the comps not their cost.
Risks & watch-outs
- Climate carrying-cost: severe wind risk, 99% chance of damaging wind over 30y; extreme-heat days projected 7→30/yr by 2055 (HVAC capex compounding) — expect insurance premiums to compound above CPI over the hold.
Questions for the listing agent
- What do current leases actually rent for vs. the listed asking? Can we see a recent rent roll and the last 12 months of T-12 income?
- It's been on market 152 days. Have you received any prior offers? Is the seller open to a 31% concession, seller financing, or rate buy-down credit?
- Can we see the unit-by-unit rent roll, current vacancy, and any below-market leases? What's the average tenancy length?
- What capital expenditures (roof, boiler, parking lot, exteriors) have been made in the last 5 years, and what's planned in the next 2?
- Built in 1968 — when were the roof, HVAC, electrical panel, plumbing, and water heater last replaced?
- Why hasn't it sold? Are there any deal-killer items the seller is aware of (foundation, flood, title, zoning, code violations)?
- Is there a deadline driving the sale (1031 exchange, divorce, estate, relocation)? That informs how much negotiation room exists.
- Schools are B-rated — typically a magnet for longer-tenancy family renters. What's the average tenant stay here, and is there a school-zone premium baked into asking?
- Crime grade is F in this area — have there been break-ins, vandalism, or insurance claims at this property in the last 3 years? What carrier currently insures it and at what premium?
- The area grade is low — what's the realistic commute time and amenity access for the typical tenant pool here? Any planned neighborhood developments (good or bad) we should know about?
- What's the average days-on-market for RENTAL listings here right now (not sales)? A rising rental-DOM trend means longer vacancies and softer asking-rent achievability than the comps imply.
- What's the recent tenant-quality profile in this submarket — average credit score on applications, eviction rate, late-payment / NSF rate, and stable-employment percentage? A property-management company in the area should have these aggregated.
- How much new apartment / multifamily construction is in the pipeline within 1–3 miles? Heavy new supply (>2% of stock underway) typically softens rents 12–24 months out; light construction supports rent growth.
Investment metrics
- 1% rule
- 0.69% ✗
- Cap rate
- 4.90%
- Cash-on-cash
- -4.96%
- DSCR
- 0.78
- GRM
- 12.1
CMA / ARV
- ARV (on-the-fly)
- $1,001,980
- Comps found
- 1
Show comp detail 1 sale within ~0.75 mi
| Address | Dist | Beds/Ba | Sqft | Sold | Price | $/sf | Match |
|---|---|---|---|---|---|---|---|
| 3540 SW 24th St | 0.10mi | 5/3.0 (-1) | 2,255 (-5%) | 8mo | $950,000 | $421 | 71 |
Match score weights: distance 35% · size 25% · config 20% · recency 20%. Top-matched comps best support the ARV.
Projected returns pro-forma
-3.0% appreciation · 2.72% rent growth · sell at horizon
- IRR
- -25.0%
- Equity multiple
- 0.15×
- Total profit
- $-296,943
- Equity at exit
- $186,230
- IRR
- -21.8%
- Equity multiple
- -0.11×
- Total profit
- $-387,396
- Equity at exit
- $107,991
Cash invested: $349,720 (down + closing). Projections, not guarantees.
Landlord ↔ Tenant lean methodology
- Overall (STATE)
- 87 Strongly Landlord-Friendly
- State Florida
- 87 Strongly Landlord-Friendly · R+3
- County
- — inherits STATE
- City
- — inherits STATE
ZIP-level market 33133
- Rents YoY
- 2.7%
- Active inventory
- 452
- Price-to-rent
- 24.3×
Monthly cashflow live
- Estimated rent
- $8,573 medium interval (Pro) →
- Mortgage (P&I)
- −$6,550
- Tax from tax record
- −$1,147 /mo · $13,765/yr
- Insurance
- −$520
- HOA
- −$0
- Vacancy / Maint / Mgmt
- −$1,800
- Net cashflow
- $-1,445
Break-even live
Sensitivity live
| Price | -10% $-738 | -5% $-1,091 | +0% $-1,445 | +5% $-1,798 | +10% $-2,152 |
|---|---|---|---|---|---|
| Rent | -10% $-2,122 | -5% $-1,783 | +0% $-1,445 | +5% $-1,106 | +10% $-767 |
| Rate | -1.0pp $-816 | -0.5pp $-1,127 | base $-1,445 | +0.5pp $-1,768 | +1.0pp $-2,098 |
2-unit breakdown (identical units grouped — click to expand)
| Units | Beds | Baths | Est. rent |
|---|---|---|---|
| 2× units | 2 | 1.5 | $8,574 |
| #1 | 2 | 1.5 | $4,287 |
| #2 | 2 | 1.5 | $4,287 |
| Total (2 units) | $8,573 | ||
UW: 25.0% down · 7.5% · 30yr · 1.5% tax · 5.0% vac · 8.0% maint · 8.0% mgmt
Financing live
Cash to close
- Down payment
- $312,250
- Closing costs
- $37,470
- Reserves months
- —
- Total cash needed
- —
Loan-product check · same deal, 3 products live
Conventional
25% down · 7.5% · 30yr
- Down + closing
- —
- Monthly P&I
- —
- Monthly cashflow
- —
- DSCR
- —
- Eligible?
- —
Personal DTI + credit; lowest rate.
DSCR
20% down · 8.5% · 30yr
- Down + closing
- —
- Monthly P&I
- —
- Monthly cashflow
- —
- DSCR
- —
- Eligible?
- —
No personal income docs; deal must DSCR.
Hard money
10% down · 12.0% · 12mo
- Down + closing
- —
- Monthly P&I
- —
- Monthly cashflow
- —
- DSCR
- —
- Eligible?
- —
Short-term bridge; refi at stabilization.
Rent comps 2 comps
| Address | Beds | Baths | Sqft | Rent | $/sqft | DOM | Units | Dist |
|---|---|---|---|---|---|---|---|---|
| 1710 SW 27th Ave Unit 1272101P Miami, FL | 1.0–5.0 | 1.0–4.0 | 1716 | $19,839 | $11.56 | 8d | 3 | 1.06mi |
| 2627 S Bayshore Dr Miami, FL | 3.0–5.0 | 3.5–5.5 | 3333 | $35,000 | $10.50 | 25d | 2 | 1.34mi |
Listing history 22 events
-
2026-04-16status Pending
-
2026-04-13historical $3,500
-
2026-04-11historical Active Under Contract
-
2026-03-20$3,500
-
2026-03-19historical $3,500
-
2026-03-01$3,500
-
2026-02-28price $1,249,000
-
2026-01-28historical $3,500
-
2026-01-27price $1,250,000
-
2026-01-23price $1,275,000
-
2026-01-11$3,500
-
2025-12-12price $1,295,000
-
2025-11-14$1,335,000 Active
-
2024-06-13soldstatus $1,070,000
-
2024-05-23soldstatus $1,070,000 Closed 799-char remark
Show marketing remark (799 chars)
This duplex offers an exceptional investment opportunity in a prime location nestled between Coral Gables and Coral Way Situated close to prestigious schools, hospitals, and landmarks such as the Biltmore Miami Hotel and the Shops at Merrick Park mall, its strategic position adds extra value to the property The flexibility it provides, with two independent units and separate entrances, allows for various investment strategies. Whether choosing to live in one unit and rent out the other, or capitalize on the long-term rental market or vacation rentals like Airbnbs, there are multiple avenues to generate consistent income. Charming patio features an outdoor entertaining area including a cozy caney the promise of property appreciation in a neighborhood undergoing constant development modern,
-
2024-05-07status Pending 799-char remark
Show marketing remark (799 chars)
This duplex offers an exceptional investment opportunity in a prime location nestled between Coral Gables and Coral Way Situated close to prestigious schools, hospitals, and landmarks such as the Biltmore Miami Hotel and the Shops at Merrick Park mall, its strategic position adds extra value to the property The flexibility it provides, with two independent units and separate entrances, allows for various investment strategies. Whether choosing to live in one unit and rent out the other, or capitalize on the long-term rental market or vacation rentals like Airbnbs, there are multiple avenues to generate consistent income. Charming patio features an outdoor entertaining area including a cozy caney the promise of property appreciation in a neighborhood undergoing constant development modern,
-
2024-04-13$1,200,000 Active 799-char remark
Show marketing remark (799 chars)
This duplex offers an exceptional investment opportunity in a prime location nestled between Coral Gables and Coral Way Situated close to prestigious schools, hospitals, and landmarks such as the Biltmore Miami Hotel and the Shops at Merrick Park mall, its strategic position adds extra value to the property The flexibility it provides, with two independent units and separate entrances, allows for various investment strategies. Whether choosing to live in one unit and rent out the other, or capitalize on the long-term rental market or vacation rentals like Airbnbs, there are multiple avenues to generate consistent income. Charming patio features an outdoor entertaining area including a cozy caney the promise of property appreciation in a neighborhood undergoing constant development modern,
-
2023-12-14historical $3,200
-
2023-12-01price $3,200
-
2023-11-16$3,450
-
2023-08-28soldstatus $825,000
-
1999-08-24soldstatus $160,000
ⓘ Source: listings_history table (triggers on properties + properties_extension) + one-shot
backfill from property_details.listing_events for pre-trigger history.
Tax reassessment forecast FL · Resets to sale price
- Current annual tax
- $13,765 · $1,147/mo
- Projected year-2 tax
- $13,765 · $1,147/mo
- Expected delta
- $0/yr ($0/mo · 0.0%)
ⓘ Screening estimate from a state-policy table — verify with the county assessor before closing.
Climate risk First Street
- Flood 1/10 Low FEMA zone X (unshaded) · 0% chance over 30 yrs
- Wildfire 1/10 Low
- Heat 10/10 Extreme 7 d/yr ≥104°F today · 30 d/yr by 30 yrs out
- Wind 10/10 Extreme 99% chance of damaging wind over 30 yrs
- Air quality 2/10 Low 1 unhealthy d/yr today · 1 by 30 yrs out
Nearby sold comps map
Loading sold comps map…
Walkable amenities ~0.75 mi
Loading nearby amenities…
Taxation est. · year 1
- Rental income
- $102,876
- − Mortgage interest
- −$69,963
- − Property taxes
- −$13,765
- − Insurance
- −$6,245
- − Repairs & maintenance
- −$8,230
- − Management
- −$8,230
- − Depreciation
- −$36,335
- Taxable loss
- −$39,893
- Est. tax savings @ 24.0%
- +$9,574
- After-tax cash flow
- $-7,763/yr
For passive investors: Depreciation is non-cash, so a rental often shows a tax loss while cash-flowing — sheltering income. Rental losses are passive: they offset passive income freely, and up to $25,000/yr can offset ordinary (W-2) income if you actively participate and your MAGI is under $100k (phasing out to $0 by $150k); unused losses carry forward. On sale, claimed depreciation is recaptured at up to 25%, and gains may owe capital-gains tax (a 1031 exchange can defer both). Figures are a year-1 estimate at your 24.0% rate — not tax advice; consult a CPA.
Schools (NCES district)
- District
- Miami-Dade
- NCES district ID
- 1200390
- Math proficiency
- 45% ▼ -16.00%
- Reading proficiency
- 54% ▼ -5.00%
- Median HH income
- $43,928
- Composite
- 41.76/100
- National rank
- #3397
- State rank
- #40 of 73 in FL
Livability — Miami
- Score
- 78/100
- State rank
- #177
- US rank
- #2724
Category grades
Schools grade is shown separately in the Schools card above.
Census & demographics
- Census place
- Miami, FL
- County
- Miami-Dade County · 2,697,751 people
- City population
- 827,308
- Metro
- Miami-Fort Lauderdale-Pompano Beach, FL
- Population (ZIP)
- 36,789
- Household income
- $103,420
- Rent vs Own
- Severe rent burden
- 2105.0
Population outlook (Miami-Dade County) Hauer SSP2
- Today (2025)
- 3,126,439 people
- By 2030
- 3,325,765 · +6.4%
- By 2040
- 3,697,561 · +18.3%
- By 2050
- 4,012,134 · +28.3%
- By 2075
- 4,605,612 · +47.3%
- By 2100
- 4,866,598 · +55.7%
Race, ethnicity, and origin ACS 2023
- Neighborhood character
- Diverse neighborhood (Simpson 0.58)
- Race & ethnicity
- Hispanic / Latino 57% Two or more races 38% White 28% Black 9% Asian 2%
- Hispanic origin (detail)
- Mexican 2% Puerto Rican 2% Cuban 22% Salvadoran 2%
- Common ancestry
- Lithuanian 3% Romanian 2% Scotch-Irish 2%
- Foreign-born
- 42% · Canada, Jamaica, Dominican Republic
- Languages at home
- 37% English-only · Spanish 53% Other Indo-European 4% French/Haitian/Cajun 3%
Political lean MEDSL · Miami-Dade
- 2024 margin
- R (+11.4) · D 43.9% · R 55.4%
- 2008→2024 swing
- -27.6pp toward R · 2008: 16.1pp · 2024: -11.4pp
- All cycles
- 2024: R+11.4 2020: D+7.3 2016: D+29.6 2012: D+23.7 2008: D+16.1
Not yet ingested
- Civics
- —
Market trends
- HPI YoY
- ▼ -997.74%
- Current HPI
- 460.9475
- Rent YoY
- ▲ 2.72%
- Metro
- Miami-Fort Lauderdale-Pompano Beach, FL
- State GDP YoY
- ▲ 3.28%
- F500 in state
- 36
Industry mix (Fortune 500 HQ in FL)
| Industry | F500 HQs | Revenue |
|---|---|---|
| Industrial Technology | 2 | $29B |
|
||
| Insurance | 2 | $17B |
|
||
| Retail | 1 | $60B |
|
||
| Technology Distribution | 1 | $58B |
|
||
| Homebuilding | 1 | $35B |
|
||
| Technology Manufacturing | 1 | $35B |
|
||
Price history
-97.8% since first listed22 events — show timeline
- 2026-04-16 Pending — MARMLS
- 2026-04-13 Rental Removed $3,500 REALLYO
- 2026-04-11 Contingent — MARMLS
- 2026-03-20 Listed for Rent $3,500 REALLYO
- 2026-03-19 Rental Removed $3,500 REALLYO
- 2026-03-01 Listed for Rent $3,500 REALLYO
- 2026-02-28 Price Changed $1,249,000 MARMLS
- 2026-01-28 Rental Removed $3,500 REALLYO
- 2026-01-27 Price Changed $1,250,000 MARMLS
- 2026-01-23 Price Changed $1,275,000 MARMLS
- 2026-01-11 Listed for Rent $3,500 REALLYO
- 2025-12-12 Price Changed $1,295,000 MARMLS
- 2025-11-14 Listed $1,335,000 MARMLS
- 2024-06-13 Sold (Public Records) $1,070,000 Public Records
- 2024-05-23 Sold (MLS) $1,070,000 MARMLS
- 2024-05-07 Pending — MARMLS
- 2024-04-13 Listed $1,200,000 MARMLS
- 2023-12-14 Rental Removed $3,200 APPFOLIO
- 2023-12-01 Price Changed $3,200 APPFOLIO
- 2023-11-16 Listed for Rent $3,450 APPFOLIO
- 2023-08-28 Sold (Public Records) $825,000 Public Records
- 1999-08-24 Sold (Public Records) $160,000 Public Records
Property tax history
+9.0%/yrLatest (2025): $13,765 · +0.1% YoY. Source: county tax records.
Cash-flow waterfall
monthlySold comps — $/sqft
last 12 mo · ≤1 miLoading sold comps…