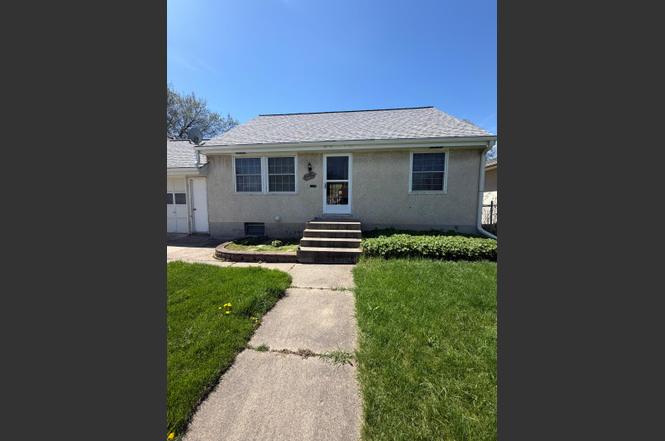
3730 Lincoln St NE · Columbia Heights, MN
Flood risk 1/10 · Minimal
- FEMA flood zone
- X (unshaded)
- Chance of flooding over 30 yrs
- 0.0%
- Est. flood insurance / yr
- $507 – $1,088
Fire risk 1/10 · Minimal
- Est. fire insurance / yr
- $888 – $1,650
Heat risk 2/10 · Minimal
- Hot days now (above 100°F)
- 7 days/yr
- Hot days in 30 yrs
- 14 days/yr
Wind risk 2/10 · Minimal
- Chance of severe wind over 30 yrs
- —
Air-quality risk 2/10 · Minimal
- Unhealthy air days now
- 1 days/yr
- Unhealthy air days in 30 yrs
- 1 days/yr
Risk factors via First Street. Map © Google.
Why this score? — see what drove the F grade
The composite is a weighted blend of 9 inputs, each scored 0–100. Each bar is that input's sub-score; the figure is the points it added to the 100-point composite (weight × sub-score).
- ARV discount +7.5/15.0
- Cash flow +5.8/30.0
- Livability +3.7/5.0
- Rent growth +3.6/5.0
- Condition / age +2.5/5.0
- 1% rule +1.5/10.0
- Schools +1.5/10.0
- DSCR +0.2/10.0
- Appreciation +0.0/10.0
$250,000
🖨 Deal sheet 📄 Offer letter ✓ Due diligence
Listing remarks MLS
Wonderful backyard w/ large deck. All levels finished including mother-in-law down. Needs TLC.
Key facts
- 6,720 sq ft lot
- Garage
- Built 1964
Neighborhood map
What this means for you Summary
Snapshot
- This is a 2-bed/2.0-bath single-family listed at $250k.
Deal economics
- At list price, monthly cash flow is $-497 ($-6k/yr) — negative.
- To cash-flow at today's rent, offer at most $162k (35.1% below list).
- To meet the 1% rule (rent ≥ 1% of price), the offer needs to be $164k (34.6% below list).
- Recommended offer: $162k (35.1% below list) — sets the bar for cash-flow.
Location & tenants
- Location reads 74/100 on livability (#215 in MN, #4,509 nationally) — a middle-class / working-renter tenant base. Strengths: commute A+, housing A+, cost of living A-; Watch: crime C-, schools D+, amenities D-.
- Columbia Heights Public School District (suburban): math 11% / reading 22% proficiency, ranked #291 of 301 in MN (top 97%) — low school quality limits family demand, transient renter base, plan for 1-2y turnover; 68% free/reduced lunch — lower-income household profile, screen leases tightly.
- Market conditions: Rents rising fast (+4.5%/yr); 147 active listings in the ZIP; 40 comparable units currently listed for rent nearby; rentals at typical pace (median 22d on market — plan ~3-4 weeks tenant-placement turnaround); 1,083 units permitted in Anoka County in 2024 (134 in 5+ unit buildings).
Forward outlook
- Local home prices are declining (-3.0%/yr); year-one equity from $2k of loan paydown is wiped out by about $8k of value loss. Plan a longer hold.
- Anoka County population projected at +11% by 2050 — modest demand growth; plan on rents tracking national, not racing it.
Negotiation context
- Only 0 days on market — expect competitive offers; lowballing is unlikely to land.
- 4 sale attempts since 26y ago with the ask held roughly flat each time — persistent listings suggest the price (not the market) is what's stuck; bring a comps-based counter.
- Current owner paid $210k; 19% above their basis — modest negotiation headroom, anchor on the comps not their cost.
Questions for the listing agent
- What do current leases actually rent for vs. the listed asking? Can we see a recent rent roll and the last 12 months of T-12 income?
- Built in 1964 — when were the roof, HVAC, electrical panel, plumbing, and water heater last replaced?
- Is there a deadline driving the sale (1031 exchange, divorce, estate, relocation)? That informs how much negotiation room exists.
- Schools are D-rated, which usually means shorter tenancies and higher turnover. Who's the typical renter profile here, and what's been the actual vacancy rate?
- The area grade is low — what's the realistic commute time and amenity access for the typical tenant pool here? Any planned neighborhood developments (good or bad) we should know about?
- What's the average days-on-market for RENTAL listings here right now (not sales)? A rising rental-DOM trend means longer vacancies and softer asking-rent achievability than the comps imply.
- What's the recent tenant-quality profile in this submarket — average credit score on applications, eviction rate, late-payment / NSF rate, and stable-employment percentage? A property-management company in the area should have these aggregated.
- How much new for-sale + rental construction is in the pipeline within 1–3 miles? Heavy new supply typically softens prices + rents 12–24 months out; constrained supply supports both.
Investment metrics
- 1% rule
- 0.65% ✗
- Cap rate
- 3.91%
- Cash-on-cash
- -8.52%
- DSCR
- 0.62
- GRM
- 12.7
CMA / ARV
No comps found within radius.
Projected returns pro-forma
-3.0% appreciation · 4.51% rent growth · sell at horizon
- IRR
- -29.6%
- Equity multiple
- 0.01×
- Total profit
- $-69,564
- Equity at exit
- $37,276
- IRR
- -24.6%
- Equity multiple
- -0.29×
- Total profit
- $-90,390
- Equity at exit
- $21,615
Cash invested: $70,000 (down + closing). Projections, not guarantees.
Landlord ↔ Tenant lean methodology
- Overall (STATE)
- 46 Balanced
- State Minnesota
- 46 Balanced · D+2
- County
- — inherits STATE
- City
- — inherits STATE
ZIP-level market 55421
- Rents YoY
- 4.5%
- Active inventory
- 147
- Price-to-rent
- 12.7×
Monthly cashflow live
- Estimated rent
- $1,635 high interval (Pro) →
- Mortgage (P&I)
- −$1,311
- Tax from tax record
- −$373 /mo · $4,479/yr
- Insurance
- −$104
- HOA
- −$0
- Vacancy / Maint / Mgmt
- −$343
- Net cashflow
- $-497
Break-even live
UW: 25.0% down · 7.5% · 30yr · 1.5% tax · 5.0% vac · 8.0% maint · 8.0% mgmt
Financing live
Cash to close
- Down payment
- $62,500
- Closing costs
- $7,500
- Reserves months
- —
- Total cash needed
- —
Loan-product check · same deal, 3 products live
Conventional
25% down · 7.5% · 30yr
- Down + closing
- —
- Monthly P&I
- —
- Monthly cashflow
- —
- DSCR
- —
- Eligible?
- —
Personal DTI + credit; lowest rate.
DSCR
20% down · 8.5% · 30yr
- Down + closing
- —
- Monthly P&I
- —
- Monthly cashflow
- —
- DSCR
- —
- Eligible?
- —
No personal income docs; deal must DSCR.
Hard money
10% down · 12.0% · 12mo
- Down + closing
- —
- Monthly P&I
- —
- Monthly cashflow
- —
- DSCR
- —
- Eligible?
- —
Short-term bridge; refi at stabilization.
Rent comps 40 comps
| Address | Beds | Baths | Sqft | Rent | $/sqft | DOM | Units | Dist |
|---|---|---|---|---|---|---|---|---|
| 1000 Peters Pl Columbia Heights, MN | 1.0 | 1.0 | 700 | $1,050 | $1.50 | 24d | 1 | 0.33mi |
| 1300 Circle Terrace Blvd NE Minneapolis, MN | 3.0 | 2.0 | 1200 | $1,995 | $1.66 | 21d | 1 | 0.40mi |
| 1300 Circle Terrace Blvd NE Unit 1300 Minneapolis, MN | 3.0 | 2.0 | 1200 | $1,995 | $1.66 | 10d | 1 | 0.41mi |
| 909 Gould Ave NE Minneapolis, MN | 3.0 | 1.0–2.0 | 928 | $2,095 | $2.26 | 1d | 24 | 0.43mi |
| 1011 41st Ave NE #220 Minneapolis, MN | 3.0 | 2.0 | 1500 | $2,400 | $1.60 | 4d | 1 | 0.52mi |
| 3820 Jackson St NE Minneapolis, MN | 3.0 | 1.0 | 984 | $1,824 | $1.85 | 24d | 1 | 0.55mi |
| 3725 NE Stinson Blvd St Anthony, MN | 1.0–2.0 | 1.0 | 701 | $1,925 | $2.75 | 21d | 3 | 0.62mi |
| 3318 Pierce St NE Minneapolis, MN | 3.0 | 2.0 | 1032 | $1,450 | $1.41 | 1d | 1 | 0.62mi |
| 4216 Van Buren St NE Minneapolis, MN | 3.0 | 1.0 | 876 | $1,790 | $2.04 | 43d | 1 | 0.75mi |
| 2551 38th Ave NE Minneapolis, MN | 2.0 | 1.0–2.0 | 894 | $2,639 | $2.95 | 1d | 22 | 0.77mi |
| 1103 44th Ave NE Minneapolis, MN | 3.0 | 1.0 | 1450 | $2,024 | $1.40 | 43d | 1 | 0.82mi |
| 3127 Central Ave NE Unit 2 Minneapolis, MN | 2.0 | 1.0 | 900 | $1,400 | $1.56 | 43d | 1 | 0.92mi |
| 2808 Silver Ln NE Saint Anthony, MN | 1.0–2.0 | 1.0 | 850 | $1,770 | $2.08 | 43d | 20 | 0.96mi |
| 2808 Silver Ln NE Saint Anthony, MN | 1.0–2.0 | 1.0 | 850 | $2,050 | $2.41 | 2d | 13 | 0.96mi |
| 2215 45th Ave NE Minneapolis, MN | 3.0 | 2.0 | 1200 | $2,300 | $1.92 | 24d | 1 | 1.04mi |
| 3923 Lookout Pl Unit 9 Minneapolis, MN | 2.0 | 1.0 | 800 | $1,169 | $1.46 | 43d | 1 | 1.10mi |
| 3923 Lookout Pl Unit 9 Minneapolis, MN | 2.0 | 1.0 | 800 | $1,250 | $1.56 | 24d | 1 | 1.10mi |
| 1400 47th Ave NE Minneapolis, MN | 1.0 | 1.0 | 900 | $1,125 | $1.25 | 43d | 1 | 1.13mi |
| 3817 Macalaster Dr NE Minneapolis, MN | 1.0–2.0 | 1.0 | 749 | $1,389 | $1.85 | 4d | 5 | 1.16mi |
| 3200 Diamond Eight Ter Minneapolis, MN | 1.0–2.0 | 1.0 | 787 | $1,425 | $1.81 | 2d | 23 | 1.16mi |
| 4654 Tyler St NE Minneapolis, MN | 2.0 | 1.0 | 1100 | $1,275 | $1.16 | 24d | 1 | 1.19mi |
| 2310 Silver Ln New Brighton, MN | 3.0 | 1.0 | 707 | $2,630 | $3.72 | 1d | 17 | 1.19mi |
| 950 47th Ave NE Minneapolis, MN | 1.0 | 1.0 | 800 | $975 | $1.22 | 43d | 1 | 1.19mi |
| 962 29th Ave NE Minneapolis, MN | 1.0 | 1.0 | 750 | $1,150 | $1.53 | 43d | 1 | 1.21mi |
| 4550 Central Ave NE Minneapolis, MN | 2.0–3.0 | 1.0–2.0 | 1166 | $1,148 | $0.98 | 1d | 1 | 1.24mi |
| 2827 Polk St NE Unit 2 Minneapolis, MN | 3.0 | 1.0 | 920 | $1,895 | $2.06 | 3d | 1 | 1.24mi |
| 3857 Edgemoor Pl NE Unit 3 Minneapolis, MN | 2.0 | 1.0 | 800 | $1,300 | $1.62 | 24d | 1 | 1.25mi |
| 301 Kathy Ln NE Minneapolis, MN | 3.0 | 1.5 | 1396 | $2,095 | $1.50 | 19d | 1 | 1.29mi |
| 4239 University Ave NE Unit 4239 Columbia Heights, MN | 3.0 | 2.0 | 1100 | $2,095 | $1.90 | 17d | 1 | 1.30mi |
| 4730 Central Ave NE Unit 6 Columbia Heights, MN | 2.0 | 1.0 | 800 | $1,350 | $1.69 | 4d | 1 | 1.30mi |
| 1028 28th Ave NE Unit 2 Minneapolis, MN | 2.0 | 1.0 | 925 | $1,495 | $1.62 | 43d | 1 | 1.31mi |
| 4201 3rd St NE Apt 6 Minneapolis, MN | 2.0 | 1.0 | 750 | $995 | $1.33 | 17d | 1 | 1.33mi |
| 3713 Foss Rd Minneapolis, MN | 1.0 | 1.0 | 750 | $980 | $1.31 | 4d | 1 | 1.41mi |
| 4314 3rd St NE Columbia Heights, MN | 2.0 | 1.0 | 800 | $1,600 | $2.00 | 24d | 1 | 1.42mi |
| 2640 Fillmore St NE Unit 4 Minneapolis, MN | 2.0 | 1.0 | 900 | $1,475 | $1.64 | 43d | 1 | 1.43mi |
| 2639 NE Taylor St Unit 2 Minneapolis, MN | 2.0 | 1.0 | 875 | $1,575 | $1.80 | 17d | 1 | 1.45mi |
| 2130 County Rd E New Brighton, MN | 2.0 | 1.0 | 950 | $1,425 | $1.50 | 17d | 1 | 1.49mi |
| 2130 County Rd E Apt 101 New Brighton, MN | 2.0 | 1.0 | 950 | $1,429 | $1.50 | 20d | 1 | 1.49mi |
| 2130 County Rd E Apt 106 New Brighton, MN | 2.0 | 1.0 | 950 | $1,399 | $1.47 | 21d | 1 | 1.49mi |
| 2130 County Rd E Apt 105 New Brighton, MN | 2.0 | 1.0 | 950 | $1,399 | $1.47 | 17d | 1 | 1.49mi |
Listing history 2 events
-
2026-06-15remarks 18-char remark
-
2026-06-15$250,000 Pending
ⓘ Source: listings_history table (triggers on properties + properties_extension) + one-shot
backfill from property_details.listing_events for pre-trigger history.
Tax reassessment forecast MN · Partial reset (capped growth)
- Current annual tax
- $4,479 · $373/mo
- Projected year-2 tax
- $4,479 · $373/mo
- Expected delta
- $0/yr ($0/mo · 0.0%)
ⓘ Screening estimate from a state-policy table — verify with the county assessor before closing.
Climate risk First Street
- Flood 1/10 Low FEMA zone X (unshaded) · 0% chance over 30 yrs
- Wildfire 1/10 Low
- Heat 2/10 Low 7 d/yr ≥100°F today · 14 d/yr by 30 yrs out
- Wind 2/10 Low
- Air quality 2/10 Low 1 unhealthy d/yr today · 1 by 30 yrs out
Nearby sold comps map
Loading sold comps map…
Walkable amenities ~0.75 mi
Loading nearby amenities…
Taxation est. · year 1
- Rental income
- $19,621
- − Mortgage interest
- −$14,004
- − Property taxes
- −$4,479
- − Insurance
- −$1,250
- − Repairs & maintenance
- −$1,570
- − Management
- −$1,570
- − Depreciation
- −$7,273
- Taxable loss
- −$10,524
- Est. tax savings @ 24.0%
- +$2,526
- After-tax cash flow
- $-3,435/yr
For passive investors: Depreciation is non-cash, so a rental often shows a tax loss while cash-flowing — sheltering income. Rental losses are passive: they offset passive income freely, and up to $25,000/yr can offset ordinary (W-2) income if you actively participate and your MAGI is under $100k (phasing out to $0 by $150k); unused losses carry forward. On sale, claimed depreciation is recaptured at up to 25%, and gains may owe capital-gains tax (a 1031 exchange can defer both). Figures are a year-1 estimate at your 24.0% rate — not tax advice; consult a CPA.
Schools (NCES district)
- District
- Columbia Heights Public School District
- NCES district ID
- 2709510
- Math proficiency
- 11% ▼ -15.00%
- Reading proficiency
- 22% ▼ -13.00%
- Median HH income
- $49,602
- Composite
- 14.93/100
- National rank
- #9369
- State rank
- #291 of 301 in MN
Livability — Columbia Heights
- Score
- 74/100
- State rank
- #215
- US rank
- #4509
Category grades
Schools grade is shown separately in the Schools card above.
Census & demographics
- Census place
- Columbia Heights, MN
- County
- Anoka County · 277,116 people
- City population
- 30,843
- Metro
- Minneapolis-St. Paul-Bloomington, MN-WI
- Population (ZIP)
- 30,843
- Household income
- $70,772
- Rent vs Own
- Severe rent burden
- 1747.0
Population outlook (Anoka County) Hauer SSP2
- Today (2025)
- 375,223 people
- By 2030
- 387,850 · +3.4%
- By 2040
- 407,239 · +8.5%
- By 2050
- 417,541 · +11.3%
- By 2075
- 448,447 · +19.5%
- By 2100
- 464,954 · +23.9%
Race, ethnicity, and origin ACS 2023
- Neighborhood character
- Diverse neighborhood (Simpson 0.66)
- Race & ethnicity
- White 52% Black 24% Hispanic / Latino 14% Two or more races 7% Asian 5%
- Hispanic origin (detail)
- Mexican 4%
- Common ancestry
- Portuguese 7% Romanian 5% Lithuanian 2%
- Foreign-born
- 22% · Canada, Vietnam, China
- Languages at home
- 72% English-only · Spanish 11% Arabic 1% Vietnamese 1%
Political lean MEDSL · Anoka
- 2024 margin
- Toss-up / Even · D 46.6% · R 51.0% · Other 2.4%
- 2008→2024 swing
- -2.0pp toward R · 2008: -2.4pp · 2024: -4.4pp
- All cycles
- 2024: R+4.4 2020: R+1.9 2016: R+9.7 2012: R+2.6 2008: R+2.4
Not yet ingested
- Civics
- —
Market trends
- HPI YoY
- ▼ -140.08%
- Current HPI
- 258.4424
- Rent YoY
- ▲ 4.51%
- Metro
- Minneapolis-St. Paul-Bloomington, MN-WI
- State GDP YoY
- ▲ 2.41%
- F500 in state
- 34
Industry mix (Fortune 500 HQ in MN)
| Industry | F500 HQs | Revenue |
|---|---|---|
| Healthcare | 2 | $407B |
|
||
| Retail | 2 | $150B |
|
||
| Consumer Goods | 2 | $32B |
|
||
| Industrial Machinery | 2 | $6B |
|
||
| Agriculture | 1 | $40B |
|
||
| Healthcare / Medical Devices | 1 | $32B |
|
||
Price history
+92.5% since first listed12 events — show timeline
- 2026-06-15 Listed $250,000 NORTHSTARMLS as Distributed by MLS Grid
- 2026-06-15 Listing Removed — NORTHSTARMLS as Distributed by MLS Grid
- 2026-06-15 Sold (MLS) $210,000 NORTHSTARMLS as Distributed by MLS Grid
- 2009-02-02 Sold (MLS) $90,000 NORTHSTARMLS as Distributed by MLS Grid
- 2009-01-15 Listing Removed — NORTHSTARMLS as Distributed by MLS Grid
- 2008-08-25 Listed $93,500 NORTHSTARMLS as Distributed by MLS Grid
- 2004-11-30 Listing Removed — NORTHSTARMLS as Distributed by MLS Grid
- 2004-10-14 Listed $199,900 NORTHSTARMLS as Distributed by MLS Grid
- 2000-10-18 Sold (Public Records) $135,000 Public Records
- 2000-10-06 Sold (MLS) $135,000 NORTHSTARMLS as Distributed by MLS Grid
- 2000-09-05 Listing Removed — NORTHSTARMLS as Distributed by MLS Grid
- 2000-09-01 Listed $129,900 NORTHSTARMLS as Distributed by MLS Grid
Property tax history
+6.6%/yrLatest (2026): $4,479 · +9.6% YoY. Source: county tax records.
Cash-flow waterfall
monthlySold comps — $/sqft
last 12 mo · ≤1 miLoading sold comps…