711 Cinmac St · Lindsay, OK
Flood risk 1/10 · Minimal
- FEMA flood zone
- X (unshaded)
- Chance of flooding over 30 yrs
- 0.0%
- Est. flood insurance / yr
- $507 – $1,088
Fire risk 5/10 · Moderate
- Est. fire insurance / yr
- $2,463 – $4,575
Heat risk 6/10 · Moderate
- Hot days now (above 109°F)
- 7 days/yr
- Hot days in 30 yrs
- 19 days/yr
Wind risk 3/10 · Minor
- Chance of severe wind over 30 yrs
- 6.0%
Air-quality risk 2/10 · Minimal
- Unhealthy air days now
- 1 days/yr
- Unhealthy air days in 30 yrs
- 1 days/yr
Risk factors via First Street. Map © Google.
Why this score? — see what drove the C grade
The composite is a weighted blend of 9 inputs, each scored 0–100. Each bar is that input's sub-score; the figure is the points it added to the 100-point composite (weight × sub-score).
- Cash flow +18.5/30.0
- ARV discount +10.0/15.0
- Appreciation +8.6/10.0
- DSCR +5.8/10.0
- 1% rule +4.1/10.0
- Livability +3.0/5.0
- Rent growth +2.5/5.0
- Condition / age +2.5/5.0
- Schools +2.0/10.0
$120,000
🖨 Deal sheet 📄 Offer letter ✓ Due diligence
Listing remarks
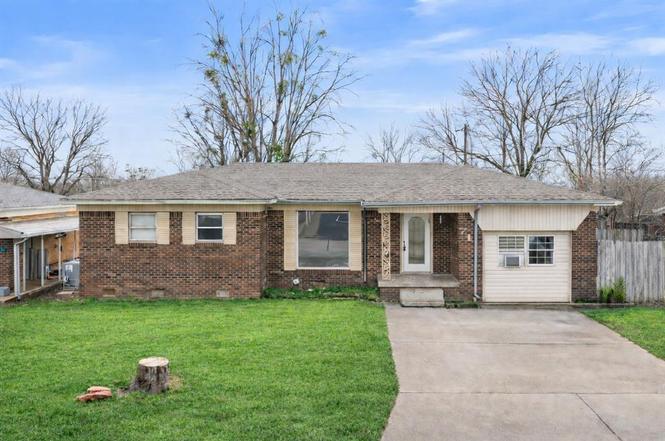
This 3-bedroom, 1.5-bath brick home offers a solid layout with plenty of potential. Featuring a versatile flex room just off the living room, it’s perfect for a home office, playroom, or extra living space. The durable brick exterior adds timeless appeal, and the floor plan is ideal for comfortable family living. Located in Lindsay, OK, this home is a great opportunity for buyers looking to add their personal touch. With a little TLC, it could truly shine. Perfect for families, first-time buyers, or investors looking for value.
Key facts
- Brick exterior
- Flex room
- 7,802 sq ft lot
Tags
Property features AI
Finance
- Other: Living area reported as 1,428 (assessor); Located in Frances 1st Add; Directions: Maps pulls up to the home directly behind house.
- Financial info: Loan qualifying allowed; Property not assumable
- HOA & community: No mandatory association dues
Exterior
- Home design: Single-family residence; One-story
- Construction: Brick and frame construction; Composition roof; Slab foundation; Built (existing)
- Exterior features: Covered patio; Chain link fence; Below-ground storm shelter; Lot described as 'Other'
Interior
- Bedrooms: 3 bedrooms
- Bathrooms: 1 full bathroom; 1 half bathroom
- Interior features: One living area; No fireplace
Neighborhood map
What this means for you Summary
Snapshot
- This is a 3-bed/2.0-bath single-family listed at $120k.
Deal economics
- At list price, monthly cash flow is $115 ($1k/yr) — positive.
- The deal already cash-flows at list — no discount required.
- To meet the 1% rule (rent ≥ 1% of price), the offer needs to be $109k (9.1% below list).
- Recommended offer: $109k (9.1% below list) — sets the bar for 1% rule.
Location & tenants
- Location reads 59/100 on livability (#380 in OK) — a working-class tenant base; expect higher turnover. Strengths: cost of living A+, housing A+; Watch: crime C-, employment C-, amenities F.
- Lindsay (town): math 21% / reading 24% proficiency, ranked #141 of 270 in OK (top 52%) — low school quality limits family demand, transient renter base, plan for 1-2y turnover.
- Zoned schools: Lindsay Es (math 25% / reading 24%, grade F, #354 of 845 statewide, top 47%, 606 students, 0% FRL); Lindsay Hs (math 12% / reading 22%, grade F, #314 of 447 statewide, top 72%, 324 students, 0% FRL) — zoned schools average 0% FRL vs 46% district-wide (46 pts lower); this property's tenant base skews higher-income than the district average.
- Market conditions: 45 active listings in the ZIP; 1 units permitted in Garvin County in 2024 (0 in 5+ unit buildings).
Forward outlook
- In year one you build about $9k of equity ($830 loan paydown + $9k appreciation (7.2% local appreciation)).
- Garvin County population projected at +8% by 2050 — modest demand growth; plan on rents tracking national, not racing it.
- At projected returns (7.2% appreciation + 3.0% rent growth), your $34k cash investment doubles in ~3 years — after that, you're playing with house money.
- By year 4, paydown + projected appreciation supports a ~$32k cash-out refi (75% LTV) — recoverable capital for the next deal without selling this one.
Negotiation context
- It's been on market 73 days — a 6% lower offer ($113k) is reasonable based on typical stale-listing flexibility.
- Current owner paid $57k; list at $120k implies a 111% gain — meaningful room to come down on a strong offer.
Risks & watch-outs
- Climate carrying-cost: moderate wildfire risk; extreme-heat days projected 7→19/yr by 2055 (HVAC capex compounding) — expect insurance premiums to compound above CPI over the hold.
Questions for the listing agent
- It's been on market 73 days. Have you received any prior offers? Is the seller open to a 9% concession, seller financing, or rate buy-down credit?
- Why hasn't it sold? Are there any deal-killer items the seller is aware of (foundation, flood, title, zoning, code violations)?
- Is there a deadline driving the sale (1031 exchange, divorce, estate, relocation)? That informs how much negotiation room exists.
- Schools are F-rated, which usually means shorter tenancies and higher turnover. Who's the typical renter profile here, and what's been the actual vacancy rate?
- What's the average days-on-market for RENTAL listings here right now (not sales)? A rising rental-DOM trend means longer vacancies and softer asking-rent achievability than the comps imply.
- What's the recent tenant-quality profile in this submarket — average credit score on applications, eviction rate, late-payment / NSF rate, and stable-employment percentage? A property-management company in the area should have these aggregated.
- How much new for-sale + rental construction is in the pipeline within 1–3 miles? Heavy new supply typically softens prices + rents 12–24 months out; constrained supply supports both.
Investment metrics
- 1% rule
- 0.91% ✗
- Cap rate
- 7.44%
- Cash-on-cash
- 4.10%
- DSCR
- 1.18
- GRM
- 9.2
CMA / ARV
- ARV (on-the-fly)
- $127,092
- Comps found
- 5
Show comp detail 5 sales within ~0.75 mi
| Address | Dist | Beds/Ba | Sqft | Sold | Price | $/sf | Match |
|---|---|---|---|---|---|---|---|
| 711 Cinmac St | 0.00mi | 3/1.5 | 1,428 (0%) | 0mo | $120,000 | $84 | 98 |
| 804 NW 7th St | 0.11mi | 3/2.0 | 1,424 (-0%) | 14mo | $183,000 | $129 | 83 |
| 317 Oakwood Dr | 0.50mi | 3/2.0 | 1,404 (-2%) | 17mo | $170,000 | $121 | 60 |
| 201 George Brown Ave | 0.40mi | 3/2.0 | 1,312 (-8%) | 22mo | $105,000 | $80 | 50 |
| 102 SW 8th St | 0.73mi | 3/2.0 | 1,344 (-6%) | 21mo | $120,000 | $89 | 39 |
Match score weights: distance 35% · size 25% · config 20% · recency 20%. Top-matched comps best support the ARV.
Projected returns pro-forma
7.17% appreciation · 3.0% rent growth · sell at horizon
- IRR
- 21.3%
- Equity multiple
- 2.50×
- Total profit
- $50,438
- Equity at exit
- $84,492
- IRR
- 19.9%
- Equity multiple
- 5.19×
- Total profit
- $140,951
- Equity at exit
- $161,720
Cash invested: $33,600 (down + closing). Projections, not guarantees.
Landlord ↔ Tenant lean methodology
- Overall (STATE)
- 83 Strongly Landlord-Friendly
- State Oklahoma
- 83 Strongly Landlord-Friendly · R+20
- County
- — inherits STATE
- City
- — inherits STATE
ZIP-level market 73052
- Home prices YoY
- 3.2%
- Active inventory
- 45
- Price-to-rent
- 9.2×
Monthly cashflow live
- Estimated rent
- $1,091 medium interval (Pro) →
- Mortgage (P&I)
- −$629
- Tax from tax record
- −$68 /mo · $816/yr
- Insurance
- −$50
- HOA
- −$0
- Vacancy / Maint / Mgmt
- −$229
- Net cashflow
- $115
Break-even live
UW: 25.0% down · 7.5% · 30yr · 1.5% tax · 5.0% vac · 8.0% maint · 8.0% mgmt
Financing live
Cash to close
- Down payment
- $30,000
- Closing costs
- $3,600
- Reserves months
- —
- Total cash needed
- —
Loan-product check · same deal, 3 products live
Conventional
25% down · 7.5% · 30yr
- Down + closing
- —
- Monthly P&I
- —
- Monthly cashflow
- —
- DSCR
- —
- Eligible?
- —
Personal DTI + credit; lowest rate.
DSCR
20% down · 8.5% · 30yr
- Down + closing
- —
- Monthly P&I
- —
- Monthly cashflow
- —
- DSCR
- —
- Eligible?
- —
No personal income docs; deal must DSCR.
Hard money
10% down · 12.0% · 12mo
- Down + closing
- —
- Monthly P&I
- —
- Monthly cashflow
- —
- DSCR
- —
- Eligible?
- —
Short-term bridge; refi at stabilization.
Listing history 4 events
-
2026-04-18status Pending
-
2026-03-16price $120,000
-
2026-02-04$125,000 Active
-
2004-06-24soldstatus $57,000
ⓘ Source: listings_history table (triggers on properties + properties_extension) + one-shot
backfill from property_details.listing_events for pre-trigger history.
Tax reassessment forecast OK · Resets to sale price
- Current annual tax
- $816 · $68/mo
- Projected year-2 tax
- $1,080 · $90/mo
- Expected delta
- +$264/yr (+$22/mo · 32.4%)
ⓘ Screening estimate from a state-policy table — verify with the county assessor before closing.
Climate risk First Street
- Flood 1/10 Low FEMA zone X (unshaded) · 0% chance over 30 yrs
- Wildfire 5/10 Major
- Heat 6/10 Major 7 d/yr ≥109°F today · 19 d/yr by 30 yrs out
- Wind 3/10 Moderate 6% chance of damaging wind over 30 yrs
- Air quality 2/10 Low 1 unhealthy d/yr today · 1 by 30 yrs out
Nearby sold comps map
Loading sold comps map…
Walkable amenities ~0.75 mi
Loading nearby amenities…
Taxation est. · year 1
- Rental income
- $13,096
- − Mortgage interest
- −$6,722
- − Property taxes
- −$816
- − Insurance
- −$600
- − Repairs & maintenance
- −$1,048
- − Management
- −$1,048
- − Depreciation
- −$3,491
- Taxable loss
- −$628
- Est. tax savings @ 24.0%
- +$151
- After-tax cash flow
- $1,529/yr
For passive investors: Depreciation is non-cash, so a rental often shows a tax loss while cash-flowing — sheltering income. Rental losses are passive: they offset passive income freely, and up to $25,000/yr can offset ordinary (W-2) income if you actively participate and your MAGI is under $100k (phasing out to $0 by $150k); unused losses carry forward. On sale, claimed depreciation is recaptured at up to 25%, and gains may owe capital-gains tax (a 1031 exchange can defer both). Figures are a year-1 estimate at your 24.0% rate — not tax advice; consult a CPA.
Schools (NCES district)
- District
- Lindsay
- NCES district ID
- 4017850
- Math proficiency
- 21% ▼ -11.00%
- Reading proficiency
- 24% ▼ -11.00%
- Median HH income
- $45,406
- Composite
- 19.54/100
- National rank
- #8763
- State rank
- #141 of 270 in OK
Livability — Lindsay
- Score
- 59/100
- State rank
- #380
- US rank
- #19934
Category grades
Schools grade is shown separately in the Schools card above.
Census & demographics
- Census place
- Lindsay, OK
- City population
- 6,289
- Population (ZIP)
- 6,289
Population outlook (Garvin County) Hauer SSP2
- Today (2025)
- 28,277 people
- By 2030
- 28,619 · +1.2%
- By 2040
- 29,478 · +4.2%
- By 2050
- 30,384 · +7.5%
- By 2075
- 34,074 · +20.5%
- By 2100
- 36,099 · +27.7%
Race, ethnicity, and origin ACS 2023
- Neighborhood character
- Predominantly White (77%)
- Race & ethnicity
- White 77% Two or more races 12% Hispanic / Latino 11% Native American 4%
- Hispanic origin (detail)
- Mexican 9%
- Common ancestry
- Lithuanian 2% Iranian 1% Hungarian 1%
- Foreign-born
- 4% · Canada
- Languages at home
- 93% English-only · Spanish 7%
Political lean MEDSL · Garvin
- 2024 margin
- Solid R (+66.1) · D 16.4% · R 82.5% · Other 1.1%
- 2008→2024 swing
- -22.5pp toward R · 2008: -43.6pp · 2024: -66.1pp
- All cycles
- 2024: R+66.1 2020: R+64.2 2016: R+60.7 2012: R+46.1 2008: R+43.6
Not yet ingested
- Civics
- —
Market trends
- HPI YoY
- ▲ 7.17%
- Current HPI
- 234.17
- Rent YoY
- —
- Metro
- —
- State GDP YoY
- ▲ 1.55%
- F500 in state
- 6
Industry mix (Fortune 500 HQ in OK)
| Industry | F500 HQs | Revenue |
|---|---|---|
| Energy | 3 | $48B |
|
||
Price history
+110.5% since first listed4 events — show timeline
- 2026-04-18 Pending — MLSOK
- 2026-03-16 Price Changed $120,000 MLSOK
- 2026-02-04 Listed $125,000 MLSOK
- 2004-06-24 Sold (Public Records) $57,000 Public Records
Property tax history
+3.8%/yrLatest (2025): $816 · +10.9% YoY. Source: county tax records.
Cash-flow waterfall
monthlySold comps — $/sqft
last 12 mo · ≤1 miLoading sold comps…