953 Creek Locks Rd · Rosendale, NY
Flood risk No data
- FEMA flood zone
- —
- Chance of flooding over 30 yrs
- —
- Est. flood insurance / yr
- —
Fire risk No data
- Est. fire insurance / yr
- —
Heat risk No data
- Hot days now (above threshold)
- —
- Hot days in 30 yrs
- —
Wind risk No data
- Chance of severe wind over 30 yrs
- —
Air-quality risk No data
- Unhealthy air days now
- —
- Unhealthy air days in 30 yrs
- —
Risk factors via First Street. Map © Google.
Why this score? — see what drove the C+ grade
The composite is a weighted blend of 9 inputs, each scored 0–100. Each bar is that input's sub-score; the figure is the points it added to the 100-point composite (weight × sub-score).
- Cash flow +22.7/30.0
- Appreciation +7.9/10.0
- ARV discount +7.5/15.0
- DSCR +7.3/10.0
- 1% rule +5.9/10.0
- Schools +4.4/10.0
- Rent growth +2.5/5.0
- Livability +2.5/5.0
- Condition / age +2.5/5.0
$139,000
🖨 Deal sheet 📄 Offer letter ✓ Due diligence
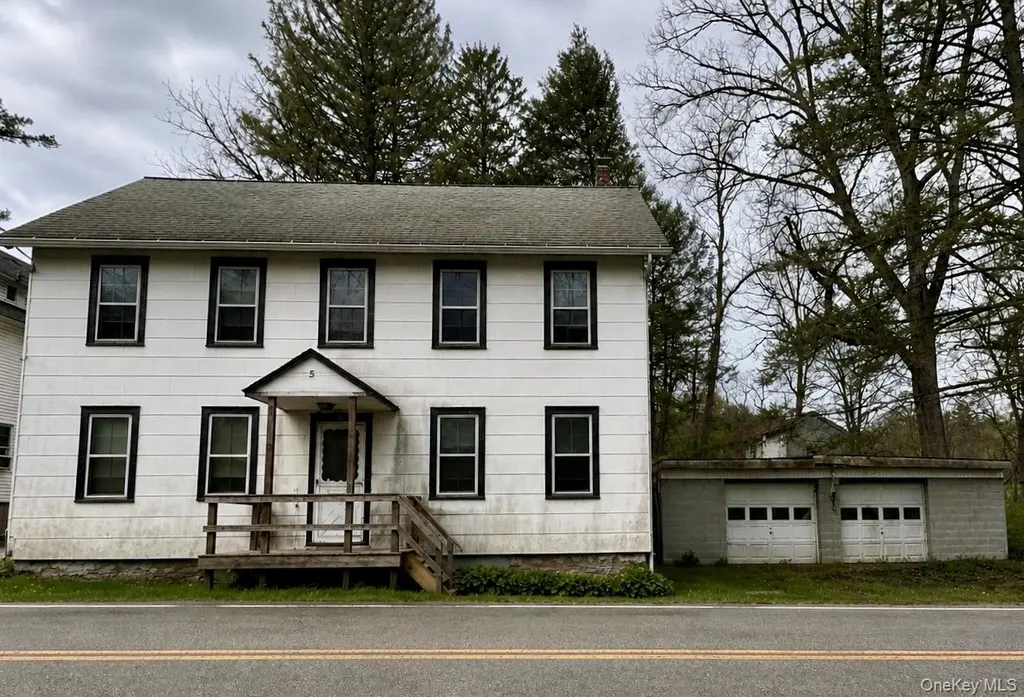
Listing remarks
Built in 1840, this 3-bedroom Colonial presents a rare opportunity to restore a piece of Hudson Valley history. Situated along the Rondout Creek with water frontage, the property offers the potential for a unique full-time residence, weekend retreat, or investment project. Bring your kayaks and enjoy the outdoor lifestyle the Hudson Valley is known for, all approximately 90 miles from NYC. Property requires significant renovation and is being sold as-is. Cash buyers or construction/rehab loans only. Come create your vision and transform this property into something truly special. * ACCEPTED OFFER *
Key facts
- Water frontage
- Rondout creek
- 0.5 acre lot
Tags
Property features AI
Exterior
- Parking: Driveway parking
- Utilities: Septic tank; Electricity connected; Water connected
- Home design: Single-family residence; Property listed as fixer
- Construction: Shingle siding
- Exterior features: Waterfront property
Interior
- Kitchen: No appliances listed
- Bedrooms: Bedrooms count not specified
- Bathrooms: One full bathroom; One half bathroom
- Heating & cooling: Oil heating; No central cooling; Other heating features
- Interior features: Unfinished basement; Pull-down attic stairs; Seven total rooms
- Laundry & utility: No laundry appliances listed
Neighborhood map
What this means for you Summary
Snapshot
- This is a 3-bed/1.5-bath single-family listed at $139k.
Deal economics
- At list price, monthly cash flow is $238 ($3k/yr) — positive.
- The deal already cash-flows at list — no discount required.
- Meets the 1% rule at list price ($2k rent vs $139k).
- Recommended offer: $137k (1.5% below list) — sets the bar for market timing.
Location & tenants
- Location reads: area grade C — affects rentability + tenant quality, not the cash-flow math above.
- Kingston City School District (urban): math 44% / reading 59% proficiency, ranked #355 of 590 in NY (top 60%) — acceptable for families but not a draw, mixed tenant base, ~2y average lease.
- Zoned schools: Robert R Graves School (math 67% / reading 77%, grade A-, #378 of 2,108 statewide, top 20%, 316 students, 51% FRL); J Watson Bailey Middle School (math 22% / reading 48%, grade F, #480 of 729 statewide, top 66%, 968 students, 53% FRL); Kingston High School (math 94% / reading 91%, grade A+, #153 of 1,100 statewide, top 14%, 1,856 students, 85% FRL) — zoned schools average 63% FRL vs 45% district-wide (18 pts higher); higher-poverty schools than district average — tighter screening recommended.
- Zoned-school proficiency averages 66% at this address vs 52% district-wide (+15 pts) — the actual schools serving this property are materially stronger than the Kingston City School District average implies; a family-tenant draw the district grade alone would hide.
- Market conditions: 7 active listings in the ZIP; 464 units permitted in Ulster County in 2024 (170 in 5+ unit buildings).
Forward outlook
- In year one you build about $9k of equity ($961 loan paydown + $8k appreciation (5.9% local appreciation)).
- Ulster County population projected at -14% by 2050 — secular population decline; favor cash flow + early exit over multi-decade hold.
- At projected returns (5.9% appreciation + 3.0% rent growth), your $39k cash investment doubles in ~4 years — after that, you're playing with house money.
- By year 4, paydown + projected appreciation supports a ~$31k cash-out refi (75% LTV) — recoverable capital for the next deal without selling this one.
Negotiation context
- It's been on market 27 days — a 2% lower offer ($137k) is reasonable based on typical stale-listing flexibility.
- Current owner paid $78k; list at $139k implies a 79% gain — meaningful room to come down on a strong offer.
Risks & watch-outs
- Watch-outs: built in 1840 — expect roof / HVAC / electrical / plumbing capex.
Questions for the listing agent
- Built in 1840 — when were the roof, HVAC, electrical panel, plumbing, and water heater last replaced?
- Is there a deadline driving the sale (1031 exchange, divorce, estate, relocation)? That informs how much negotiation room exists.
- What's the average days-on-market for RENTAL listings here right now (not sales)? A rising rental-DOM trend means longer vacancies and softer asking-rent achievability than the comps imply.
- What's the recent tenant-quality profile in this submarket — average credit score on applications, eviction rate, late-payment / NSF rate, and stable-employment percentage? A property-management company in the area should have these aggregated.
- How much new for-sale + rental construction is in the pipeline within 1–3 miles? Heavy new supply typically softens prices + rents 12–24 months out; constrained supply supports both.
Investment metrics
- 1% rule
- 1.09% ✓
- Cap rate
- 8.35%
- Cash-on-cash
- 7.34%
- DSCR
- 1.33
- GRM
- 7.6
CMA / ARV
- ARV (on-the-fly)
- $622,440
- Comps found
- 3
Show comp detail 3 sales within ~0.75 mi
| Address | Dist | Beds/Ba | Sqft | Sold | Price | $/sf | Match |
|---|---|---|---|---|---|---|---|
| 1015 Creek Locks Rd | 0.26mi | 3/1.0 | 1,850 (+8%) | 5mo | $550,000 | $297 | 68 |
| 30 Winchell Ln | 0.29mi | 3/2.5 | 1,734 (+1%) | 17mo | $699,000 | $403 | 66 |
| 1012 Creek Locks Rd | 0.22mi | 3/2.0 | 1,740 (+2%) | 22mo | $634,000 | $364 | 66 |
Match score weights: distance 35% · size 25% · config 20% · recency 20%. Top-matched comps best support the ARV.
Projected returns pro-forma
5.86% appreciation · 3.0% rent growth · sell at horizon
- IRR
- 21.1%
- Equity multiple
- 2.39×
- Total profit
- $54,134
- Equity at exit
- $86,120
- IRR
- 20.3%
- Equity multiple
- 4.80×
- Total profit
- $147,724
- Equity at exit
- $155,097
Cash invested: $38,920 (down + closing). Projections, not guarantees.
Landlord ↔ Tenant lean methodology
- Overall (STATE)
- 15 Strongly Tenant-Friendly
- State New York
- 15 Strongly Tenant-Friendly · D+10
- County
- — inherits STATE
- City
- — inherits STATE
ZIP-level market 12472
- Home prices YoY
- 1.8%
- Active inventory
- 7
- Price-to-rent
- 7.6×
Monthly cashflow live
- Estimated rent
- $1,517 medium interval (Pro) →
- Mortgage (P&I)
- −$729
- Tax est. 1.5%
- −$174 /mo · $2,085/yr
- Insurance
- −$58
- HOA
- −$0
- Vacancy / Maint / Mgmt
- −$319
- Net cashflow
- $238
Break-even live
UW: 25.0% down · 7.5% · 30yr · 1.5% tax · 5.0% vac · 8.0% maint · 8.0% mgmt
Financing live
Cash to close
- Down payment
- $34,750
- Closing costs
- $4,170
- Reserves months
- —
- Total cash needed
- —
Loan-product check · same deal, 3 products live
Conventional
25% down · 7.5% · 30yr
- Down + closing
- —
- Monthly P&I
- —
- Monthly cashflow
- —
- DSCR
- —
- Eligible?
- —
Personal DTI + credit; lowest rate.
DSCR
20% down · 8.5% · 30yr
- Down + closing
- —
- Monthly P&I
- —
- Monthly cashflow
- —
- DSCR
- —
- Eligible?
- —
No personal income docs; deal must DSCR.
Hard money
10% down · 12.0% · 12mo
- Down + closing
- —
- Monthly P&I
- —
- Monthly cashflow
- —
- DSCR
- —
- Eligible?
- —
Short-term bridge; refi at stabilization.
Listing history 13 events
-
2026-06-12status $139,000 Pending 27 DOM
-
2026-06-09days on market $139,000 Active 27 DOM
-
2026-06-08days on market $139,000 Active 26 DOM
-
2026-06-07days on market $139,000 Active 25 DOM
-
2026-06-03days on market $139,000 Active 21 DOM
-
2026-06-02remarks 605-char remark
-
2026-06-02days on market $139,000 Active 20 DOM
-
2026-06-01days on market $139,000 Active 19 DOM
-
2026-05-31days on market $139,000 Active 18 DOM
-
2026-05-30days on market $139,000 Active 17 DOM
-
2026-05-13$139,000 Active
-
1990-12-20soldstatus $77,500
-
1986-05-20soldstatus $52,900
ⓘ Source: listings_history table (triggers on properties + properties_extension) + one-shot
backfill from property_details.listing_events for pre-trigger history.
Nearby sold comps map
Loading sold comps map…
Walkable amenities ~0.75 mi
Loading nearby amenities…
Taxation est. · year 1
- Rental income
- $18,208
- − Mortgage interest
- −$7,786
- − Property taxes
- −$2,085
- − Insurance
- −$695
- − Repairs & maintenance
- −$1,457
- − Management
- −$1,457
- − Depreciation
- −$4,044
- Taxable income
- $685
- Est. tax owed @ 24.0%
- −$164
- After-tax cash flow
- $2,693/yr
For passive investors: Depreciation is non-cash, so a rental often shows a tax loss while cash-flowing — sheltering income. Rental losses are passive: they offset passive income freely, and up to $25,000/yr can offset ordinary (W-2) income if you actively participate and your MAGI is under $100k (phasing out to $0 by $150k); unused losses carry forward. On sale, claimed depreciation is recaptured at up to 25%, and gains may owe capital-gains tax (a 1031 exchange can defer both). Figures are a year-1 estimate at your 24.0% rate — not tax advice; consult a CPA.
Schools (NCES district)
- District
- Kingston City School District
- NCES district ID
- 3616290
- Math proficiency
- 44% ▲ 1.00%
- Reading proficiency
- 59% ▲ 20.00%
- Median HH income
- $52,586
- Composite
- 44.22/100
- National rank
- #2849
- State rank
- #355 of 590 in NY
Livability — Rosendale
No livability data for this city. (Only ~50 U.S. cities are tracked.)
Census & demographics
- City population
- 1,118
- Population (ZIP)
- 1,118
Population outlook (Ulster County) Hauer SSP2
- Today (2025)
- 175,887 people
- By 2030
- 171,876 · -2.3%
- By 2040
- 161,771 · -8.0%
- By 2050
- 151,470 · -13.9%
- By 2075
- 133,023 · -24.4%
- By 2100
- 113,504 · -35.5%
Race, ethnicity, and origin ACS 2023
- Neighborhood character
- Predominantly White (82%)
- Race & ethnicity
- White 82% Two or more races 9% Black 4% Hispanic / Latino 2% Asian 2% Pacific Islander 2%
- Common ancestry
- Romanian 8% Iranian 7% Slovak 7%
- Foreign-born
- 2%
- Languages at home
- 98% English-only · Other Asian/Pacific 1% Russian/Polish/Slavic 1%
Political lean MEDSL · Ulster
- 2024 margin
- D (+18.7) · D 59.3% · R 40.7%
- 2008→2024 swing
- -4.9pp toward R · 2008: 23.6pp · 2024: 18.7pp
- All cycles
- 2024: D+18.7 2020: D+20.9 2016: D+9.1 2012: D+21.9 2008: D+23.6
Not yet ingested
- Civics
- —
Market trends
- HPI YoY
- ▲ 5.86%
- Current HPI
- 337.0458
- Rent YoY
- —
- Metro
- —
- State GDP YoY
- ▲ 2.60%
- F500 in state
- 92
Industry mix (Fortune 500 HQ in NY)
| Industry | F500 HQs | Revenue |
|---|---|---|
| Financial Services | 10 | $950B |
|
||
| Consumer Goods | 9 | $162B |
|
||
| Insurance | 4 | $225B |
|
||
| Telecommunications | 2 | $144B |
|
||
| Pharmaceuticals | 2 | $112B |
|
||
| Media / Entertainment | 2 | $69B |
|
||
Price history
+162.8% since first listed3 events — show timeline
- 2026-05-13 Listed $139,000 OneKey® MLS as Distributed by MLS Grid
- 1990-12-20 Sold (Public Records) $77,500 Public Records
- 1986-05-20 Sold (Public Records) $52,900 Public Records
Property tax history
+3.3%/yrLatest (2025): $7,558 · +2.1% YoY. Source: county tax records.
Cash-flow waterfall
monthlySold comps — $/sqft
last 12 mo · ≤1 miLoading sold comps…