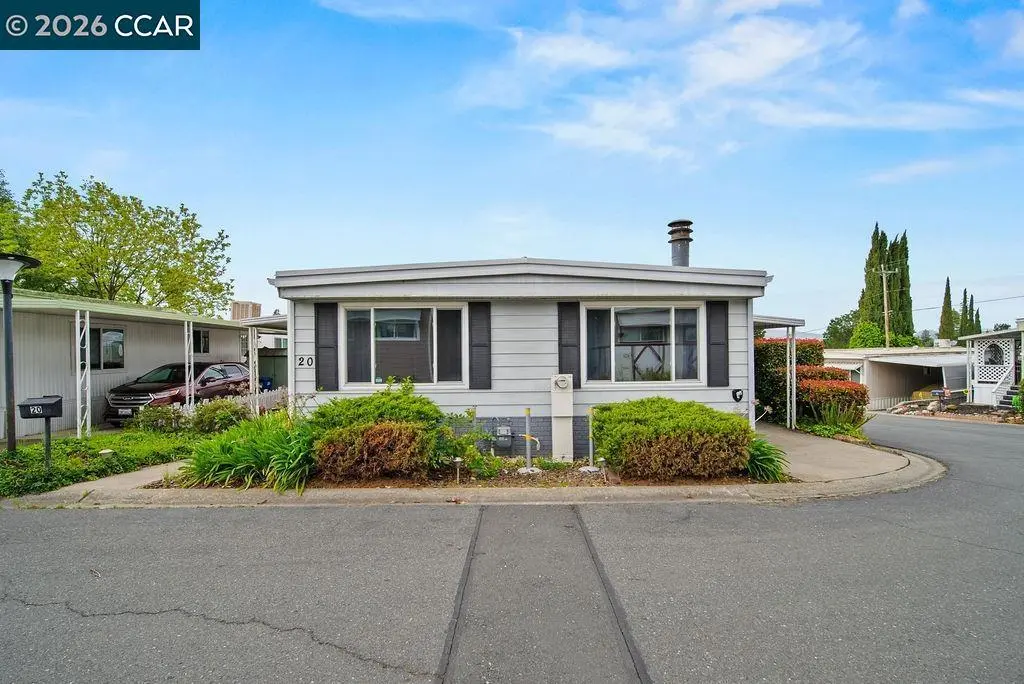
20 Terrace Dr #20 · Concord, CA
Flood risk 1/10 · Minimal
- FEMA flood zone
- X (unshaded)
- Chance of flooding over 30 yrs
- 0.0%
- Est. flood insurance / yr
- $507 – $1,088
Fire risk 3/10 · Minor
- Est. fire insurance / yr
- $659 – $1,223
Heat risk 4/10 · Minor
- Hot days now (above 96°F)
- 7 days/yr
- Hot days in 30 yrs
- 13 days/yr
Wind risk 1/10 · Minimal
- Chance of severe wind over 30 yrs
- —
Air-quality risk 9/10 · Severe
- Unhealthy air days now
- 18 days/yr
- Unhealthy air days in 30 yrs
- 19 days/yr
Risk factors via First Street. Map © Google.
Why this score? — see what drove the C grade
The composite is a weighted blend of 9 inputs, each scored 0–100. Each bar is that input's sub-score; the figure is the points it added to the 100-point composite (weight × sub-score).
- Cash flow +24.2/30.0
- DSCR +7.8/10.0
- ARV discount +7.0/15.0
- 1% rule +6.3/10.0
- Schools +3.8/10.0
- Rent growth +3.2/5.0
- Livability +3.2/5.0
- Condition / age +2.5/5.0
- Appreciation +0.0/10.0
$219,000
🖨 Deal sheet (PDF) 📄 Offer letter ✓ Due diligence
Listing remarks
Welcome to 20 Terrace Drive, located in the Concord Mobile Home Park - offering a blend of comfort and everyday convenience. Step inside to find resilient laminate flooring throughout, a wood-burning fireplace, central air conditioning, and the convenience of an indoor washer and dryer. The kitchen has been recently refreshed with new paint and updated lighting (2025), along with newer appliances (2012 and beyond), creating a light and inviting space for cooking and gathering. Residents of the community also have access to great amenities, including a swimming pool and clubhouse, adding to the relaxed atmosphere that makes this property an enjoyable place to live.
Key facts
- Newer appliances
- Refreshed kitchen
- Community pool
Tags
Property features AI
Finance
- Other: Located in Concord Mobile Home Park; Community pool available
- HOA & community: Pets allowed (cats and dogs; number and size limits; upon approval); Community clubhouse; Community pool; Community laundry; Car wash area; Park interview required; Pet restrictions
Exterior
- Parking: Carport with awning — tandem parking and 2+ carport spaces
- Utilities: Private water source; Internet available; Natural gas connected
- Home design: Manufactured home (mobile home) in park; Double-wide body type
- Construction: Aluminum siding
- Exterior features: Patio with awning(s); Back yard and side yard; Yard space; Corner, level lot; Shed(s)
Interior
- Kitchen: Breakfast bar and eat-in kitchen; Dishwasher; Microwave; Free-standing range/oven; Self-cleaning oven; Refrigerator; Disposal; Pantry; Solid-surface countertops
- Bedrooms: 2 bedrooms (street level; primary bedroom suite on main level)
- Flooring: Laminate flooring
- Bathrooms: 2 full bathrooms; Primary bathroom with stall shower; Other bathroom with shower over tub
- Heating & cooling: Forced-air heating (natural gas); Central air conditioning; Ceiling fans
- Interior features: Breakfast bar; Solid-surface counters; Pantry; Formal dining room; Window coverings; Wood-burning fireplace in living room
- Laundry & utility: Laundry room with stacked washer/dryer included; Gas water heater
Neighborhood map
What this means for you Summary
Snapshot
- This is a 2-bed/2.0-bath manufactured listed at $219k.
Deal economics
- At list price, monthly cash flow is $436 ($5k/yr) — positive.
- The deal already cash-flows at list — no discount required.
- Meets the 1% rule at list price ($2k rent vs $219k).
- Recommended offer: $212k (3.0% below list) — sets the bar for market timing.
- Cap rate 8.7% vs local median 2.8% in Concord — top-decile yield for the area; either an underpriced asset or a hidden risk that comps aren't pricing in. Stress-test before assuming the spread holds.
Location & tenants
- Location reads 65/100 on livability (#397 in CA) — a middle-class / working-renter tenant base. Strengths: employment A+, health & safety A+, housing B; Watch: crime F, amenities F, commute F.
- Mt. Diablo Unified (suburban): math 36% / reading 45% proficiency, ranked #202 of 517 in CA (top 39%) — families likely to look elsewhere, expect single-tenant / working-renter base with shorter leases.
- Zoned schools: Woodside Elementary (math 32% / reading 27%, grade F, #856 of 1,571 statewide, top 57%, 278 students, 32% FRL); Oak Grove Middle (math 8% / reading 19%, grade F, #468 of 498 statewide, top 94%, 720 students, 81% FRL); Ygnacio Valley High (math 12% / reading 32%, grade F, #950 of 1,170 statewide, top 82%, 1,172 students, 82% FRL) — zoned schools average 65% FRL vs 37% district-wide (28 pts higher); higher-poverty schools than district average — tighter screening recommended.
- Zoned-school proficiency averages 22% at this address vs 40% district-wide (-19 pts) — the specific schools serving this property underperform the Mt. Diablo Unified average; the district grade overstates school quality for this exact location.
- Market conditions: Rents rising (+2.8%/yr); 134 active listings in the ZIP; 40 comparable units currently listed for rent nearby; rentals at typical pace (median 21d on market — plan ~3-4 weeks tenant-placement turnaround); high-income renter base; 2,169 units permitted in Contra Costa County in 2024 (896 in 5+ unit buildings).
Forward outlook
- Local home prices are declining (-3.0%/yr); year-one equity from $2k of loan paydown is wiped out by about $7k of value loss. Plan a longer hold.
- Contra Costa County population projected at +26% by 2050 — long-run rental-demand tailwind backs the buy-and-hold thesis.
Negotiation context
- It's been on market 51 days — a 3% lower offer ($212k) is reasonable based on typical stale-listing flexibility.
- 4 sale attempts since 15y ago; this cycle's ask has dropped $20k (8%) from the opening price — seller is motivated, your offer sets the floor, not the list.
Questions for the listing agent
- It's been on market 51 days. Have you received any prior offers? Is the seller open to a 3% concession, seller financing, or rate buy-down credit?
- Is there a deadline driving the sale (1031 exchange, divorce, estate, relocation)? That informs how much negotiation room exists.
- Crime grade is F in this area — have there been break-ins, vandalism, or insurance claims at this property in the last 3 years? What carrier currently insures it and at what premium?
- What's the average days-on-market for RENTAL listings here right now (not sales)? A rising rental-DOM trend means longer vacancies and softer asking-rent achievability than the comps imply.
- What's the recent tenant-quality profile in this submarket — average credit score on applications, eviction rate, late-payment / NSF rate, and stable-employment percentage? A property-management company in the area should have these aggregated.
- How much new for-sale + rental construction is in the pipeline within 1–3 miles? Heavy new supply typically softens prices + rents 12–24 months out; constrained supply supports both.
Investment metrics
- 1% rule
- 1.13% ✓
- Cap rate
- 8.68%
- Cash-on-cash
- 8.54%
- DSCR
- 1.38
- GRM
- 7.4
CMA / ARV
- ARV (on-the-fly)
- $216,576
- Comps found
- 8
Show comp detail 8 sales within ~0.75 mi
| Address | Dist | Beds/Ba | Sqft | Sold | Price | $/sf | Match |
|---|---|---|---|---|---|---|---|
| 20 Terrace Dr | 0.01mi | 2/2.0 | 1,152 (0%) | 18mo | $180,000 | $156 | 85 |
| 19 Terrace Dr | 0.11mi | 2/2.0 | 1,154 (+0%) | 19mo | $285,000 | $247 | 79 |
| 36 Helen Ave #36 | 0.25mi | 3/2.0 (+1) | 1,100 (-4%) | 0mo | $239,000 | $217 | 76 |
| 100 Welcome Ave | 0.28mi | 2/2.0 | 1,200 (+4%) | 9mo | $170,000 | $142 | 72 |
| 131 Laila Ln | 0.12mi | 2/2.0 | 1,080 (-6%) | 16mo | $248,000 | $230 | 71 |
| 1080 San Miguel Rd #127 | 0.40mi | 2/2.0 | 1,100 (-4%) | 9mo | $200,000 | $182 | 66 |
| 26 David Dr | 0.22mi | 3/2.0 (+1) | 1,020 (-12%) | 3mo | $170,000 | $167 | 64 |
| 14 Terrace Dr | 0.07mi | 2/2.0 | 1,008 (-12%) | 17mo | $189,000 | $188 | 62 |
Match score weights: distance 35% · size 25% · config 20% · recency 20%. Top-matched comps best support the ARV.
Projected returns pro-forma
-3.0% appreciation · 2.77% rent growth · sell at horizon
- IRR
- -3.6%
- Equity multiple
- 0.87×
- Total profit
- $-8,226
- Equity at exit
- $32,654
- IRR
- 5.9%
- Equity multiple
- 1.43×
- Total profit
- $26,450
- Equity at exit
- $18,935
Cash invested: $61,320 (down + closing). Projections, not guarantees.
Landlord ↔ Tenant lean methodology
- Overall (STATE)
- 18 Strongly Tenant-Friendly
- State California
- 18 Strongly Tenant-Friendly · D+13
- County
- — inherits STATE
- City
- — inherits STATE
ZIP-level market 94518
- Rents YoY
- 2.8%
- Active inventory
- 134
- Price-to-rent
- 7.4×
Monthly cashflow live
- Estimated rent
- $2,468 high interval (Pro) →
- Mortgage (P&I)
- −$1,148
- Tax est. 1.5%
- −$274 /mo · $3,285/yr
- Insurance
- −$91
- HOA
- −$0
- Vacancy / Maint / Mgmt
- −$518
- Net cashflow
- $436
Break-even live
Sensitivity live
| Price | -10% $588 | -5% $512 | +0% $436 | +5% $361 | +10% $285 |
|---|---|---|---|---|---|
| Rent | -10% $241 | -5% $339 | +0% $436 | +5% $534 | +10% $631 |
| Rate | -1.0pp $547 | -0.5pp $492 | base $436 | +0.5pp $380 | +1.0pp $322 |
UW: 25.0% down · 7.5% · 30yr · 1.5% tax · 5.0% vac · 8.0% maint · 8.0% mgmt
Financing live
Cash to close
- Down payment
- $54,750
- Closing costs
- $6,570
- Reserves months
- —
- Total cash needed
- —
Loan-product check · same deal, 3 products live
Conventional
25% down · 7.5% · 30yr
- Down + closing
- —
- Monthly P&I
- —
- Monthly cashflow
- —
- DSCR
- —
- Eligible?
- —
Personal DTI + credit; lowest rate.
DSCR
20% down · 8.5% · 30yr
- Down + closing
- —
- Monthly P&I
- —
- Monthly cashflow
- —
- DSCR
- —
- Eligible?
- —
No personal income docs; deal must DSCR.
Hard money
10% down · 12.0% · 12mo
- Down + closing
- —
- Monthly P&I
- —
- Monthly cashflow
- —
- DSCR
- —
- Eligible?
- —
Short-term bridge; refi at stabilization.
Rent comps 40 comps
| Address | Beds | Baths | Sqft | Rent | $/sqft | DOM | Units | Dist |
|---|---|---|---|---|---|---|---|---|
| 1070 San Miguel Rd Concord, CA | 1.0–2.0 | 1.0–1.5 | 890 | $2,590 | $2.91 | 21d | 1 | 0.31mi |
| 2043 Sierra Rd #11 Concord, CA | 2.0 | 1.5 | 904 | $2,100 | $2.32 | 26d | 1 | 0.64mi |
| 2039 Sierra Rd Concord, CA | 3.0 | 2.0 | 1098 | $2,895 | $2.64 | 26d | 1 | 0.66mi |
| 1036 Oak Grove Rd Concord, CA | 1.0–2.0 | 1.0–1.5 | 810 | $2,600 | $3.21 | 26d | 2 | 0.67mi |
| 1036 Oak Grove Rd Concord, CA | 1.0–2.0 | 1.0–1.5 | 826 | $2,600 | $3.15 | 0d | 4 | 0.67mi |
| 2751 Monument Blvd Concord, CA | 1.0–2.0 | 1.0 | 676 | $2,045 | $3.03 | 4d | 1 | 0.69mi |
| 1236 Detroit Ave Concord, CA | 2.0 | 1.0 | 750 | $2,430 | $3.24 | 6d | 1 | 0.76mi |
| 1050 Oak Grove Rd Concord, CA | 1.0–2.0 | 1.0 | 740 | $2,325 | $3.14 | 3d | 3 | 0.79mi |
| 2925 Monument Blvd Concord, CA | 2.0–3.0 | 1.5 | 1084 | $2,595 | $2.39 | 0d | 6 | 0.80mi |
| 1220 Pine Creek Way #1 Concord, CA | 3.0 | 1.5 | 1261 | $2,950 | $2.34 | 26d | 1 | 0.80mi |
| 1160 Meadow Ln Concord, CA | 1.0–2.0 | 1.0–1.5 | 740 | $2,240 | $3.02 | 13d | 9 | 0.92mi |
| 2067 Riley Ct Unit 5 Concord, CA | 1.0 | 1.0 | 710 | $1,750 | $2.46 | 20d | 1 | 0.93mi |
| 1750 Diane Ct Concord, CA | 2.0 | 1.0 | 900 | $2,325 | $2.58 | 26d | 1 | 0.98mi |
| 1185 Meadow Ln Unit 115 Concord, CA | 1.0 | 1.0 | 800 | $2,350 | $2.94 | 26d | 1 | 0.98mi |
| 1866 Robin Ln Unit 6 Concord, CA | 2.0 | 1.0 | 700 | $2,200 | $3.14 | 22d | 1 | 0.99mi |
| 1883 Robin Ln #1 Concord, CA | 2.0 | 1.0 | 950 | $2,600 | $2.74 | 26d | 1 | 1.00mi |
| 1867 Robin Ln Unit 3 Concord, CA | 1.0 | 1.0 | 700 | $1,595 | $2.28 | 26d | 1 | 1.01mi |
| 1195 Heather Ct Unit A Concord, CA | 2.0 | 1.0 | 980 | $2,700 | $2.76 | 5d | 1 | 1.02mi |
| 1818 Laguna St Concord, CA | 1.0–2.0 | 1.0 | 750 | $2,350 | $3.13 | 0d | 14 | 1.03mi |
| 1835 Robin Ln Concord, CA | 2.0 | 2.0 | 800 | $2,100 | $2.62 | 6d | 1 | 1.05mi |
| 1835 Robin Ln Unit 11 Concord, CA | 2.0 | 2.0 | 800 | $2,100 | $2.62 | 25d | 1 | 1.06mi |
| 1590 Frisbie Ct Unit 6 Concord, CA | 2.0 | 1.0 | 850 | $2,195 | $2.58 | 16d | 1 | 1.07mi |
| 1500 Ellis St Concord, CA | 2.0 | 1.0–2.0 | 664 | $2,350 | $3.54 | 0d | 5 | 1.09mi |
| 1660 Haller Ct Concord, CA | 2.0 | 1.0 | 880 | $2,125 | $2.41 | 23d | 1 | 1.09mi |
| 1841 Laguna St Concord, CA | 2.0 | 1.0 | 925 | $2,372 | $2.56 | 26d | 5 | 1.10mi |
| 1441 Detroit Ave Concord, CA | 1.0–2.0 | 1.0–2.0 | 738 | $2,391 | $3.24 | 3d | 11 | 1.11mi |
| 1167 Saint Matthew Pl Concord, CA | 2.0 | 1.0 | 850 | $2,295 | $2.70 | 6d | 1 | 1.11mi |
| 1631 Frisbie Ct Concord, CA | 2.0 | 1.0 | 750 | $2,100 | $2.80 | 25d | 1 | 1.11mi |
| 1631 Frisbie Ct Concord, CA | 2.0 | 1.0 | 750 | $2,100 | $2.80 | 6d | 1 | 1.11mi |
| 1641 Frisbie Ct Concord, CA | 2.0 | 1.0 | 900 | $2,325 | $2.58 | 26d | 1 | 1.12mi |
| 1301 Traynor Rd Concord, CA | 3.0 | 1.0 | 1024 | $3,395 | $3.32 | 0d | 1 | 1.12mi |
| 1555 Galindo St Concord, CA | 1.0–3.0 | 1.0–2.5 | 1045 | $3,723 | $3.56 | 0d | 13 | 1.14mi |
| 2520 Ryan Rd Concord, CA | 2.0 | 2.0 | 1012 | $2,750 | $2.72 | 26d | 1 | 1.17mi |
| 3055 Treat Blvd Concord, CA | 2.0 | 2.0 | 973 | $2,500 | $2.57 | 26d | 1 | 1.22mi |
| 1500 Pine St Concord, CA | 1.0–2.0 | 1.0 | 735 | $2,200 | $2.99 | 11d | 1 | 1.23mi |
| 1590 Detroit Ave Concord, CA | 2.0 | 1.0 | 878 | $2,500 | $2.85 | 26d | 1 | 1.23mi |
| 1730 Adelaide St Concord, CA | 2.0 | 1.0 | 940 | $2,105 | $2.24 | 0d | 1 | 1.26mi |
| 1790 Ellis St #12 Concord, CA | 2.0 | 2.0 | 1025 | $2,650 | $2.59 | 26d | 1 | 1.26mi |
| 1704 Clayton Rd Concord, CA | 1.0–2.0 | 1.0 | 750 | $2,250 | $3.00 | 26d | 1 | 1.28mi |
| 1740 Detroit Ave Concord, CA | 1.0 | 1.0 | 725 | $1,980 | $2.73 | 14d | 1 | 1.28mi |
Listing history 24 events
-
2026-06-21days on market $219,000 Active 51 DOM
-
2026-06-18days on market $219,000 Active 48 DOM
-
2026-06-18price $219,000 Active 47 DOM
-
2026-06-17days on market $229,000 Active 47 DOM
-
2026-06-16days on market $229,000 Active 46 DOM
-
2026-06-15price $229,000 Active 45 DOM
-
2026-06-15days on market $239,000 Active 45 DOM
-
2026-06-13days on market $239,000 Active 43 DOM
-
2026-06-13days on market $239,000 Active 42 DOM
-
2026-06-10days on market $239,000 Active 39 DOM
-
2026-06-08days on market $239,000 Active 38 DOM
-
2026-06-07days on market $239,000 Active 37 DOM
-
2026-06-04days on market $239,000 Active 34 DOM
-
2026-06-03days on market $239,000 Active 33 DOM
-
2026-06-02days on market $239,000 Active 32 DOM
-
2026-06-01days on market $239,000 Active 31 DOM
-
2026-05-31days on market $239,000 Active 30 DOM
-
2026-05-18status Active
-
2026-05-15status Pending
-
2026-04-28$239,000 Active
-
2026-04-12historical
-
2026-02-28Active
-
2011-08-24historical
-
2011-08-03New
ⓘ Source: listings_history table (triggers on properties + properties_extension) + one-shot
backfill from property_details.listing_events for pre-trigger history.
Climate risk First Street
- Flood 1/10 Low FEMA zone X (unshaded) · 0% chance over 30 yrs
- Wildfire 3/10 Moderate
- Heat 4/10 Moderate 7 d/yr ≥96°F today · 13 d/yr by 30 yrs out
- Wind 1/10 Low
- Air quality 9/10 Extreme 18 unhealthy d/yr today · 19 by 30 yrs out
Nearby sold comps map
Loading sold comps map…
Walkable amenities ~0.75 mi
Loading nearby amenities…
Taxation est. · year 1
- Rental income
- $29,618
- − Mortgage interest
- −$12,267
- − Property taxes
- −$3,285
- − Insurance
- −$1,095
- − Repairs & maintenance
- −$2,369
- − Management
- −$2,369
- − Depreciation
- −$6,371
- Taxable income
- $1,861
- Est. tax owed @ 24.0%
- −$447
- After-tax cash flow
- $4,790/yr
For passive investors: Depreciation is non-cash, so a rental often shows a tax loss while cash-flowing — sheltering income. Rental losses are passive: they offset passive income freely, and up to $25,000/yr can offset ordinary (W-2) income if you actively participate and your MAGI is under $100k (phasing out to $0 by $150k); unused losses carry forward. On sale, claimed depreciation is recaptured at up to 25%, and gains may owe capital-gains tax (a 1031 exchange can defer both). Figures are a year-1 estimate at your 24.0% rate — not tax advice; consult a CPA.
Schools (NCES district)
- District
- Mt. Diablo Unified
- NCES district ID
- 0626370
- Math proficiency
- 36% ▼ -2.00%
- Reading proficiency
- 45% ▼ -5.00%
- Median HH income
- $77,494
- Composite
- 37.5/100
- National rank
- #4401
- State rank
- #202 of 517 in CA
Livability — Concord
- Score
- 65/100
- State rank
- #397
- US rank
- #13519
Category grades
Schools grade is shown separately in the Schools card above.
Census & demographics
- Census place
- Concord, CA
- County
- Contra Costa County · 1,059,880 people
- City population
- 125,693
- Metro
- San Francisco-Oakland-Berkeley, CA
- Population (ZIP)
- 27,345
- Household income
- $112,094
- Rent vs Own
- Severe rent burden
- 1071.0
Population outlook (Contra Costa County) Hauer SSP2
- Today (2025)
- 1,287,720 people
- By 2030
- 1,364,937 · +6.0%
- By 2040
- 1,506,209 · +17.0%
- By 2050
- 1,624,373 · +26.1%
- By 2075
- 1,853,193 · +43.9%
- By 2100
- 1,901,231 · +47.6%
Race, ethnicity, and origin ACS 2023
- Neighborhood character
- Diverse neighborhood (Simpson 0.67)
- Race & ethnicity
- White 48% Hispanic / Latino 29% Two or more races 18% Asian 13% Black 2% Native American 1%
- Hispanic origin (detail)
- Mexican 17%
- Common ancestry
- Lithuanian 2% Italian 2% Slovak 2%
- Foreign-born
- 26% · Canada, China, Jamaica
- Languages at home
- 64% English-only · Spanish 20% Other Indo-European 5% Chinese 4%
Political lean MEDSL · Contra Costa
- 2024 margin
- Solid D (+38.0) · D 67.3% · R 29.4% · Other 3.3%
- 2008→2024 swing
- +0.2pp no change · 2008: 37.8pp · 2024: 38.0pp
- All cycles
- 2024: D+38.0 2020: D+45.3 2016: D+43.5 2012: D+33.7 2008: D+37.8
Not yet ingested
- Civics
- —
Market trends
- HPI YoY
- ▼ -817.60%
- Current HPI
- 149.0257
- Rent YoY
- ▲ 2.77%
- Metro
- San Francisco-Oakland-Berkeley, CA
- State GDP YoY
- ▲ 3.21%
- F500 in state
- 116
Industry mix (Fortune 500 HQ in CA)
| Industry | F500 HQs | Revenue |
|---|---|---|
| Technology | 27 | $1,492B |
|
||
| Financial Services | 3 | $174B |
|
||
| Retail | 3 | $44B |
|
||
| Insurance | 3 | $26B |
|
||
| Media / Entertainment | 2 | $115B |
|
||
| Pharmaceuticals / Biotech | 2 | $62B |
|
||
Price history
7 events — show timeline
- 2026-05-18 Relisted — bridgeMLS, Bay East AOR, or Contra Costa AOR
- 2026-05-15 Pending — bridgeMLS, Bay East AOR, or Contra Costa AOR
- 2026-04-28 Listed $239,000 bridgeMLS, Bay East AOR, or Contra Costa AOR
- 2026-04-12 Listing Removed — bridgeMLS, Bay East AOR, or Contra Costa AOR
- 2026-02-28 Listed — bridgeMLS, Bay East AOR, or Contra Costa AOR
- 2011-08-24 Listing Removed — bridgeMLS, Bay East AOR, or Contra Costa AOR
- 2011-08-03 Listed — bridgeMLS, Bay East AOR, or Contra Costa AOR
Cash-flow waterfall
monthlySold comps — $/sqft
last 12 mo · ≤1 miLoading sold comps…