14925 GREAT SOUTHERN OVERLAND STAGE Rte Unit A12 · Julian, CA
Flood risk 6/10 · Moderate
- FEMA flood zone
- D
- Chance of flooding over 30 yrs
- 0.74%
- Est. flood insurance / yr
- $544 – $1,084
Fire risk 5/10 · Moderate
- Est. fire insurance / yr
- $659 – $1,223
Heat risk 8/10 · Major
- Hot days now (above 102°F)
- 9 days/yr
- Hot days in 30 yrs
- 26 days/yr
Wind risk 1/10 · Minimal
- Chance of severe wind over 30 yrs
- —
Air-quality risk 3/10 · Minor
- Unhealthy air days now
- 4 days/yr
- Unhealthy air days in 30 yrs
- 4 days/yr
Risk factors via First Street. Map © Google.
Why this score? — see what drove the B grade
The composite is a weighted blend of 9 inputs, each scored 0–100. Each bar is that input's sub-score; the figure is the points it added to the 100-point composite (weight × sub-score).
- Cash flow +30.0/30.0
- 1% rule +10.0/10.0
- DSCR +10.0/10.0
- ARV discount +7.5/15.0
- Condition / age +3.8/5.0
- Schools +3.5/10.0
- Livability +2.9/5.0
- Rent growth +2.5/5.0
- Appreciation +0.0/10.0
$44,000
🖨 Deal sheet 📄 Offer letter ✓ Due diligence
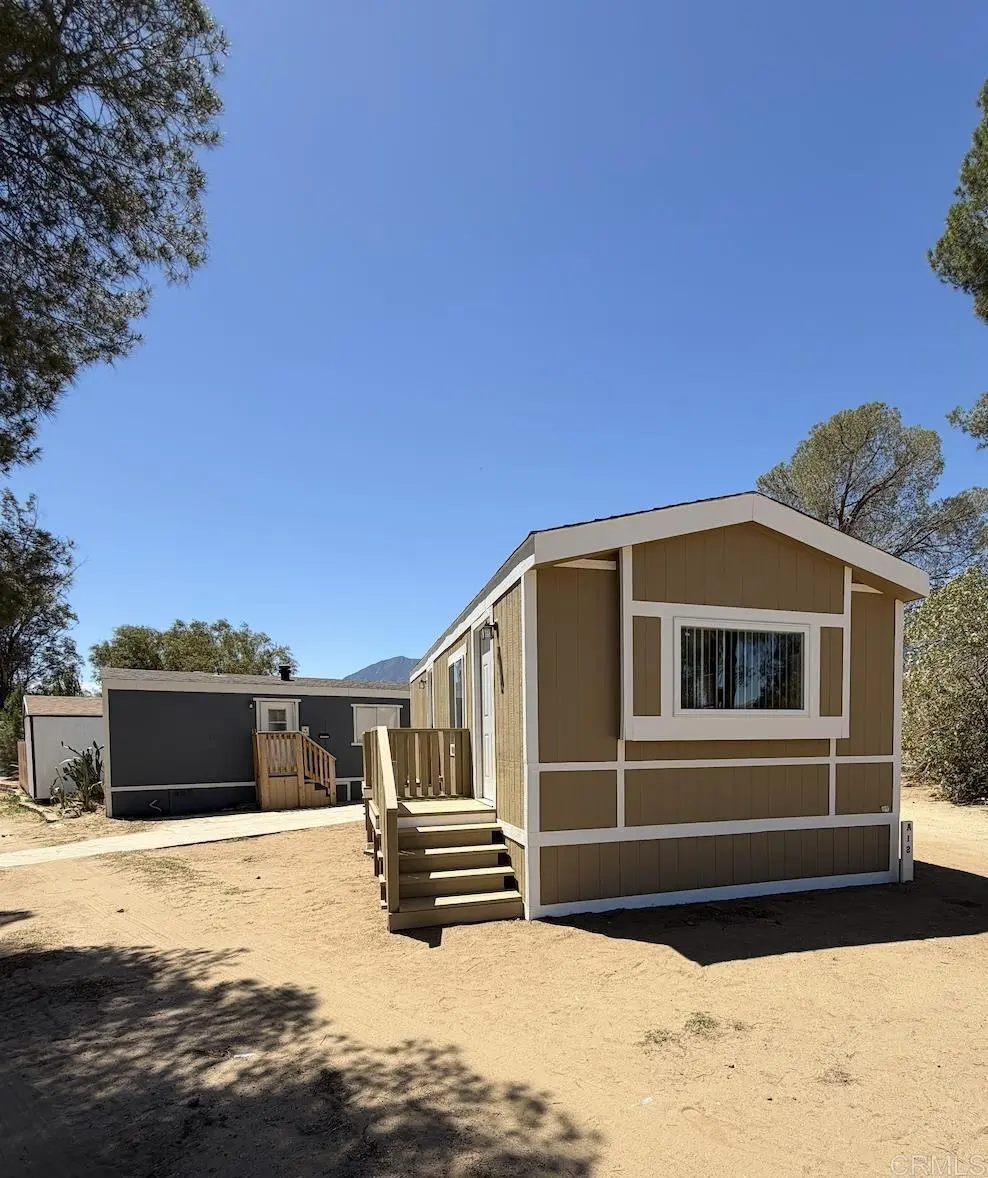
Listing remarks
Completely remodeled 1 bedroom/1 bathroom Manufactured Home in Butterfield Community just outside of Julian. Butterfield is a Manufactured Home & RV community in Mason Valley near Julian surrounded by the beautiful Anza Borrego desert. Amenities include a general store, 3 swimming pools, clubhouse and nearby recreational trails. This is a family-friendly, all-ages park within the Julian school district with on-site bus pick up/drop off! Space rent is $500. Financing may be available with as little as 10% down. 6 MONTHS FREE SPACE RENT WITH CASH PURCHASE.
Key facts
- Recreational trails
- Remodeled
- Clubhouse
Tags
Property features AI
Finance
- Other: Manager approval required for residency; Pets allowed (dogs and cats; number limit applies)
- Financial info: Assessments: Unknown
- HOA & community: Land lease of $500; Rural community
Exterior
- Parking: 1 uncovered parking space (total 1 parking space); Located in Butterfield park
- Utilities: Shared well water; Community septic
- Home design: Single-story mobile home (Model 445A); Mobile home remains on site; Has a view
- Construction: Mobile home approximately 13 ft wide by 33 ft long; Year built source: seller
- Exterior features: Community pool; Lot is level/flat
Interior
- Kitchen: Kitchen (details not specified)
- Bathrooms: 1 full bathroom
- Heating & cooling: Electric cooling
- Interior features: One-level home; Entry accessed via stairs; Kitchen
- Laundry & utility: Laundry available inside; Community laundry available
Neighborhood map
What this means for you Summary
Snapshot
- This is a 1-bed/1.0-bath manufactured listed at $44k. Condition is rated good.
Deal economics
- At list price, monthly cash flow is $921 ($11k/yr) — positive.
- The deal already cash-flows at list — no discount required.
- Meets the 1% rule at list price ($2k rent vs $44k).
- Recommended offer: $43k (3.0% below list) — sets the bar for market timing.
- Cap rate 31.4% vs local median 2.1% in Julian — top-decile yield for the area; either an underpriced asset or a hidden risk that comps aren't pricing in. Stress-test before assuming the spread holds.
Location & tenants
- Location reads 58/100 on livability (#684 in CA) — a working-class tenant base; expect higher turnover. Strengths: crime A+, employment A; Watch: schools C-, amenities F, cost of living F.
- Julian Union Elementary (rural): math 35% / reading 39% proficiency, ranked #791 of 1,400 in CA (top 56%) — families likely to look elsewhere, expect single-tenant / working-renter base with shorter leases.
- Market conditions: 127 active listings in the ZIP; 11,759 units permitted in San Diego County in 2024 (7,244 in 5+ unit buildings).
Forward outlook
- Local home prices are declining (-3.0%/yr); year-one equity from $304 of loan paydown is wiped out by about $1k of value loss. Plan a longer hold.
- San Diego County population projected at +20% by 2050 — long-run rental-demand tailwind backs the buy-and-hold thesis.
- At projected returns (-3.0% appreciation + 3.0% rent growth), your $12k cash investment doubles in ~2 years — after that, you're playing with house money.
Negotiation context
- It's been on market 44 days — a 3% lower offer ($43k) is reasonable based on typical stale-listing flexibility.
Risks & watch-outs
- Climate carrying-cost: major flood risk; moderate wildfire risk; extreme-heat days projected 9→26/yr by 2055 (HVAC capex compounding) — expect insurance premiums to compound above CPI over the hold.
Questions for the listing agent
- It's been on market 44 days. Have you received any prior offers? Is the seller open to a 3% concession, seller financing, or rate buy-down credit?
- Is there a deadline driving the sale (1031 exchange, divorce, estate, relocation)? That informs how much negotiation room exists.
- What's the average days-on-market for RENTAL listings here right now (not sales)? A rising rental-DOM trend means longer vacancies and softer asking-rent achievability than the comps imply.
- What's the recent tenant-quality profile in this submarket — average credit score on applications, eviction rate, late-payment / NSF rate, and stable-employment percentage? A property-management company in the area should have these aggregated.
- How much new for-sale + rental construction is in the pipeline within 1–3 miles? Heavy new supply typically softens prices + rents 12–24 months out; constrained supply supports both.
Investment metrics
- 1% rule
- 3.52% ✓
- Cap rate
- 31.41%
- Cash-on-cash
- 89.69%
- DSCR
- 4.99
- GRM
- 2.4
CMA / ARV
No comps found within radius.
Projected returns pro-forma
-3.0% appreciation · 3.0% rent growth · sell at horizon
- IRR
- 90.4%
- Equity multiple
- 5.18×
- Total profit
- $51,544
- Equity at exit
- $6,561
- IRR
- 93.3%
- Equity multiple
- 10.78×
- Total profit
- $120,500
- Equity at exit
- $3,804
Cash invested: $12,320 (down + closing). Projections, not guarantees.
Landlord ↔ Tenant lean methodology
- Overall (STATE)
- 18 Strongly Tenant-Friendly
- State California
- 18 Strongly Tenant-Friendly · D+13
- County
- — inherits STATE
- City
- — inherits STATE
ZIP-level market 92036
- Active inventory
- 127
- Price-to-rent
- 2.4×
Monthly cashflow live
- Estimated rent
- $1,551 medium interval (Pro) →
- Mortgage (P&I)
- −$231
- Tax est. 1.5%
- −$55 /mo · $660/yr
- Insurance
- −$18
- HOA
- −$0
- Vacancy / Maint / Mgmt
- −$326
- Net cashflow
- $921
Break-even live
UW: 25.0% down · 7.5% · 30yr · 1.5% tax · 5.0% vac · 8.0% maint · 8.0% mgmt
Financing live
Cash to close
- Down payment
- $11,000
- Closing costs
- $1,320
- Reserves months
- —
- Total cash needed
- —
Loan-product check · same deal, 3 products live
Conventional
25% down · 7.5% · 30yr
- Down + closing
- —
- Monthly P&I
- —
- Monthly cashflow
- —
- DSCR
- —
- Eligible?
- —
Personal DTI + credit; lowest rate.
DSCR
20% down · 8.5% · 30yr
- Down + closing
- —
- Monthly P&I
- —
- Monthly cashflow
- —
- DSCR
- —
- Eligible?
- —
No personal income docs; deal must DSCR.
Hard money
10% down · 12.0% · 12mo
- Down + closing
- —
- Monthly P&I
- —
- Monthly cashflow
- —
- DSCR
- —
- Eligible?
- —
Short-term bridge; refi at stabilization.
Listing history 17 events
-
2026-06-18days on market $44,000 Active 44 DOM
-
2026-06-17days on market $44,000 Active 43 DOM
-
2026-06-16days on market $44,000 Active 42 DOM
-
2026-06-15days on market $44,000 Active 41 DOM
-
2026-06-13days on market $44,000 Active 39 DOM
-
2026-06-13days on market $44,000 Active 38 DOM
-
2026-06-10remarks 562-char remark
-
2026-06-09days on market $44,000 Active 35 DOM
-
2026-06-08days on market $44,000 Active 34 DOM
-
2026-06-07days on market $44,000 Active 33 DOM
-
2026-06-04days on market $44,000 Active 30 DOM
-
2026-06-03days on market $44,000 Active 29 DOM
-
2026-06-02days on market $44,000 Active 28 DOM
-
2026-06-02price $44,000 Active 27 DOM
-
2026-06-01days on market $50,000 Active 27 DOM
-
2026-05-31days on market $50,000 Active 26 DOM
-
2026-05-04$50,000 Active
ⓘ Source: listings_history table (triggers on properties + properties_extension) + one-shot
backfill from property_details.listing_events for pre-trigger history.
Climate risk First Street
- Flood 6/10 Major FEMA zone D · 74% chance over 30 yrs
- Wildfire 5/10 Major
- Heat 8/10 Severe 9 d/yr ≥102°F today · 26 d/yr by 30 yrs out
- Wind 1/10 Low
- Air quality 3/10 Moderate 4 unhealthy d/yr today · 4 by 30 yrs out
Nearby sold comps map
Loading sold comps map…
Walkable amenities ~0.75 mi
Loading nearby amenities…
Taxation est. · year 1
- Rental income
- $18,607
- − Mortgage interest
- −$2,465
- − Property taxes
- −$660
- − Insurance
- −$220
- − Repairs & maintenance
- −$1,489
- − Management
- −$1,489
- − Depreciation
- −$1,280
- Taxable income
- $11,005
- Est. tax owed @ 24.0%
- −$2,641
- After-tax cash flow
- $8,409/yr
For passive investors: Depreciation is non-cash, so a rental often shows a tax loss while cash-flowing — sheltering income. Rental losses are passive: they offset passive income freely, and up to $25,000/yr can offset ordinary (W-2) income if you actively participate and your MAGI is under $100k (phasing out to $0 by $150k); unused losses carry forward. On sale, claimed depreciation is recaptured at up to 25%, and gains may owe capital-gains tax (a 1031 exchange can defer both). Figures are a year-1 estimate at your 24.0% rate — not tax advice; consult a CPA.
Condition & rehab AI · 6 photos
This remodeled manufactured home in a family-friendly community offers a good condition with minimal repairs needed. Upgrades in landscaping, HVAC, and small outdoor spaces can significantly enhance its value.
Value-add opportunities
- Both Landscaping and curb appeal improvements — Enhances the property's curb appeal and can attract more buyers or renters
- Both Upgrading the HVAC system — Improves comfort and energy efficiency, attracting more buyers and renters
- Both Adding a small front porch or patio — Increases the living space and can be used for entertaining, enhancing both resale and rental value
Renovation cost estimate screening
Value-add ROI direction
- Both Landscaping and curb appeal improvements — Enhances the property's curb appeal and can attract more buyers or renters ↑
- Both Upgrading the HVAC system — Improves comfort and energy efficiency, attracting more buyers and renters ↑
- Both Adding a small front porch or patio — Increases the living space and can be used for entertaining, enhancing both resale and rental value ↑
ⓘ Cost ranges are severity-bucket heuristics (US national rule-of-thumb). Get contractor quotes + a written scope before underwriting a rehab budget.
Schools (NCES district)
- District
- Julian Union Elementary
- NCES district ID
- 0619140
- Math proficiency
- 35% ▲ 5.00%
- Reading proficiency
- 39% ▲ 4.00%
- Median HH income
- $55,445
- Composite
- 35.07/100
- National rank
- #9915
- State rank
- #791 of 1400 in CA
Livability — Julian
- Score
- 58/100
- State rank
- #684
- US rank
- #20868
Category grades
Schools grade is shown separately in the Schools card above.
Census & demographics
- Population (ZIP)
- 3,128
Population outlook (San Diego County) Hauer SSP2
- Today (2025)
- 3,678,185 people
- By 2030
- 3,856,546 · +4.8%
- By 2040
- 4,171,407 · +13.4%
- By 2050
- 4,421,607 · +20.2%
- By 2075
- 4,831,599 · +31.4%
- By 2100
- 4,832,502 · +31.4%
Race, ethnicity, and origin ACS 2023
- Neighborhood character
- Predominantly White (79%)
- Race & ethnicity
- White 79% Hispanic / Latino 18% Two or more races 13% Black 1%
- Hispanic origin (detail)
- Mexican 16%
- Common ancestry
- Lithuanian 5% Slovak 4% Iranian 3%
- Foreign-born
- 7% · Canada
- Languages at home
- 93% English-only · Spanish 5% Other Indo-European 1% French/Haitian/Cajun 1%
Political lean MEDSL · San Diego
- 2024 margin
- D (+16.8) · D 56.9% · R 40.1% · Other 2.9%
- 2008→2024 swing
- +6.6pp toward D · 2008: 10.2pp · 2024: 16.8pp
- All cycles
- 2024: D+16.8 2020: D+22.8 2016: D+17.8 2012: D+5.1 2008: D+10.2
Not yet ingested
- Civics
- —
Market trends
- HPI YoY
- ▼ -161.21%
- Current HPI
- 279.7035
- Rent YoY
- —
- Metro
- —
- State GDP YoY
- ▲ 3.21%
- F500 in state
- 116
Industry mix (Fortune 500 HQ in CA)
| Industry | F500 HQs | Revenue |
|---|---|---|
| Technology | 27 | $1,492B |
|
||
| Financial Services | 3 | $174B |
|
||
| Retail | 3 | $44B |
|
||
| Insurance | 3 | $26B |
|
||
| Media / Entertainment | 2 | $115B |
|
||
| Pharmaceuticals / Biotech | 2 | $62B |
|
||
Price history
1 event — show timeline
- 2026-05-04 Listed $50,000 CRMLS
Cash-flow waterfall
monthlySold comps — $/sqft
last 12 mo · ≤1 miLoading sold comps…