619 University Ln · Cheshire, OH
Flood risk 1/10 · Minimal
- FEMA flood zone
- X (unshaded)
- Chance of flooding over 30 yrs
- 0.0%
- Est. flood insurance / yr
- $473 – $860
Fire risk 4/10 · Minor
- Est. fire insurance / yr
- $787 – $1,461
Heat risk 4/10 · Minor
- Hot days now (above 101°F)
- 7 days/yr
- Hot days in 30 yrs
- 18 days/yr
Wind risk 2/10 · Minimal
- Chance of severe wind over 30 yrs
- 1.0%
Air-quality risk 1/10 · Minimal
- Unhealthy air days now
- 0 days/yr
- Unhealthy air days in 30 yrs
- 0 days/yr
Risk factors via First Street. Map © Google.
Why this score? — see what drove the C- grade
The composite is a weighted blend of 9 inputs, each scored 0–100. Each bar is that input's sub-score; the figure is the points it added to the 100-point composite (weight × sub-score).
- Cash flow +18.2/30.0
- Appreciation +10.0/10.0
- ARV discount +6.8/15.0
- DSCR +5.7/10.0
- 1% rule +3.6/10.0
- Livability +3.0/5.0
- Rent growth +2.5/5.0
- Condition / age +2.5/5.0
- Schools +2.2/10.0
$199,000
🖨 Deal sheet 📄 Offer letter ✓ Due diligence
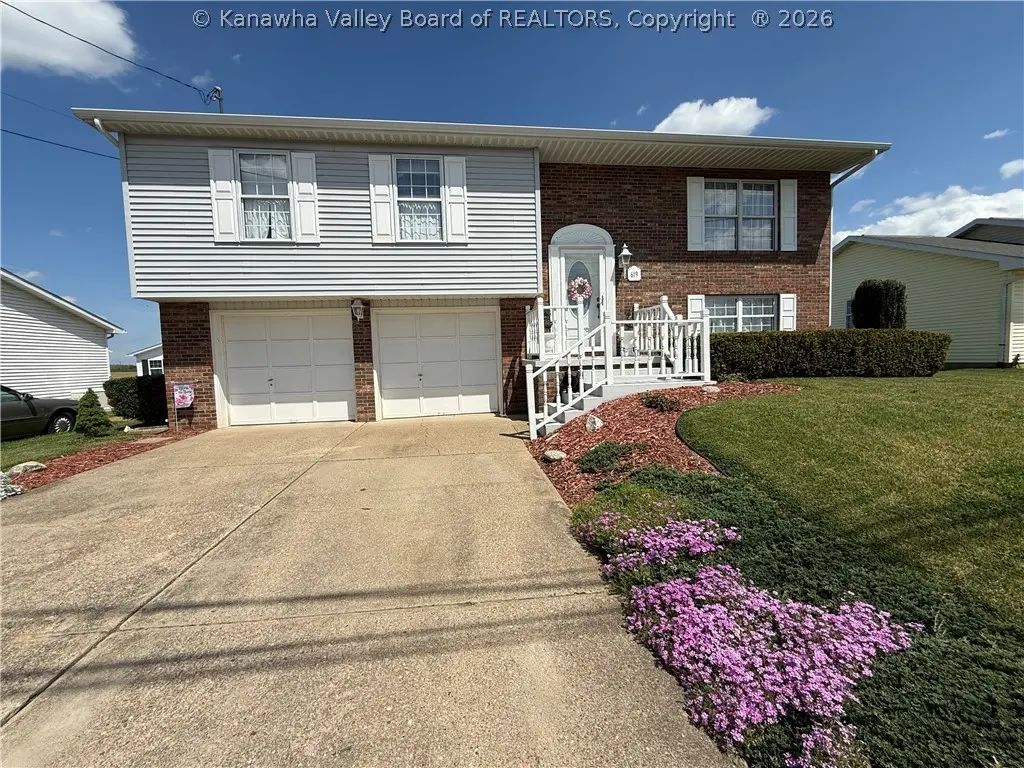
Listing remarks
Beautifully maintained, neat, and move-in ready home offering comfort and flexibility throughout. The main floor features 3 bedrooms, including a primary suite with its own full ensuite bath. Enjoy outdoor living with a deck off the main level overlooking the yard and a covered patio below—perfect for relaxing or entertaining. The lower level provides two additional versatile rooms ideal for a home office, gym, or guest space, along with a half bath and laundry area. Recent updates include a new heat pump (2021) and roof (2018), adding peace of mind for the next owner. Situated on a large, flat, fenced yard, this property also includes a 2-car attached garage and plenty of space for o
Key facts
- Versatile rooms
- Covered patio
- Deck off main level
Tags
Property features AI
Finance
- Other: Taxes: $570 annual
Exterior
- Parking: Attached garage; Garage in basement; 2 garage spaces
- Security: Smoke detectors
- Utilities: Public water; Public sewer; Cable available
- Home design: Single family residence; Residential property; Subdivision: MEADOWLAND EST
- Construction: Brick and vinyl siding exterior; Composition shingle roof
- Exterior features: Deck; Patio; Fenced yard
Interior
- Kitchen: Dishwasher; Electric range; Refrigerator
- Flooring: Carpet; Laminate
- Bathrooms: 2 full bathrooms; 1 half bathroom
- Heating & cooling: Heat pump heating; Heat pump cooling
- Interior features: Insulated windows; Full basement with sump pump
Neighborhood map
What this means for you Summary
Snapshot
- This is a 3-bed/2.5-bath single-family listed at $199k.
Deal economics
- At list price, monthly cash flow is $177 ($2k/yr) — positive.
- The deal already cash-flows at list — no discount required.
- To meet the 1% rule (rent ≥ 1% of price), the offer needs to be $171k (14.1% below list).
- Recommended offer: $171k (14.1% below list) — sets the bar for 1% rule.
Location & tenants
- Location reads 60/100 on livability (#980 in OH) — a middle-class / working-renter tenant base. Strengths: cost of living A+; Watch: health & safety C-, crime D+, amenities F.
- Mason County Schools (town): math 20% / reading 33% proficiency, ranked #44 of 55 in WV (top 80%) — low school quality limits family demand, transient renter base, plan for 1-2y turnover.
- Zoned schools: Pt. Pleasant Primary (351 students, 0% FRL); Point Pleasant Junior/Senior High School (math 13% / reading 35%, grade F, #95 of 110 statewide, top 86%, 1,107 students, 0% FRL) — zoned schools average 0% FRL vs 47% district-wide (47 pts lower); this property's tenant base skews higher-income than the district average.
- Market conditions: 3 units permitted in Mason County in 2024 (0 in 5+ unit buildings).
- This rent runs 41% of the median local income ($50k/yr) — at the standard rent-burdened threshold; future hikes will face affordability resistance.
Forward outlook
- In year one you build about $21k of equity ($1k loan paydown + $20k appreciation (10.0% local appreciation)).
- Mason County population projected at -14% by 2050 — secular population decline; favor cash flow + early exit over multi-decade hold.
- At projected returns (10.0% appreciation + 3.0% rent growth), your $56k cash investment doubles in ~3 years — after that, you're playing with house money.
- By year 2, paydown + projected appreciation supports a ~$34k cash-out refi (75% LTV) — recoverable capital for the next deal without selling this one.
Negotiation context
- It's been on market 47 days — a 3% lower offer ($193k) is reasonable based on typical stale-listing flexibility.
- Current owner paid $69k; list at $199k implies a 189% gain — meaningful room to come down on a strong offer.
Questions for the listing agent
- It's been on market 47 days. Have you received any prior offers? Is the seller open to a 14% concession, seller financing, or rate buy-down credit?
- Is there a deadline driving the sale (1031 exchange, divorce, estate, relocation)? That informs how much negotiation room exists.
- Crime grade is D in this area — have there been break-ins, vandalism, or insurance claims at this property in the last 3 years? What carrier currently insures it and at what premium?
- What's the average days-on-market for RENTAL listings here right now (not sales)? A rising rental-DOM trend means longer vacancies and softer asking-rent achievability than the comps imply.
- What's the recent tenant-quality profile in this submarket — average credit score on applications, eviction rate, late-payment / NSF rate, and stable-employment percentage? A property-management company in the area should have these aggregated.
- How much new for-sale + rental construction is in the pipeline within 1–3 miles? Heavy new supply typically softens prices + rents 12–24 months out; constrained supply supports both.
Investment metrics
- 1% rule
- 0.86% ✗
- Cap rate
- 7.36%
- Cash-on-cash
- 3.81%
- DSCR
- 1.17
- GRM
- 9.7
CMA / ARV
- ARV (median comp)
- $195,816
- List price
- $199,000
- Delta
- 1.63%
- Verdict
- FAIR
- Comps
- 8 within 1.0 mi
Show comp detail 2 sales within ~0.75 mi
| Address | Dist | Beds/Ba | Sqft | Sold | Price | $/sf | Match |
|---|---|---|---|---|---|---|---|
| 343 Hawthorne Ln | 0.10mi | 3/2.0 | 1,474 (-12%) | 0mo | $353,760 | $240 | 73 |
| 585 Camp Conley Rd | 0.45mi | 3/2.0 | 1,493 (-11%) | 24mo | $262,370 | $176 | 39 |
Match score weights: distance 35% · size 25% · config 20% · recency 20%. Top-matched comps best support the ARV.
Projected returns pro-forma
10.0% appreciation · 3.0% rent growth · sell at horizon
- IRR
- 27.0%
- Equity multiple
- 3.15×
- Total profit
- $119,560
- Equity at exit
- $179,275
- IRR
- 23.6%
- Equity multiple
- 7.16×
- Total profit
- $343,022
- Equity at exit
- $386,613
Cash invested: $55,720 (down + closing). Projections, not guarantees.
Landlord ↔ Tenant lean methodology
- Overall (STATE)
- 73 Landlord-Friendly
- State Ohio
- 73 Landlord-Friendly · R+6
- County
- — inherits STATE
- City
- — inherits STATE
ZIP-level market 25550
- Home prices YoY
- 6.7%
- Price-to-rent
- 9.7×
Monthly cashflow live
- Estimated rent
- $1,710 medium interval (Pro) →
- Mortgage (P&I)
- −$1,044
- Tax from tax record
- −$48 /mo · $570/yr
- Insurance
- −$83
- HOA
- −$0
- Vacancy / Maint / Mgmt
- −$359
- Net cashflow
- $177
Break-even live
UW: 25.0% down · 7.5% · 30yr · 1.5% tax · 5.0% vac · 8.0% maint · 8.0% mgmt
Financing live
Cash to close
- Down payment
- $49,750
- Closing costs
- $5,970
- Reserves months
- —
- Total cash needed
- —
Loan-product check · same deal, 3 products live
Conventional
25% down · 7.5% · 30yr
- Down + closing
- —
- Monthly P&I
- —
- Monthly cashflow
- —
- DSCR
- —
- Eligible?
- —
Personal DTI + credit; lowest rate.
DSCR
20% down · 8.5% · 30yr
- Down + closing
- —
- Monthly P&I
- —
- Monthly cashflow
- —
- DSCR
- —
- Eligible?
- —
No personal income docs; deal must DSCR.
Hard money
10% down · 12.0% · 12mo
- Down + closing
- —
- Monthly P&I
- —
- Monthly cashflow
- —
- DSCR
- —
- Eligible?
- —
Short-term bridge; refi at stabilization.
Listing history 12 events
-
2026-06-09statusdays on market $199,000 Pending 47 DOM
-
2026-06-08days on market $199,000 Active 46 DOM
-
2026-06-07days on market $199,000 Active 45 DOM
-
2026-06-05days on market $199,000 Active 42 DOM
-
2026-06-03days on market $199,000 Active 41 DOM
-
2026-06-02days on market $199,000 Active 40 DOM
-
2026-06-01days on market $199,000 Active 39 DOM
-
2026-05-31days on market $199,000 Active 38 DOM
-
2026-05-30days on market $199,000 Active 37 DOM
-
2026-05-06price $199,000 767-char remark
-
2026-04-23$219,000 Active 767-char remark
-
1988-05-25soldstatus $68,900
ⓘ Source: listings_history table (triggers on properties + properties_extension) + one-shot
backfill from property_details.listing_events for pre-trigger history.
Tax reassessment forecast OH · Partial reset (capped growth)
- Current annual tax
- $570 · $48/mo
- Projected year-2 tax
- $1,837 · $153/mo
- Expected delta
- +$1,267/yr (+$106/mo · 222.1%)
ⓘ Screening estimate from a state-policy table — verify with the county assessor before closing.
Climate risk First Street
- Flood 1/10 Low FEMA zone X (unshaded) · 0% chance over 30 yrs
- Wildfire 4/10 Moderate
- Heat 4/10 Moderate 7 d/yr ≥101°F today · 18 d/yr by 30 yrs out
- Wind 2/10 Low 100% chance of damaging wind over 30 yrs
- Air quality 1/10 Low 0 unhealthy d/yr today · 0 by 30 yrs out
Nearby sold comps map
Loading sold comps map…
Walkable amenities ~0.75 mi
Loading nearby amenities…
Taxation est. · year 1
- Rental income
- $20,523
- − Mortgage interest
- −$11,147
- − Property taxes
- −$570
- − Insurance
- −$995
- − Repairs & maintenance
- −$1,642
- − Management
- −$1,642
- − Depreciation
- −$5,789
- Taxable loss
- −$1,262
- Est. tax savings @ 24.0%
- +$303
- After-tax cash flow
- $2,428/yr
For passive investors: Depreciation is non-cash, so a rental often shows a tax loss while cash-flowing — sheltering income. Rental losses are passive: they offset passive income freely, and up to $25,000/yr can offset ordinary (W-2) income if you actively participate and your MAGI is under $100k (phasing out to $0 by $150k); unused losses carry forward. On sale, claimed depreciation is recaptured at up to 25%, and gains may owe capital-gains tax (a 1031 exchange can defer both). Figures are a year-1 estimate at your 24.0% rate — not tax advice; consult a CPA.
Schools (NCES district)
- District
- Mason County Schools
- NCES district ID
- 5400780
- Math proficiency
- 20% ▼ -13.00%
- Reading proficiency
- 33% ▼ -10.00%
- Median HH income
- $37,623
- Composite
- 22.07/100
- National rank
- #8191
- State rank
- #44 of 55 in WV
Livability — Cheshire
- Score
- 60/100
- State rank
- #980
- US rank
- #19084
Category grades
Schools grade is shown separately in the Schools card above.
Census & demographics
- County
- Mason
- Population (ZIP)
- 8,925
- Household income
- $49,940
- Rent vs Own
- Severe rent burden
- 10.6
Population outlook (Mason County) Hauer SSP2
- Today (2025)
- 26,174 people
- By 2030
- 25,482 · -2.6%
- By 2040
- 23,934 · -8.6%
- By 2050
- 22,432 · -14.3%
- By 2075
- 19,241 · -26.5%
- By 2100
- 15,427 · -41.1%
Race, ethnicity, and origin ACS 2023
- Neighborhood character
- Predominantly White (95%)
- Race & ethnicity
- White 95% Two or more races 2% Hispanic / Latino 2% Black 2%
- Common ancestry
- Slovak 1% Serbian 1% Lithuanian 1%
- Foreign-born
- 0%
Political lean MEDSL · Mason
- 2024 margin
- Solid R (+58.0) · D 20.0% · R 78.0% · Other 1.9%
- 2008→2024 swing
- -45.1pp toward R · 2008: -12.9pp · 2024: -58.0pp
- All cycles
- 2024: R+58.0 2020: R+53.2 2016: R+54.7 2012: R+20.3 2008: R+12.9
Not yet ingested
- Civics
- —
Market trends
- HPI YoY
- ▲ 11.63%
- Current HPI
- 185.6226
- Rent YoY
- —
- Metro
- —
- State GDP YoY
- ▲ 1.98%
- F500 in state
- 48
Industry mix (Fortune 500 HQ in OH)
| Industry | F500 HQs | Revenue |
|---|---|---|
| Insurance | 3 | $145B |
|
||
| Industrial Machinery | 3 | $49B |
|
||
| Financial Services | 3 | $24B |
|
||
| Consumer Goods | 2 | $93B |
|
||
| Aerospace / Defense | 2 | $47B |
|
||
| Utilities | 2 | $33B |
|
||
Price history
+188.8% since first listed4 events — show timeline
- 2026-06-09 Pending — KVBOR
- 2026-05-06 Price Changed $199,000 KVBOR
- 2026-04-23 Listed $219,000 KVBOR
- 1988-05-25 Sold (Public Records) $68,900 Public Records
Property tax history
+5.0%/yrLatest (2025): $570 · +30.3% YoY. Source: county tax records.
Cash-flow waterfall
monthlySold comps — $/sqft
last 12 mo · ≤1 miLoading sold comps…