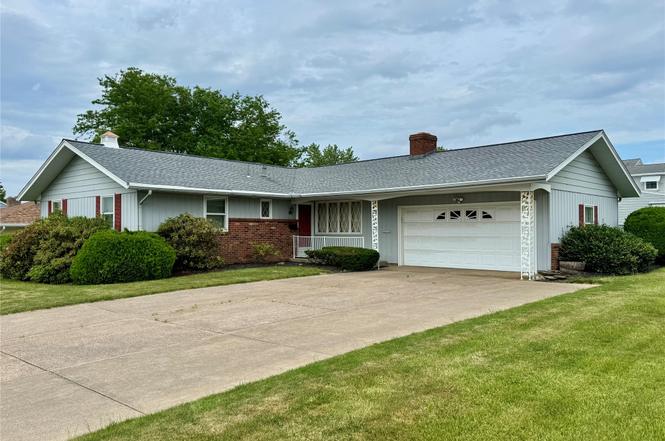
3651 Delmar Dr · Millcreek, PA
Flood risk 1/10 · Minimal
- FEMA flood zone
- X (unshaded)
- Chance of flooding over 30 yrs
- 0.0%
- Est. flood insurance / yr
- $473 – $860
Fire risk 1/10 · Minimal
- Est. fire insurance / yr
- $511 – $949
Heat risk 2/10 · Minimal
- Hot days now (above 90°F)
- 7 days/yr
- Hot days in 30 yrs
- 17 days/yr
Wind risk 1/10 · Minimal
- Chance of severe wind over 30 yrs
- —
Air-quality risk 2/10 · Minimal
- Unhealthy air days now
- 1 days/yr
- Unhealthy air days in 30 yrs
- 3 days/yr
Risk factors via First Street. Map © Google.
Why this score? — see what drove the D+ grade
The composite is a weighted blend of 9 inputs, each scored 0–100. Each bar is that input's sub-score; the figure is the points it added to the 100-point composite (weight × sub-score).
- Cash flow +13.8/30.0
- ARV discount +11.1/15.0
- Schools +4.8/10.0
- DSCR +4.2/10.0
- 1% rule +4.0/10.0
- Rent growth +2.5/5.0
- Livability +2.5/5.0
- Condition / age +2.5/5.0
- Appreciation +0.0/10.0
$259,000
🖨 Deal sheet (PDF) 📄 Offer letter ✓ Due diligence
Listing remarks
Welcome to this spacious 3-bedroom, 1.5-bath ranch located in the desirable Brentwood Hills subdivision. This home features an open kitchen with quartz countertops, a large center island, and great flow into the living and dining areas. Enjoy a cozy family room with a wood-burning fireplace, plus a large living room perfect for entertaining. A bright sunroom overlooks the fenced-in yard, offering additional year-round living space. The property also includes an oversized heated garage, ideal for vehicles, storage, or a workshop. Home is being sold as-is, providing a great opportunity to add your personal touch.
Key facts
- Quartz countertops
- Large center island
- Cozy family room
Tags
Property features AI
Exterior
- Parking: Attached 2-car garage
- Utilities: Public water; Public sewer
- Home design: Single-family residence; One level
- Construction: Aluminum siding and brick exterior
- Exterior features: Fenced yard; Landscaped corner lot; Paved road access; Asphalt roof
Interior
- Kitchen: Dishwasher; Electric oven; Electric range; Microwave; Refrigerator
- Flooring: Carpet
- Bathrooms: 1 full bathroom; 1 half bathroom
- Heating & cooling: Forced air heating; Central air conditioning
- Interior features: Wood-burning fireplace (1); Full basement
- Laundry & utility: Washer; Dryer
Neighborhood map
What this means for you Summary
Snapshot
- This is a 3-bed/1.5-bath single-family listed at $259k.
Deal economics
- At list price, monthly cash flow is $23 ($278/yr) — positive.
- The deal already cash-flows at list — no discount required.
- To meet the 1% rule (rent ≥ 1% of price), the offer needs to be $232k (10.4% below list).
- Recommended offer: $232k (10.4% below list) — sets the bar for 1% rule.
Location & tenants
- Location reads: area grade D — affects rentability + tenant quality, not the cash-flow math above.
- Millcreek Township SD (suburban): math 46% / reading 65% proficiency, ranked #105 of 539 in PA (top 20%) — acceptable for families but not a draw, mixed tenant base, ~2y average lease.
- Zoned schools: Grandview El Sch (math 55% / reading 69%, grade B, #313 of 1,518 statewide, top 24%, 659 students, 46% FRL); Walnut Creek Ms (math 43% / reading 72%, grade B, #61 of 512 statewide, top 13%, 449 students, 31% FRL); Mcdowell Hs (math 76% / reading 50%, grade B-, #72 of 437 statewide, top 16%, 2,205 students, 40% FRL).
- Market conditions: 99 active listings in the ZIP; 5 comparable units currently listed for rent nearby; rentals lingering (median 46d on market — plan ~5-8 weeks vacancy on turnover, expect pricing pressure); 100% of comp listings sitting > 30 days — soft ceiling on asking rent; solid renter incomes; 364 units permitted in Erie County in 2024 (188 in 5+ unit buildings).
- This rent runs 34% of the median local income ($81k/yr) — at the standard rent-burdened threshold; future hikes will face affordability resistance.
Forward outlook
- Local home prices are declining (-3.0%/yr); year-one equity from $2k of loan paydown is wiped out by about $8k of value loss. Plan a longer hold.
- Erie County population projected at -14% by 2050 — secular population decline; favor cash flow + early exit over multi-decade hold.
Negotiation context
- Only 11 days on market — expect competitive offers; lowballing is unlikely to land.
- Current owner paid $160k; list at $259k implies a 62% gain — meaningful room to come down on a strong offer.
Questions for the listing agent
- Built in 1967 — when were the roof, HVAC, electrical panel, plumbing, and water heater last replaced?
- Is there a deadline driving the sale (1031 exchange, divorce, estate, relocation)? That informs how much negotiation room exists.
- The area grade is low — what's the realistic commute time and amenity access for the typical tenant pool here? Any planned neighborhood developments (good or bad) we should know about?
- What's the average days-on-market for RENTAL listings here right now (not sales)? A rising rental-DOM trend means longer vacancies and softer asking-rent achievability than the comps imply.
- What's the recent tenant-quality profile in this submarket — average credit score on applications, eviction rate, late-payment / NSF rate, and stable-employment percentage? A property-management company in the area should have these aggregated.
- How much new for-sale + rental construction is in the pipeline within 1–3 miles? Heavy new supply typically softens prices + rents 12–24 months out; constrained supply supports both.
Investment metrics
- 1% rule
- 0.90% ✗
- Cap rate
- 6.40%
- Cash-on-cash
- 0.38%
- DSCR
- 1.02
- GRM
- 9.3
CMA / ARV
- ARV (on-the-fly)
- $281,232
- Comps found
- 12
Show comp detail 12 sales within ~0.75 mi
| Address | Dist | Beds/Ba | Sqft | Sold | Price | $/sf | Match |
|---|---|---|---|---|---|---|---|
| 3031 W 38th St | 0.60mi | 3/1.5 | 1,560 (+3%) | 0mo | $290,000 | $186 | 67 |
| 2902 Marcella Dr | 0.46mi | 3/1.5 | 1,608 (+6%) | 4mo | $220,000 | $137 | 65 |
| 3515 Pacific Ave | 0.32mi | 3/1.5 | 1,333 (-12%) | 1mo | $240,000 | $180 | 65 |
| 2324 W 32nd St | 0.46mi | 3/1.0 | 1,396 (-8%) | 0mo | $225,000 | $161 | 63 |
| 2116 W 34 St | 0.64mi | 3/1.5 | 1,464 (-3%) | 3mo | $319,900 | $219 | 62 |
| 3003 Harvest Bnd | 0.63mi | 3/1.5 | 1,436 (-5%) | 3mo | $287,900 | $200 | 59 |
| 4218 Amherst Rd | 0.72mi | 3/1.5 | 1,440 (-5%) | 0mo | $380,000 | $264 | 58 |
| 3910 Calico Dr | 0.35mi | 3/2.0 | 1,706 (+13%) | 5mo | $265,900 | $156 | 57 |
| 2845 W 31st St | 0.52mi | 3/2.0 | 1,304 (-14%) | 1mo | $219,900 | $169 | 50 |
| 2925 Harvest Bnd | 0.59mi | 3/1.5 | 1,356 (-10%) | 7mo | $275,000 | $203 | 49 |
| 2829 Feasler Ave | 0.61mi | 3/1.0 | 1,344 (-11%) | 2mo | $153,000 | $114 | 49 |
| 3118 Greeley Ave | 0.75mi | 4/2.0 (+1) | 1,298 (-14%) | 4mo | $285,000 | $220 | 31 |
Match score weights: distance 35% · size 25% · config 20% · recency 20%. Top-matched comps best support the ARV.
Projected returns pro-forma
-3.0% appreciation · 3.0% rent growth · sell at horizon
- IRR
- -15.7%
- Equity multiple
- 0.44×
- Total profit
- $-40,449
- Equity at exit
- $38,618
- IRR
- -7.2%
- Equity multiple
- 0.54×
- Total profit
- $-33,133
- Equity at exit
- $22,394
Cash invested: $72,520 (down + closing). Projections, not guarantees.
Landlord ↔ Tenant lean methodology
- Overall (STATE)
- 62 Landlord-Friendly
- State Pennsylvania
- 62 Landlord-Friendly · EVEN
- County
- — inherits STATE
- City
- — inherits STATE
ZIP-level market 16506
- Active inventory
- 99
- Price-to-rent
- 9.3×
Monthly cashflow live
- Estimated rent
- $2,320 high interval (Pro) →
- Mortgage (P&I)
- −$1,358
- Tax from tax record
- −$344 /mo · $4,125/yr
- Insurance
- −$108
- HOA
- −$0
- Vacancy / Maint / Mgmt
- −$487
- Net cashflow
- $23
Break-even live
Sensitivity live
| Price | -10% $170 | -5% $96 | +0% $23 | +5% $-50 | +10% $-123 |
|---|---|---|---|---|---|
| Rent | -10% $-160 | -5% $-69 | +0% $23 | +5% $115 | +10% $206 |
| Rate | -1.0pp $154 | -0.5pp $89 | base $23 | +0.5pp $-44 | +1.0pp $-112 |
UW: 25.0% down · 7.5% · 30yr · 1.5% tax · 5.0% vac · 8.0% maint · 8.0% mgmt
Financing live
Cash to close
- Down payment
- $64,750
- Closing costs
- $7,770
- Reserves months
- —
- Total cash needed
- —
Loan-product check · same deal, 3 products live
Conventional
25% down · 7.5% · 30yr
- Down + closing
- —
- Monthly P&I
- —
- Monthly cashflow
- —
- DSCR
- —
- Eligible?
- —
Personal DTI + credit; lowest rate.
DSCR
20% down · 8.5% · 30yr
- Down + closing
- —
- Monthly P&I
- —
- Monthly cashflow
- —
- DSCR
- —
- Eligible?
- —
No personal income docs; deal must DSCR.
Hard money
10% down · 12.0% · 12mo
- Down + closing
- —
- Monthly P&I
- —
- Monthly cashflow
- —
- DSCR
- —
- Eligible?
- —
Short-term bridge; refi at stabilization.
Rent comps 5 comps
| Address | Beds | Baths | Sqft | Rent | $/sqft | DOM | Units | Dist |
|---|---|---|---|---|---|---|---|---|
| 2857 Willowood Dr Unit 2901 Erie, PA | 2.0 | 1.5 | 1300 | $1,750 | $1.35 | 45d | 1 | 0.32mi |
| 4500 Hammocks Dr Erie, PA | 2.0–3.0 | 2.0 | 1312 | $3,270 | $2.49 | 45d | 7 | 0.45mi |
| 4536 Hammocks Dr Unit 536404 Erie, PA | 3.0 | 2.0 | 1416 | $2,290 | $1.62 | 45d | 1 | 0.48mi |
| 4536 Hammocks Dr Unit 542401 Erie, PA | 2.0 | 2.0 | 1327 | $2,160 | $1.63 | 45d | 1 | 0.48mi |
| 4536 Hammocks Dr Unit 536204 Erie, PA | 3.0 | 2.0 | 1416 | $2,275 | $1.61 | 45d | 1 | 0.48mi |
Listing history 9 events
-
2026-06-21days on market $259,000 Active 11 DOM
-
2026-06-19days on market $259,000 Active 9 DOM
-
2026-06-18days on market $259,000 Active 8 DOM
-
2026-06-17days on market $259,000 Active 7 DOM
-
2026-06-16days on market $259,000 Active 6 DOM
-
2026-06-15days on market $259,000 Active 5 DOM
-
2026-06-14days on market $259,000 Active 3 DOM
-
2026-06-13remarks 618-char remark
-
2026-06-13$259,000 Active 2 DOM
ⓘ Source: listings_history table (triggers on properties + properties_extension) + one-shot
backfill from property_details.listing_events for pre-trigger history.
Tax reassessment forecast PA · Partial reset (capped growth)
- Current annual tax
- $4,125 · $344/mo
- Projected year-2 tax
- $4,125 · $344/mo
- Expected delta
- $0/yr ($0/mo · 0.0%)
ⓘ Screening estimate from a state-policy table — verify with the county assessor before closing.
Climate risk First Street
- Flood 1/10 Low FEMA zone X (unshaded) · 0% chance over 30 yrs
- Wildfire 1/10 Low
- Heat 2/10 Low 7 d/yr ≥90°F today · 17 d/yr by 30 yrs out
- Wind 1/10 Low
- Air quality 2/10 Low 1 unhealthy d/yr today · 3 by 30 yrs out
Nearby sold comps map
Loading sold comps map…
Walkable amenities ~0.75 mi
Loading nearby amenities…
Taxation est. · year 1
- Rental income
- $27,843
- − Mortgage interest
- −$14,508
- − Property taxes
- −$4,125
- − Insurance
- −$1,295
- − Repairs & maintenance
- −$2,227
- − Management
- −$2,227
- − Depreciation
- −$7,535
- Taxable loss
- −$4,074
- Est. tax savings @ 24.0%
- +$978
- After-tax cash flow
- $1,255/yr
For passive investors: Depreciation is non-cash, so a rental often shows a tax loss while cash-flowing — sheltering income. Rental losses are passive: they offset passive income freely, and up to $25,000/yr can offset ordinary (W-2) income if you actively participate and your MAGI is under $100k (phasing out to $0 by $150k); unused losses carry forward. On sale, claimed depreciation is recaptured at up to 25%, and gains may owe capital-gains tax (a 1031 exchange can defer both). Figures are a year-1 estimate at your 24.0% rate — not tax advice; consult a CPA.
Schools (NCES district)
- District
- Millcreek Township SD
- NCES district ID
- 4215330
- Math proficiency
- 46% ▼ -13.00%
- Reading proficiency
- 65% ▼ -9.00%
- Median HH income
- $55,734
- Composite
- 47.82/100
- National rank
- #2224
- State rank
- #105 of 539 in PA
Livability — Millcreek
No livability data for this city. (Only ~50 U.S. cities are tracked.)
Census & demographics
- County
- Erie County · 92,215 people
- City population
- 92,215
- Metro
- Erie, PA
- Population (ZIP)
- 24,070
- Household income
- $81,060
- Rent vs Own
- Severe rent burden
- 894.0
Population outlook (Erie County) Hauer SSP2
- Today (2025)
- 272,159 people
- By 2030
- 266,299 · -2.2%
- By 2040
- 250,987 · -7.8%
- By 2050
- 234,925 · -13.7%
- By 2075
- 199,164 · -26.8%
- By 2100
- 162,985 · -40.1%
Race, ethnicity, and origin ACS 2023
- Neighborhood character
- Predominantly White (88%)
- Race & ethnicity
- White 88% Two or more races 5% Asian 4% Black 2% Hispanic / Latino 2%
- Common ancestry
- Romanian 11% Italian 2% Lithuanian 1%
- Foreign-born
- 5% · Canada, China
- Languages at home
- 93% English-only · Other Indo-European 2% Spanish 1% Russian/Polish/Slavic 1%
Political lean MEDSL · Erie
- 2024 margin
- Toss-up / Even · D 49.0% · R 50.0%
- 2008→2024 swing
- -20.9pp toward R · 2008: 19.9pp · 2024: -1.0pp
- All cycles
- 2024: R+1.0 2020: D+1.0 2016: R+2.0 2012: D+16.9 2008: D+19.9
Not yet ingested
- Civics
- —
Market trends
- HPI YoY
- ▼ -152.21%
- Current HPI
- 228.7506
- Rent YoY
- —
- Metro
- Erie, PA
- State GDP YoY
- ▲ 1.68%
- F500 in state
- 34
Industry mix (Fortune 500 HQ in PA)
| Industry | F500 HQs | Revenue |
|---|---|---|
| Healthcare | 2 | $309B |
|
||
| Insurance | 2 | $27B |
|
||
| Telecommunications / Media | 1 | $124B |
|
||
| Industrial Distribution | 1 | $22B |
|
||
| Financial Services | 1 | $20B |
|
||
| Chemicals / Materials | 1 | $18B |
|
||
Price history
+97.7% since first listed3 events — show timeline
- 2026-06-10 Listed $259,000 GEBOR
- 2010-10-22 Sold (Public Records) $160,000 Public Records
- 1995-04-13 Sold (Public Records) $131,000 Public Records
Property tax history
+2.5%/yrLatest (2026): $4,125 · +3.6% YoY. Source: county tax records.
Cash-flow waterfall
monthlySold comps — $/sqft
last 12 mo · ≤1 miLoading sold comps…