 8-Plex
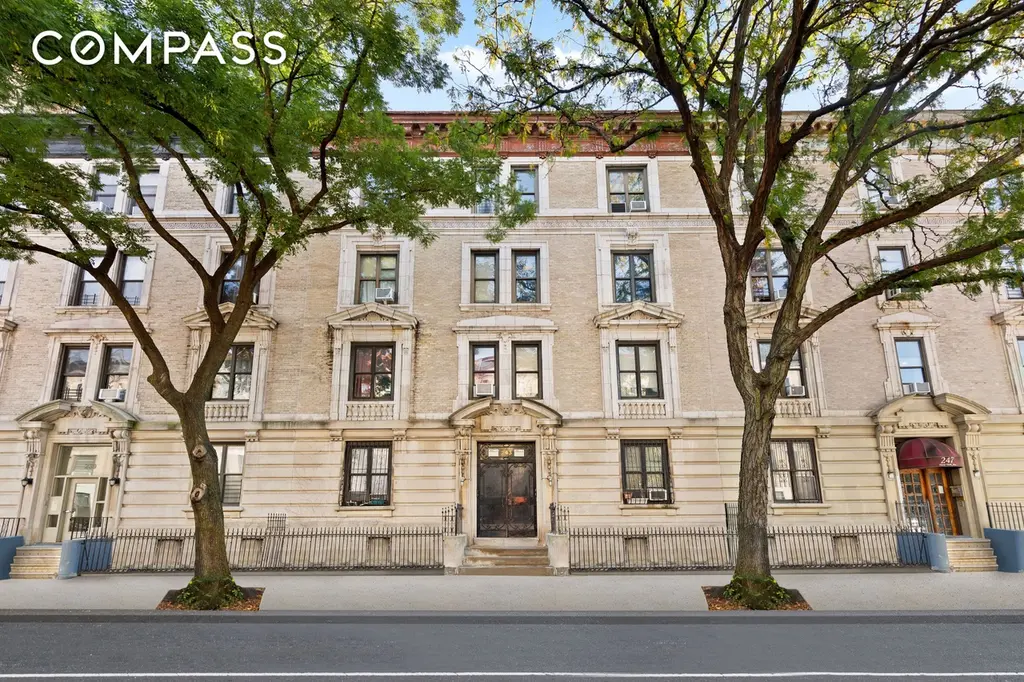
243 New York Ave · New York, NY
Flood risk 1/10 · Minimal
- FEMA flood zone
- X (unshaded)
- Chance of flooding over 30 yrs
- 0.0%
- Est. flood insurance / yr
- $507 – $1,088
Fire risk 1/10 · Minimal
- Est. fire insurance / yr
- $691 – $1,283
Heat risk 6/10 · Moderate
- Hot days now (above 99°F)
- 7 days/yr
- Hot days in 30 yrs
- 14 days/yr
Wind risk 6/10 · Moderate
- Chance of severe wind over 30 yrs
- 62.0%
Air-quality risk 5/10 · Moderate
- Unhealthy air days now
- 6 days/yr
- Unhealthy air days in 30 yrs
- 8 days/yr
Risk factors via First Street. Map © Google.
Why this score? — see what drove the C+ grade
The composite is a weighted blend of 9 inputs, each scored 0–100. Each bar is that input's sub-score; the figure is the points it added to the 100-point composite (weight × sub-score).
- Cash flow +19.1/30.0
- Appreciation +10.0/10.0
- ARV discount +7.5/15.0
- DSCR +6.0/10.0
- 1% rule +5.1/10.0
- Schools +5.0/10.0
- Rent growth +4.4/5.0
- Livability +3.8/5.0
- Condition / age +3.8/5.0
$3,750,000
🖨 Deal sheet 📄 Offer letter ✓ Due diligence
Multi-family units
County records classify this as Multi-Family (2-4 Unit). Listing-text estimate: 8 units. estimate disagrees with records
Listing remarks
243 New York Avenue is a beautiful, landmarked limestone building located in prime Crown Heights. Brimming with original detail, towering ceiling height, and wonderful light. At 40 feet wide and 80 feet deep, this 8 unit property offers exceptionally large unit layouts. Boasting 11,277sf, with an additional 2,800sf windowed basement --which could be utilized as recreational space. This property will be delivered with 6 vacancies, giving buyers the opportunity to shift layouts around to their liking. Ideal Crown Heights location, with wonderful amenities nearby, as well as express subway lines. Please inquire for an offering memorandum for more financial information. * Potential buyers are n
Key facts
- Windowed basement
- Recreational space
- Express subway lines
Tags
Property features AI
Finance
- Other: Building allows cats and dogs
- Financial info: Annual taxes listed
- HOA & community: HOA/association fees billed monthly
Exterior
- Home design: 4-story building; Entry level at street level
- Exterior features: Lot dimensions approximately 40 x 100
Interior
- Bedrooms: Building contains 8 units
- Bathrooms: 8 full bathrooms
- Interior features: Unfurnished; Total of 40 rooms in the building
- Laundry & utility: Laundry details available in remarks
Neighborhood map
What this means for you Summary
Snapshot
- This is a 8 × 2-bed/1.0-bath units multifamily listed at $3.75M. Condition is rated good.
Deal economics
- At list price, monthly cash flow is $4k ($47k/yr) — positive. Per door: $493/mo.
- The deal already cash-flows at list — no discount required.
- Meets the 1% rule at list price ($38k rent vs $3.75M).
- Recommended offer: $3.64M (3.0% below list) — sets the bar for market timing.
- Cap rate 7.6% vs local median 2.6% in New York — top-decile yield for the area; either an underpriced asset or a hidden risk that comps aren't pricing in. Stress-test before assuming the spread holds.
Location & tenants
- Location reads 75/100 on livability (#268 in NY, #4,188 nationally) — a middle-class / working-renter tenant base. Strengths: amenities A+, commute A+, health & safety A; Watch: crime F, cost of living F.
- Market conditions: Rents rising fast (+7.7%/yr); 120 active listings in the ZIP; solid renter incomes; 10,063 units permitted in Kings County in 2024 (9,789 in 5+ unit buildings).
- At $37,801/mo this rent would consume 448% of the median local household income ($101k/yr) (locally 4473% of renters already pay >50% of income on rent) — very limited rent-growth headroom before tenants either downsize or default.
Forward outlook
- In year one you build about $401k of equity ($26k loan paydown + $375k appreciation (10.0% local appreciation)).
- Kings County population projected at +13% by 2050 — modest demand growth; plan on rents tracking national, not racing it.
- At projected returns (10.0% appreciation + 7.7% rent growth), your $1.05M cash investment doubles in ~3 years — after that, you're playing with house money.
- By year 2, paydown + projected appreciation supports a ~$644k cash-out refi (75% LTV) — recoverable capital for the next deal without selling this one.
Negotiation context
- It's been on market 31 days — a 3% lower offer ($3.64M) is reasonable based on typical stale-listing flexibility.
- 5 sale attempts since 4y ago with the ask held roughly flat each time — persistent listings suggest the price (not the market) is what's stuck; bring a comps-based counter.
Risks & watch-outs
- Watch-outs: built in 1906 — expect roof / HVAC / electrical / plumbing capex.
- Climate carrying-cost: major wind risk, 62% chance of damaging wind over 30y; extreme-heat days projected 7→14/yr by 2055 (HVAC capex compounding) — expect insurance premiums to compound above CPI over the hold.
Questions for the listing agent
- It's been on market 31 days. Have you received any prior offers? Is the seller open to a 3% concession, seller financing, or rate buy-down credit?
- Can we see the unit-by-unit rent roll, current vacancy, and any below-market leases? What's the average tenancy length?
- What capital expenditures (roof, boiler, parking lot, exteriors) have been made in the last 5 years, and what's planned in the next 2?
- Built in 1906 — when were the roof, HVAC, electrical panel, plumbing, and water heater last replaced?
- Is there a deadline driving the sale (1031 exchange, divorce, estate, relocation)? That informs how much negotiation room exists.
- Schools are B-rated — typically a magnet for longer-tenancy family renters. What's the average tenant stay here, and is there a school-zone premium baked into asking?
- Crime grade is F in this area — have there been break-ins, vandalism, or insurance claims at this property in the last 3 years? What carrier currently insures it and at what premium?
- What's the average days-on-market for RENTAL listings here right now (not sales)? A rising rental-DOM trend means longer vacancies and softer asking-rent achievability than the comps imply.
- What's the recent tenant-quality profile in this submarket — average credit score on applications, eviction rate, late-payment / NSF rate, and stable-employment percentage? A property-management company in the area should have these aggregated.
- How much new apartment / multifamily construction is in the pipeline within 1–3 miles? Heavy new supply (>2% of stock underway) typically softens rents 12–24 months out; light construction supports rent growth.
Investment metrics
- 1% rule
- 1.01% ✓
- Cap rate
- 7.56%
- Cash-on-cash
- 4.51%
- DSCR
- 1.20
- GRM
- 8.3
CMA / ARV
No comps found within radius.
Projected returns pro-forma
10.0% appreciation · 7.72% rent growth · sell at horizon
- IRR
- 29.4%
- Equity multiple
- 3.36×
- Total profit
- $2,482,394
- Equity at exit
- $3,378,297
- IRR
- 27.0%
- Equity multiple
- 8.21×
- Total profit
- $7,574,521
- Equity at exit
- $7,285,425
Cash invested: $1,050,000 (down + closing). Projections, not guarantees.
Landlord ↔ Tenant lean methodology
- Overall (CITY)
- 0 Strongly Tenant-Friendly
- State New York
- 15 Strongly Tenant-Friendly · D+10
- County
- — inherits STATE
- City New York
- 0 Strongly Tenant-Friendly · D+34
ZIP-level market 11216
- Home prices YoY
- 3.4%
- Rents YoY
- 7.7%
- Active inventory
- 120
- Price-to-rent
- 66.1×
Monthly cashflow live
- Estimated rent
- $37,801 high interval (Pro) →
- Mortgage (P&I)
- −$19,665
- Tax est. 1.5%
- −$4,688 /mo · $56,250/yr
- Insurance
- −$1,562
- HOA
- −$0
- Vacancy / Maint / Mgmt
- −$7,938
- Net cashflow
- $3,947
Break-even live
8-unit breakdown (identical units grouped — click to expand)
| Units | Beds | Baths | Est. rent |
|---|---|---|---|
| 8× units | 2 | 1 | $37,800 |
| #1 | 2 | 1 | $4,725 |
| #2 | 2 | 1 | $4,725 |
| #3 | 2 | 1 | $4,725 |
| #4 | 2 | 1 | $4,725 |
| #5 | 2 | 1 | $4,725 |
| #6 | 2 | 1 | $4,725 |
| #7 | 2 | 1 | $4,725 |
| #8 | 2 | 1 | $4,725 |
| Total (8 units) | $37,801 | ||
UW: 25.0% down · 7.5% · 30yr · 1.5% tax · 5.0% vac · 8.0% maint · 8.0% mgmt
Financing live
Cash to close
- Down payment
- $937,500
- Closing costs
- $112,500
- Reserves months
- —
- Total cash needed
- —
Loan-product check · same deal, 3 products live
Conventional
25% down · 7.5% · 30yr
- Down + closing
- —
- Monthly P&I
- —
- Monthly cashflow
- —
- DSCR
- —
- Eligible?
- —
Personal DTI + credit; lowest rate.
DSCR
20% down · 8.5% · 30yr
- Down + closing
- —
- Monthly P&I
- —
- Monthly cashflow
- —
- DSCR
- —
- Eligible?
- —
No personal income docs; deal must DSCR.
Hard money
10% down · 12.0% · 12mo
- Down + closing
- —
- Monthly P&I
- —
- Monthly cashflow
- —
- DSCR
- —
- Eligible?
- —
Short-term bridge; refi at stabilization.
Listing history 23 events
-
2026-06-18days on market $3,750,000 Active 31 DOM
-
2026-06-17days on market $3,750,000 Active 30 DOM
-
2026-06-16days on market $3,750,000 Active 29 DOM
-
2026-06-15days on market $3,750,000 Active 28 DOM
-
2026-06-13days on market $3,750,000 Active 26 DOM
-
2026-06-10days on market $3,750,000 Active 22 DOM
-
2026-06-08days on market $3,750,000 Active 21 DOM
-
2026-06-08days on market $3,750,000 Active 20 DOM
-
2026-06-04days on market $3,750,000 Active 17 DOM
-
2026-06-03days on market $3,750,000 Active 16 DOM
-
2026-06-02days on market $3,750,000 Active 15 DOM
-
2026-06-01days on market $3,750,000 Active 14 DOM
-
2026-05-31days on market $3,750,000 Active 13 DOM
-
2026-05-18$3,750,000 Active
-
2023-06-17historical
-
2023-06-06price $3,875,000
-
2023-01-30$3,950,000 Active
-
2022-11-06historical
-
2022-10-14status Active
-
2022-10-07historical
-
2022-10-06historical
-
2022-07-15$4,500,000 Active
-
2022-07-14$4,500,000 Active
ⓘ Source: listings_history table (triggers on properties + properties_extension) + one-shot
backfill from property_details.listing_events for pre-trigger history.
Climate risk First Street
- Flood 1/10 Low FEMA zone X (unshaded) · 0% chance over 30 yrs
- Wildfire 1/10 Low
- Heat 6/10 Major 7 d/yr ≥99°F today · 14 d/yr by 30 yrs out
- Wind 6/10 Major 62% chance of damaging wind over 30 yrs
- Air quality 5/10 Major 6 unhealthy d/yr today · 8 by 30 yrs out
Nearby sold comps map
Loading sold comps map…
Walkable amenities ~0.75 mi
Loading nearby amenities…
Taxation est. · year 1
- Rental income
- $453,612
- − Mortgage interest
- −$210,058
- − Property taxes
- −$56,250
- − Insurance
- −$18,750
- − Repairs & maintenance
- −$36,289
- − Management
- −$36,289
- − Depreciation
- −$109,091
- Taxable loss
- −$13,115
- Est. tax savings @ 24.0%
- +$3,148
- After-tax cash flow
- $50,516/yr
For passive investors: Depreciation is non-cash, so a rental often shows a tax loss while cash-flowing — sheltering income. Rental losses are passive: they offset passive income freely, and up to $25,000/yr can offset ordinary (W-2) income if you actively participate and your MAGI is under $100k (phasing out to $0 by $150k); unused losses carry forward. On sale, claimed depreciation is recaptured at up to 25%, and gains may owe capital-gains tax (a 1031 exchange can defer both). Figures are a year-1 estimate at your 24.0% rate — not tax advice; consult a CPA.
Condition & rehab AI · 5 photos
This multi-family property in Crown Heights is in good condition with original architectural details. It offers large unit layouts and is ideal for investors looking to capitalize on the prime location.
Value-add opportunities
- Both Landscaping — Enhances curb appeal and property value
- Both Paint exterior — Improves curb appeal and property value
- Both Clean windows — Enhances natural light and property value
Renovation cost estimate screening
Value-add ROI direction
- Both Landscaping — Enhances curb appeal and property value ↑
- Both Paint exterior — Improves curb appeal and property value ↑
- Both Clean windows — Enhances natural light and property value ↑
ⓘ Cost ranges are severity-bucket heuristics (US national rule-of-thumb). Get contractor quotes + a written scope before underwriting a rehab budget.
Schools (NCES district)
No district data.
Livability — New York
- Score
- 75/100
- State rank
- #268
- US rank
- #4188
Category grades
Schools grade is shown separately in the Schools card above.
Census & demographics
- Census place
- New York, NY
- County
- Kings County · 2,614,986 people
- City population
- 7,731,280
- Metro
- New York-Newark-Jersey City, NY-NJ-PA
- Population (ZIP)
- 60,685
- Household income
- $101,277
- Rent vs Own
- Severe rent burden
- 4473.0
Population outlook (Kings County) Hauer SSP2
- Today (2025)
- 2,847,441 people
- By 2030
- 2,937,006 · +3.1%
- By 2040
- 3,095,491 · +8.7%
- By 2050
- 3,228,968 · +13.4%
- By 2075
- 3,321,723 · +16.7%
- By 2100
- 3,111,387 · +9.3%
Race, ethnicity, and origin ACS 2023
- Neighborhood character
- Diverse neighborhood (Simpson 0.69)
- Race & ethnicity
- Black 46% White 29% Hispanic / Latino 12% Two or more races 11% Asian 5%
- Hispanic origin (detail)
- Mexican 1% Puerto Rican 3% Dominican 2%
- Common ancestry
- Romanian 2% Lithuanian 2% Hispanic 2%
- Foreign-born
- 22% · Canada, Mexico, China
- Languages at home
- 80% English-only · Spanish 8% French/Haitian/Cajun 3% Other Indo-European 2%
Political lean MEDSL · Kings
- 2024 margin
- Solid D (+44.0) · D 72.0% · R 28.0%
- 2008→2024 swing
- -15.5pp toward R · 2008: 59.4pp · 2024: 44.0pp
- All cycles
- 2024: D+44.0 2020: D+54.8 2016: D+61.8 2012: D+63.9 2008: D+59.4
Not yet ingested
- Civics
- —
Market trends
- HPI YoY
- ▲ 27.76%
- Current HPI
- 849.9392
- Rent YoY
- ▲ 7.72%
- Metro
- New York-Newark-Jersey City, NY-NJ-PA
- State GDP YoY
- ▲ 2.60%
- F500 in state
- 92
Industry mix (Fortune 500 HQ in NY)
| Industry | F500 HQs | Revenue |
|---|---|---|
| Financial Services | 10 | $950B |
|
||
| Consumer Goods | 9 | $162B |
|
||
| Insurance | 4 | $225B |
|
||
| Telecommunications | 2 | $144B |
|
||
| Pharmaceuticals | 2 | $112B |
|
||
| Media / Entertainment | 2 | $69B |
|
||
Price history
-16.7% since first listed10 events — show timeline
- 2026-05-18 Listed $3,750,000 RLS at REBNY
- 2023-06-17 Listing Removed — OneKey® MLS as Distributed by MLS Grid
- 2023-06-06 Price Changed $3,875,000 OneKey® MLS as Distributed by MLS Grid
- 2023-01-30 Listed $3,950,000 OneKey® MLS as Distributed by MLS Grid
- 2022-11-06 Listing Removed — OneKey® MLS as Distributed by MLS Grid
- 2022-10-14 Relisted — RLS at REBNY
- 2022-10-07 Listing Removed — OneKey® MLS as Distributed by MLS Grid
- 2022-10-06 Listing Removed — OneKey® MLS as Distributed by MLS Grid
- 2022-07-15 Listed $4,500,000 RLS at REBNY
- 2022-07-14 Listed $4,500,000 OneKey® MLS as Distributed by MLS Grid
Cash-flow waterfall
monthlySold comps — $/sqft
last 12 mo · ≤1 miLoading sold comps…