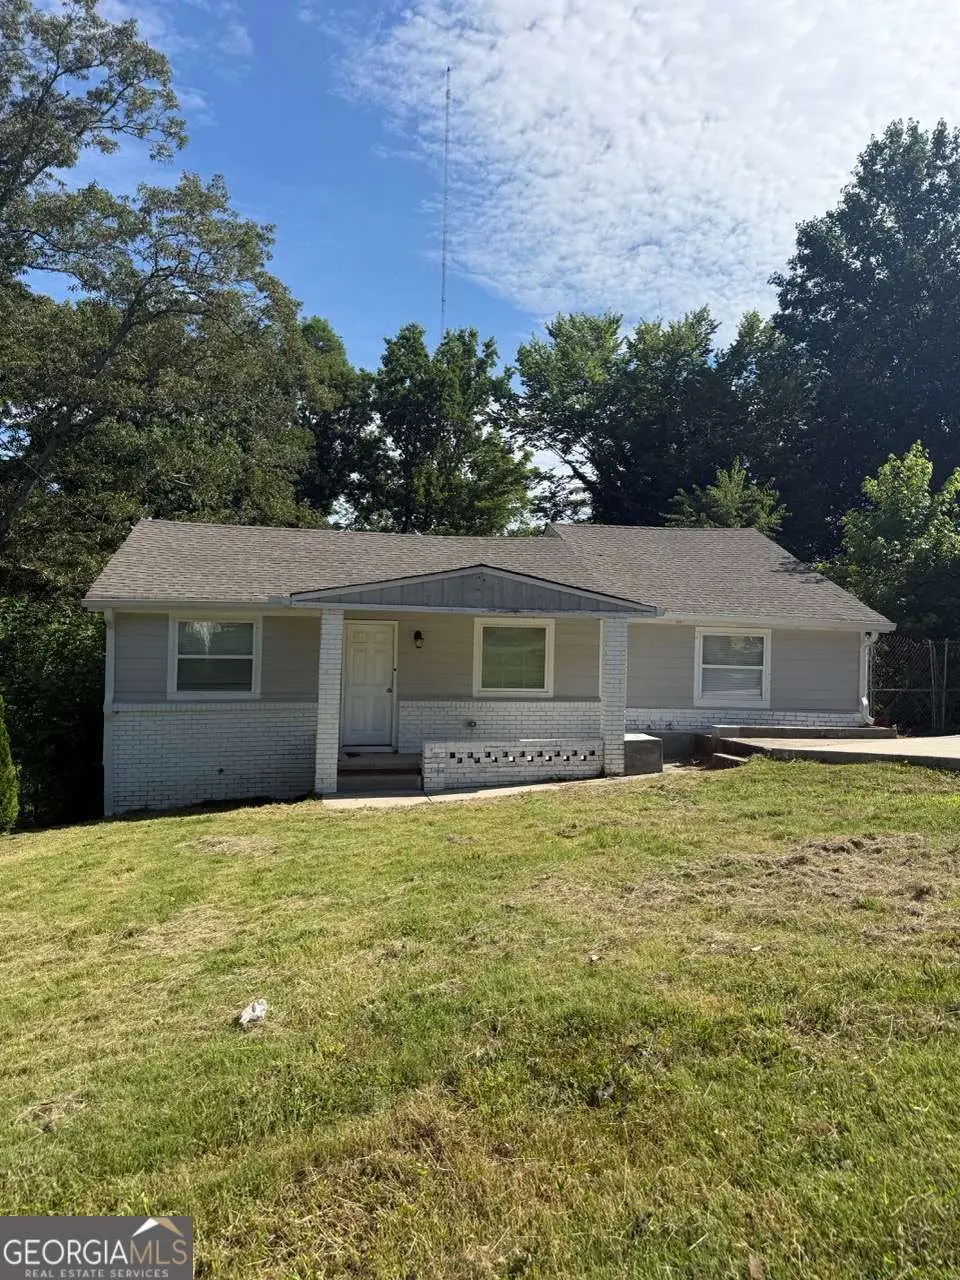
2191 Tiger Flowers Dr NW · Atlanta, GA
Flood risk 5/10 · Moderate
- FEMA flood zone
- X (unshaded)
- Chance of flooding over 30 yrs
- 0.51%
- Est. flood insurance / yr
- $473 – $860
Fire risk 2/10 · Minimal
- Est. fire insurance / yr
- $963 – $1,789
Heat risk 5/10 · Moderate
- Hot days now (above 103°F)
- 7 days/yr
- Hot days in 30 yrs
- 18 days/yr
Wind risk 6/10 · Moderate
- Chance of severe wind over 30 yrs
- 27.0%
Air-quality risk 4/10 · Minor
- Unhealthy air days now
- 3 days/yr
- Unhealthy air days in 30 yrs
- 5 days/yr
Risk factors via First Street. Map © Google.
Why this score? — see what drove the D+ grade
The composite is a weighted blend of 9 inputs, each scored 0–100. Each bar is that input's sub-score; the figure is the points it added to the 100-point composite (weight × sub-score).
- ARV discount +15.0/15.0
- Cash flow +12.6/30.0
- 1% rule +4.8/10.0
- Livability +4.2/5.0
- DSCR +3.8/10.0
- Rent growth +3.1/5.0
- Schools +2.7/10.0
- Condition / age +2.5/5.0
- Appreciation +0.0/10.0
$189,000
🖨 Deal sheet 📄 Offer letter ✓ Due diligence
Listing remarks MLS
CALLING ALL INVESTORS! Excellent potential located in the growing Dixie Hills community. This three-bedroom, 2 bathroom ranch on a quarter-acre is your opportunity to fix-and-flip or hold as a rental opportunity. Great location - Minutes from Downtown Atlanta, I-20/I-285, and public transportation. Just minutes from the vibrant Lee + White food hall and breweries, the Westside Belt Line expansion, and Bellwood Quarry. Quick, easy access to Mercedes-Benz Stadium, State Farm Arena, and major universities. SOLD AS-IS NO SELLER DISCLOSURE CASH FINANCING ONLY. Bring your contractor and secure this property today! NO BLIND OFFERS. Buyer or buyer's agent must physically view the property prior to offer submission.
Key facts
- 0.24 acre lot
- Built 1950
- Listed 2 days
Tags
Property features AI
Finance
- Other: Property listed in fixer condition
Exterior
- Parking: Driveway parking; Open parking available
- Utilities: Public water and public sewer; Electricity available; Natural gas available; Cable and phone available; Electric service listed as 'Other'
- Home design: One-level home; Entry level on main floor; Composition roof
- Construction: Built with brick front and wood siding; Block foundation
- Exterior features: Brick front with wood siding; Rain gutters; Deck, front porch and patio; Paved road frontage on a county road
Interior
- Kitchen: White cabinets; Kitchen island; Stone countertops; Breakfast bar; Open view to the family room
- Bedrooms: Three main-level bedrooms; Primary suite on the main level
- Flooring: Luxury vinyl flooring
- Bathrooms: Two full bathrooms; Primary bathroom with double vanity and shower (no tub)
- Heating & cooling: Natural gas heating; Ceiling fans for cooling
- Interior features: 9-foot ceilings on the main level; No shared/common walls; Crawl space foundation
- Laundry & utility: Hall laundry on the main level; Gas water heater
Neighborhood map
What this means for you Summary
Snapshot
- This is a 3-bed/2.0-bath single-family listed at $189k.
Deal economics
- At list price, monthly cash flow is $-24 ($-283/yr) — negative.
- To cash-flow at today's rent, offer at most $185k (2.2% below list).
- To meet the 1% rule (rent ≥ 1% of price), the offer needs to be $184k (2.5% below list).
- Recommended offer: $184k (2.5% below list) — sets the bar for 1% rule.
- Cap rate 6.1% vs local median 3.1% in Atlanta — top-decile yield for the area; either an underpriced asset or a hidden risk that comps aren't pricing in. Stress-test before assuming the spread holds.
Location & tenants
- Location reads 83/100 on livability (#6 in GA, #919 nationally) — a professional / high-income tenant draw. Strengths: amenities A+, commute A+, housing A+; Watch: cost of living C-.
- Atlanta Public Schools (urban): math 28% / reading 35% proficiency, ranked #80 of 174 in GA (top 46%) — families likely to look elsewhere, expect single-tenant / working-renter base with shorter leases; 71% free/reduced lunch — lower-income household profile, screen leases tightly.
- Zoned schools: Bazoline E. Usher/Collier Heights Elmentary School (math 8% / reading 12%, grade F, #1,092 of 1,228 statewide, top 91%, 398 students, 100% FRL); John Lewis Invictus Academy (math 2% / reading 2%, grade F, #470 of 470 statewide, top 100%, 825 students, 100% FRL); Frederick Douglass High School (math 24%, 1,112 students, 100% FRL) — zoned schools average 100% FRL vs 71% district-wide (29 pts higher); higher-poverty schools than district average — tighter screening recommended.
- Zoned-school proficiency averages 6% at this address vs 32% district-wide (-25 pts) — the specific schools serving this property underperform the Atlanta Public Schools average; the district grade overstates school quality for this exact location.
- Market conditions: Rents rising (+2.5%/yr); 293 active listings in the ZIP; 40 comparable units currently listed for rent nearby; rentals at typical pace (median 24d on market — plan ~3-4 weeks tenant-placement turnaround); lower-income renter base — watch delinquency; 11,565 units permitted in Fulton County in 2024 (8,159 in 5+ unit buildings).
Forward outlook
- Local home prices are declining (-3.0%/yr); year-one equity from $1k of loan paydown is wiped out by about $6k of value loss. Plan a longer hold.
- Fulton County population projected at +38% by 2050 — long-run rental-demand tailwind backs the buy-and-hold thesis.
Negotiation context
- Only 2 days on market — expect competitive offers; lowballing is unlikely to land.
- 8 sale attempts since 2y ago with the ask held roughly flat each time — persistent listings suggest the price (not the market) is what's stuck; bring a comps-based counter.
- Current owner paid $156k; 21% above their basis — modest negotiation headroom, anchor on the comps not their cost.
Risks & watch-outs
- Watch-outs: property tax is 2.6% of price; built in 1950 — expect roof / HVAC / electrical / plumbing capex.
- Climate carrying-cost: moderate flood risk; major wind risk, 27% chance of damaging wind over 30y; extreme-heat days projected 7→18/yr by 2055 (HVAC capex compounding) — expect insurance premiums to compound above CPI over the hold.
Questions for the listing agent
- What do current leases actually rent for vs. the listed asking? Can we see a recent rent roll and the last 12 months of T-12 income?
- Built in 1950 — when were the roof, HVAC, electrical panel, plumbing, and water heater last replaced?
- Property tax is high relative to price — has the assessment been appealed recently, and will the sale trigger a re-assessment?
- Is there a deadline driving the sale (1031 exchange, divorce, estate, relocation)? That informs how much negotiation room exists.
- The area grade is low — what's the realistic commute time and amenity access for the typical tenant pool here? Any planned neighborhood developments (good or bad) we should know about?
- What's the average days-on-market for RENTAL listings here right now (not sales)? A rising rental-DOM trend means longer vacancies and softer asking-rent achievability than the comps imply.
- What's the recent tenant-quality profile in this submarket — average credit score on applications, eviction rate, late-payment / NSF rate, and stable-employment percentage? A property-management company in the area should have these aggregated.
- How much new for-sale + rental construction is in the pipeline within 1–3 miles? Heavy new supply typically softens prices + rents 12–24 months out; constrained supply supports both.
Investment metrics
- 1% rule
- 0.98% ✗
- Cap rate
- 6.14%
- Cash-on-cash
- -0.53%
- DSCR
- 0.98
- GRM
- 8.5
CMA / ARV
- ARV (on-the-fly)
- $244,340
- Comps found
- 12
Show comp detail 12 sales within ~0.75 mi
| Address | Dist | Beds/Ba | Sqft | Sold | Price | $/sf | Match |
|---|---|---|---|---|---|---|---|
| 2481 Harvel Dr NW | 0.53mi | 3/1.0 | 1,250 (-3%) | 1mo | $145,000 | $116 | 66 |
| 2022 Detroit Ave NW | 0.52mi | 3/2.0 | 1,369 (+6%) | 1mo | $235,900 | $172 | 64 |
| 102 Dahlia Ave NW | 0.42mi | 3/2.0 | 1,200 (-7%) | 6mo | $244,000 | $203 | 64 |
| 2068 Verbena St NW | 0.57mi | 3/2.0 | 1,258 (-2%) | 8mo | $238,900 | $190 | 64 |
| 2541 Santa Barbara Dr NW | 0.73mi | 4/2.0 (+1) | 1,300 (+1%) | 0mo | $265,000 | $204 | 59 |
| 2478 Verbena Cir NW | 0.52mi | 4/2.0 (+1) | 1,205 (-6%) | 2mo | $249,000 | $207 | 58 |
| 360 New Jersey Ave | 0.32mi | 4/3.0 (+1) | 1,430 (+11%) | 2mo | $238,500 | $167 | 56 |
| 225 NW Aaron St NW | 0.70mi | 2/2.0 (-1) | 1,367 (+6%) | 1mo | $120,000 | $88 | 51 |
| 1824 Tiger Flowers Dr NW | 0.73mi | 3/2.0 | 1,400 (+9%) | 4mo | $309,000 | $221 | 48 |
| 2081 Verbena St NW | 0.52mi | 3/2.0 | 1,100 (-14%) | 8mo | $215,000 | $195 | 45 |
| 1968 Markone St NW | 0.74mi | 3/2.0 | 1,126 (-12%) | 2mo | $167,500 | $149 | 43 |
| 2548 Loghaven Dr NW | 0.68mi | 3/2.0 | 1,464 (+14%) | 7mo | $248,000 | $169 | 39 |
Match score weights: distance 35% · size 25% · config 20% · recency 20%. Top-matched comps best support the ARV.
Projected returns pro-forma
-3.0% appreciation · 2.53% rent growth · sell at horizon
- IRR
- -17.7%
- Equity multiple
- 0.38×
- Total profit
- $-32,860
- Equity at exit
- $28,181
- IRR
- -10.7%
- Equity multiple
- 0.37×
- Total profit
- $-33,526
- Equity at exit
- $16,341
Cash invested: $52,920 (down + closing). Projections, not guarantees.
Landlord ↔ Tenant lean methodology
- Overall (STATE)
- 90 Strongly Landlord-Friendly
- State Georgia
- 90 Strongly Landlord-Friendly · R+3
- County
- — inherits STATE
- City
- — inherits STATE
ZIP-level market 30314
- Home prices YoY
- -22.9%
- Rents YoY
- 2.5%
- Active inventory
- 293
- Price-to-rent
- 8.5×
Monthly cashflow live
- Estimated rent
- $1,843 high interval (Pro) →
- Mortgage (P&I)
- −$991
- Tax from tax record
- −$410 /mo · $4,916/yr
- Insurance
- −$79
- HOA
- −$0
- Vacancy / Maint / Mgmt
- −$387
- Net cashflow
- $-24
Break-even live
UW: 25.0% down · 7.5% · 30yr · 1.5% tax · 5.0% vac · 8.0% maint · 8.0% mgmt
Financing live
Cash to close
- Down payment
- $47,250
- Closing costs
- $5,670
- Reserves months
- —
- Total cash needed
- —
Loan-product check · same deal, 3 products live
Conventional
25% down · 7.5% · 30yr
- Down + closing
- —
- Monthly P&I
- —
- Monthly cashflow
- —
- DSCR
- —
- Eligible?
- —
Personal DTI + credit; lowest rate.
DSCR
20% down · 8.5% · 30yr
- Down + closing
- —
- Monthly P&I
- —
- Monthly cashflow
- —
- DSCR
- —
- Eligible?
- —
No personal income docs; deal must DSCR.
Hard money
10% down · 12.0% · 12mo
- Down + closing
- —
- Monthly P&I
- —
- Monthly cashflow
- —
- DSCR
- —
- Eligible?
- —
Short-term bridge; refi at stabilization.
Rent comps 40 comps
| Address | Beds | Baths | Sqft | Rent | $/sqft | DOM | Units | Dist |
|---|---|---|---|---|---|---|---|---|
| 2199 Tiger Flowers Dr NW Atlanta, GA | 3.0 | 1.0 | 936 | $1,325 | $1.42 | 24d | 1 | 0.03mi |
| 273 Wadley St NW Atlanta, GA | 3.0 | 2.0 | 1406 | $1,990 | $1.42 | 24d | 1 | 0.13mi |
| 308 Anderson Ave NW Unit A Atlanta, GA | 4.0 | 3.0 | 1250 | $2,200 | $1.76 | 24d | 1 | 0.46mi |
| 1916 Joseph E. Boone Blvd NW Unit A Atlanta, GA | 3.0 | 1.0 | 1100 | $1,550 | $1.41 | 20d | 1 | 0.56mi |
| 1916 Joseph E. Boone Blvd NW Unit B Atlanta, GA | 2.0 | 1.0 | 1000 | $1,195 | $1.20 | 24d | 1 | 0.56mi |
| 1948 Detroit Ave NW Unit A Atlanta, GA | 3.0 | 2.5 | 1205 | $1,900 | $1.58 | 24d | 1 | 0.62mi |
| 2705 Lincoln Ct NW Atlanta, GA | 3.0 | 2.0 | 1134 | $2,050 | $1.81 | 18d | 1 | 0.64mi |
| 2060 Baker Rd NW Atlanta, GA | 2.0 | 2.0 | 1436 | $2,100 | $1.46 | 3d | 1 | 0.66mi |
| 562 Gary Rd NW Atlanta, GA | 4.0 | 2.0 | 1700 | $2,400 | $1.41 | 24d | 1 | 0.67mi |
| 2423 M.L.K. Jr Dr SW Atlanta, GA | 1.0–3.0 | 1.0–2.0 | 1120 | $1,750 | $1.56 | 1d | 19 | 0.69mi |
| 511 Emily Pl NW Atlanta, GA | 3.0 | 1.0 | 1101 | $1,745 | $1.58 | 24d | 1 | 0.72mi |
| 1894 North Ave NW Atlanta, GA | 2.0 | 1.5 | 1098 | $1,995 | $1.82 | 24d | 1 | 0.75mi |
| 2227 Telhurst St SW Atlanta, GA | 2.0 | 2.0 | 928 | $1,395 | $1.50 | 4d | 1 | 0.76mi |
| 2227 Telhurst St SW Atlanta, GA | 2.0 | 2.0 | 928 | $1,395 | $1.50 | 14d | 1 | 0.76mi |
| 2590 Godfrey Dr NW Atlanta, GA | 3.0 | 2.0 | 1308 | $1,995 | $1.53 | 16d | 1 | 0.79mi |
| 556 Church St NW Atlanta, GA | 2.0 | 2.0 | 1432 | $2,200 | $1.54 | 7d | 1 | 0.79mi |
| 1770 Springview Rd NW Atlanta, GA | 3.0 | 2.0 | 1262 | $2,000 | $1.58 | 24d | 1 | 0.81mi |
| 2662 Hood Ave NW Atlanta, GA | 3.0 | 2.0 | 1450 | $2,000 | $1.38 | 24d | 1 | 0.82mi |
| 1839 Penelope Rd NW Atlanta, GA | 3.0 | 1.0 | 988 | $1,400 | $1.42 | 24d | 1 | 0.82mi |
| 2507 Dale Creek Dr NW Atlanta, GA | 3.0 | 1.0 | 1795 | $1,900 | $1.06 | 24d | 1 | 0.85mi |
| 2364 Cross St NW Atlanta, GA | 3.0 | 1.0 | 1168 | $1,500 | $1.28 | 16d | 1 | 0.88mi |
| 195 W Lake Ave NW Unit 1 Atlanta, GA | 3.0 | 2.0 | 1245 | $2,654 | $2.13 | 24d | 1 | 0.90mi |
| 269 Florida Ave SW Atlanta, GA | 3.0 | 1.0 | 925 | $1,850 | $2.00 | 24d | 1 | 0.92mi |
| 2162 Larchwood Rd SW Atlanta, GA | 4.0 | 2.0 | 1200 | $2,550 | $2.12 | 24d | 1 | 0.94mi |
| 24 S Eugenia Pl NW Atlanta, GA | 4.0 | 2.5 | 1410 | $1,725 | $1.22 | 24d | 1 | 0.96mi |
| 316 Henry Aaron Ave SW Atlanta, GA | 3.0 | 2.0 | 1740 | $1,580 | $0.91 | 24d | 1 | 0.97mi |
| 0 W Lake Ave NW Atlanta, GA | 3.0 | 2.5 | 1300 | $1,900 | $1.46 | 2d | 1 | 0.97mi |
| 324 Brooks Ave SW Unit A Atlanta, GA | 2.0 | 1.0 | 1176 | $1,000 | $0.85 | 24d | 1 | 0.97mi |
| 324 Brooks Ave SW Unit B Atlanta, GA | 2.0 | 1.0 | 1176 | $1,050 | $0.89 | 24d | 1 | 0.97mi |
| 390 W Lake Ave NW Apt A1 Atlanta, GA | 3.0 | 1.5 | 1256 | $1,299 | $1.03 | 24d | 1 | 1.00mi |
| 390 W Lake Ave NW Unit A10 Atlanta, GA | 3.0 | 1.5 | 1256 | $1,275 | $1.02 | 24d | 1 | 1.00mi |
| 714 Emily Pl NW Atlanta, GA | 3.0 | 2.0 | 1492 | $2,700 | $1.81 | 3d | 1 | 1.01mi |
| 390 W Lake Ave NW Unit B9 Atlanta, GA | 2.0 | 1.5 | 1256 | $1,275 | $1.02 | 24d | 1 | 1.01mi |
| 364 Brooks Ave SW Atlanta, GA | 3.0 | 2.0 | 1134 | $1,495 | $1.32 | 7d | 1 | 1.05mi |
| 717 Church St NW Atlanta, GA | 4.0 | 2.0 | 1328 | $2,000 | $1.51 | 24d | 1 | 1.06mi |
| 100 Peyton Pl SW Atlanta, GA | 1.0–3.0 | 1.0–2.0 | 1040 | $1,799 | $1.73 | 1d | 26 | 1.08mi |
| 302 Kelso Dr SW Atlanta, GA | 4.0 | 2.0 | 1300 | $2,200 | $1.69 | 14d | 1 | 1.08mi |
| 302 Kelso Dr SW Atlanta, GA | 4.0 | 2.0 | 1300 | $2,200 | $1.69 | 10d | 1 | 1.08mi |
| 2111 Martin Luther King Junior Dr NW Atlanta, GA | 3.0 | 1.0 | 1470 | $1,800 | $1.22 | 24d | 1 | 1.11mi |
| 751 Prince Pl NW Atlanta, GA | 4.0 | 2.0 | 1785 | $2,200 | $1.23 | 24d | 1 | 1.11mi |
Listing history 3 events
-
2026-06-18days on market $189,000 Active 2 DOM
-
2026-06-17remarks 693-char remark
-
2026-06-17$189,000 Active 1 DOM
ⓘ Source: listings_history table (triggers on properties + properties_extension) + one-shot
backfill from property_details.listing_events for pre-trigger history.
Tax reassessment forecast GA · Resets to sale price
- Current annual tax
- $4,916 · $410/mo
- Projected year-2 tax
- $4,916 · $410/mo
- Expected delta
- $0/yr ($0/mo · 0.0%)
ⓘ Screening estimate from a state-policy table — verify with the county assessor before closing.
Climate risk First Street
- Flood 5/10 Major FEMA zone X (unshaded) · 51% chance over 30 yrs
- Wildfire 2/10 Low
- Heat 5/10 Major 7 d/yr ≥103°F today · 18 d/yr by 30 yrs out
- Wind 6/10 Major 27% chance of damaging wind over 30 yrs
- Air quality 4/10 Moderate 3 unhealthy d/yr today · 5 by 30 yrs out
Nearby sold comps map
Loading sold comps map…
Walkable amenities ~0.75 mi
Loading nearby amenities…
Taxation est. · year 1
- Rental income
- $22,116
- − Mortgage interest
- −$10,587
- − Property taxes
- −$4,916
- − Insurance
- −$945
- − Repairs & maintenance
- −$1,769
- − Management
- −$1,769
- − Depreciation
- −$5,498
- Taxable loss
- −$3,368
- Est. tax savings @ 24.0%
- +$808
- After-tax cash flow
- $526/yr
For passive investors: Depreciation is non-cash, so a rental often shows a tax loss while cash-flowing — sheltering income. Rental losses are passive: they offset passive income freely, and up to $25,000/yr can offset ordinary (W-2) income if you actively participate and your MAGI is under $100k (phasing out to $0 by $150k); unused losses carry forward. On sale, claimed depreciation is recaptured at up to 25%, and gains may owe capital-gains tax (a 1031 exchange can defer both). Figures are a year-1 estimate at your 24.0% rate — not tax advice; consult a CPA.
Schools (NCES district)
- District
- Atlanta Public Schools
- NCES district ID
- 1300120
- Math proficiency
- 28% ▼ -6.00%
- Reading proficiency
- 35% ▼ -2.00%
- Median HH income
- $48,306
- Composite
- 27.27/100
- National rank
- #7006
- State rank
- #80 of 174 in GA
Livability — Atlanta
- Score
- 83/100
- State rank
- #6
- US rank
- #919
Category grades
Schools grade is shown separately in the Schools card above.
Census & demographics
- Census place
- Atlanta, GA
- County
- Fulton County · 1,094,430 people
- City population
- 629,525
- Metro
- Atlanta-Sandy Springs-Alpharetta, GA
- Population (ZIP)
- 23,333
- Household income
- $42,089
- Rent vs Own
- Severe rent burden
- 1293.0
Population outlook (Fulton County) Hauer SSP2
- Today (2025)
- 1,203,707 people
- By 2030
- 1,299,706 · +8.0%
- By 2040
- 1,488,256 · +23.6%
- By 2050
- 1,664,580 · +38.3%
- By 2075
- 2,036,072 · +69.2%
- By 2100
- 2,222,402 · +84.6%
Race, ethnicity, and origin ACS 2023
- Neighborhood character
- Predominantly Black (76%)
- Race & ethnicity
- Black 76% White 11% Hispanic / Latino 7% Asian 4% Two or more races 3%
- Hispanic origin (detail)
- Mexican 4% Dominican 1%
- Common ancestry
- Lithuanian 1%
- Foreign-born
- 6% · Canada, China, South Korea
- Languages at home
- 89% English-only · Spanish 5% Other Indo-European 1% Chinese 1%
Political lean MEDSL · Fulton
- 2024 margin
- Solid D (+44.9) · D 71.9% · R 27.0% · Other 1.1%
- 2008→2024 swing
- +9.8pp toward D · 2008: 35.0pp · 2024: 44.9pp
- All cycles
- 2024: D+44.9 2020: D+46.4 2016: D+42.1 2012: D+29.6 2008: D+35.0
Not yet ingested
- Civics
- —
Market trends
- HPI YoY
- ▼ -95.32%
- Current HPI
- 321.4626
- Rent YoY
- ▲ 2.53%
- Metro
- Atlanta-Sandy Springs-Alpharetta, GA
- State GDP YoY
- ▲ 2.66%
- F500 in state
- 28
Industry mix (Fortune 500 HQ in GA)
| Industry | F500 HQs | Revenue |
|---|---|---|
| Paper / Packaging | 2 | $29B |
|
||
| Retail | 1 | $160B |
|
||
| Transportation / Logistics | 1 | $91B |
|
||
| Airlines | 1 | $62B |
|
||
| Consumer Goods | 1 | $47B |
|
||
| Utilities | 1 | $25B |
|
||
Price history
+103.2% since first listed29 events — show timeline
- 2026-06-16 Listed $189,000 FMLS
- 2026-06-16 Listed $189,000 GAMLS
- 2025-10-06 Sold (MLS) $156,188 FMLS
- 2025-10-06 Sold (MLS) $156,188 GAMLS
- 2025-09-08 Pending — GAMLS
- 2025-09-08 Pending — FMLS
- 2025-02-07 Relisted — FMLS
- 2025-02-07 Relisted — GAMLS
- 2025-01-22 Pending — GAMLS
- 2025-01-22 Pending — FMLS
- 2024-10-03 Price Changed $229,900 FMLS
- 2024-10-03 Price Changed $229,900 GAMLS
- 2024-07-23 Relisted — GAMLS
- 2024-07-23 Relisted — FMLS
- 2024-07-19 Contingent — GAMLS
- 2024-07-19 Contingent — FMLS
- 2024-06-25 Price Changed $238,500 FMLS
- 2024-06-25 Price Changed $238,500 GAMLS
- 2024-05-23 Price Changed $249,900 GAMLS
- 2024-05-23 Price Changed $249,900 FMLS
- 2024-04-18 Price Changed $259,900 GAMLS
- 2024-04-18 Price Changed $259,900 FMLS
- 2024-03-19 Price Changed $265,500 GAMLS
- 2024-03-19 Price Changed $265,500 FMLS
- 2024-02-15 Price Changed $285,000 GAMLS
- 2024-02-15 Price Changed $285,000 FMLS
- 2024-01-04 Listed $299,900 FMLS
- 2024-01-04 Listed $299,900 GAMLS
- 2020-12-14 Sold (Public Records) $93,000 Public Records
Property tax history
+19.8%/yrLatest (2025): $4,916 · +11.4% YoY. Source: county tax records.
Cash-flow waterfall
monthlySold comps — $/sqft
last 12 mo · ≤1 miLoading sold comps…