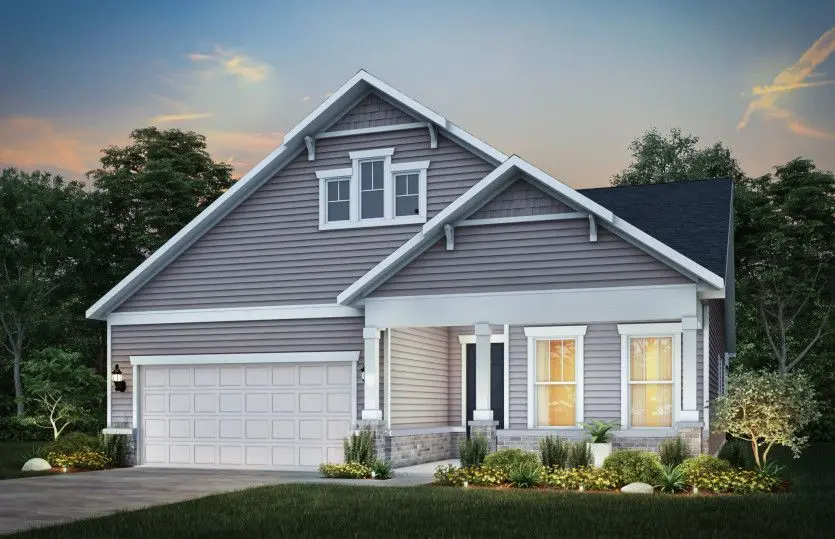
3109 Adelwood Cir · Aurora, IL
Flood risk No data
- FEMA flood zone
- —
- Chance of flooding over 30 yrs
- —
- Est. flood insurance / yr
- —
Fire risk No data
- Est. fire insurance / yr
- —
Heat risk No data
- Hot days now (above threshold)
- —
- Hot days in 30 yrs
- —
Wind risk No data
- Chance of severe wind over 30 yrs
- —
Air-quality risk No data
- Unhealthy air days now
- —
- Unhealthy air days in 30 yrs
- —
Risk factors via First Street. Map © Google.
Why this score? — see what drove the D- grade
The composite is a weighted blend of 9 inputs, each scored 0–100. Each bar is that input's sub-score; the figure is the points it added to the 100-point composite (weight × sub-score).
- ARV discount +12.7/15.0
- Appreciation +10.0/10.0
- Livability +3.8/5.0
- Cash flow +3.5/30.0
- Schools +3.1/10.0
- Rent growth +2.5/5.0
- Condition / age +2.5/5.0
- 1% rule +0.0/10.0
- DSCR +0.0/10.0
$564,213
🖨 Deal sheet (PDF) 📄 Offer letter ✓ Due diligence
Listing remarks MLS
Mystique Ranch Home Available July 2026. Large Corner Homesite. Front Porch Exterior to Enjoy the Morning Sunshine. Walk to the Clubhouse and Amenities Including Pools, Fitness and Pickleball. Enjoy Low Maintenance Living at Del Webb.
Key facts
- Mystique ranch home
- Tennis
- Pickleball
Tags
Neighborhood map
What this means for you Summary
Snapshot
- This is a 2-bed/2.0-bath single-family listed at $564k.
Deal economics
- At list price, monthly cash flow is $-2k ($-21k/yr) — negative.
- To cash-flow at today's rent, offer at most $316k (44.0% below list).
- To meet the 1% rule (rent ≥ 1% of price), the offer needs to be $276k (51.0% below list).
- Recommended offer: $276k (51.0% below list) — sets the bar for 1% rule.
- Cap rate 2.6% vs local median 3.5% in Aurora — below-typical yield; the buyer is paying a premium for something (appreciation thesis, condition, location) that the cap rate doesn't capture.
Location & tenants
- Location reads 75/100 on livability (#232 in IL, #4,272 nationally) — a middle-class / working-renter tenant base. Strengths: commute A+, housing A+, employment A-; Watch: schools F, amenities F, health & safety F.
- CUSD 308 (suburban): math 29% / reading 34% proficiency, ranked #179 of 620 in IL (top 29%) — families likely to look elsewhere, expect single-tenant / working-renter base with shorter leases; only 20% free/reduced lunch — higher-income household profile.
- Market conditions: 121 active listings in the ZIP; 27 comparable units currently listed for rent nearby; rentals at typical pace (median 20d on market — plan ~3-4 weeks tenant-placement turnaround); 41% of comp listings sitting > 30 days — soft ceiling on asking rent; high-income renter base; 2,028 units permitted in Will County in 2024 (530 in 5+ unit buildings).
Forward outlook
- In year one you build about $60k of equity ($4k loan paydown + $56k appreciation (10.0% local appreciation)).
- Will County population projected to shrink 4% by 2050 — rents likely to lag national; underwrite the cash flow, not the appreciation.
- By year 2, paydown + projected appreciation supports a ~$97k cash-out refi (75% LTV) — recoverable capital for the next deal without selling this one.
Negotiation context
- It's been on market 123 days — a 12% lower offer ($497k) is reasonable based on typical stale-listing flexibility.
- 2 sale attempts; this cycle's ask is 6% above the opening price — seller raised mid-cycle; expect resistance to lowballs.
Questions for the listing agent
- What do current leases actually rent for vs. the listed asking? Can we see a recent rent roll and the last 12 months of T-12 income?
- It's been on market 123 days. Have you received any prior offers? Is the seller open to a 51% concession, seller financing, or rate buy-down credit?
- Why hasn't it sold? Are there any deal-killer items the seller is aware of (foundation, flood, title, zoning, code violations)?
- Is there a deadline driving the sale (1031 exchange, divorce, estate, relocation)? That informs how much negotiation room exists.
- Schools are F-rated, which usually means shorter tenancies and higher turnover. Who's the typical renter profile here, and what's been the actual vacancy rate?
- The area grade is low — what's the realistic commute time and amenity access for the typical tenant pool here? Any planned neighborhood developments (good or bad) we should know about?
- What's the average days-on-market for RENTAL listings here right now (not sales)? A rising rental-DOM trend means longer vacancies and softer asking-rent achievability than the comps imply.
- What's the recent tenant-quality profile in this submarket — average credit score on applications, eviction rate, late-payment / NSF rate, and stable-employment percentage? A property-management company in the area should have these aggregated.
- How much new for-sale + rental construction is in the pipeline within 1–3 miles? Heavy new supply typically softens prices + rents 12–24 months out; constrained supply supports both.
Investment metrics
- 1% rule
- 0.49% ✗
- Cap rate
- 2.65%
- Cash-on-cash
- -13.03%
- DSCR
- 0.42
- GRM
- 17.0
CMA / ARV
- ARV (median comp)
- $637,886
- List price
- $564,213
- Delta
- -11.55%
- Verdict
- UNDERPRICED
- Comps
- 20 within 1.0 mi
Show comp detail 12 sales within ~0.75 mi
| Address | Dist | Beds/Ba | Sqft | Sold | Price | $/sf | Match |
|---|---|---|---|---|---|---|---|
| 3150 Adelwood Cir | 0.02mi | 2/2.0 | 1,841 (0%) | 1mo | $680,955 | $370 | 98 |
| 3268 Oak Creek Ln | 0.30mi | 2/2.0 | 1,841 (0%) | 8mo | $556,461 | $302 | 79 |
| 3120 Adelwood Cir | 0.02mi | 2/2.5 | 2,026 (+10%) | 4mo | $604,240 | $298 | 77 |
| 3238 Lincoln Prairie Blvd | 0.49mi | 2/2.0 | 1,841 (0%) | 10mo | $568,710 | $309 | 69 |
| 3214 Lincoln Prairie Blvd | 0.49mi | 2/2.0 | 1,841 (0%) | 10mo | $550,000 | $299 | 69 |
| 3256 Oak Creek Ln | 0.26mi | 2/2.5 | 2,026 (+10%) | 2mo | $579,058 | $286 | 67 |
| 3262 Oak Creek Ln | 0.29mi | 3/2.0 (+1) | 1,646 (-11%) | 0mo | $475,000 | $289 | 64 |
| 3284 Wildlight Rd | 0.44mi | 2/2.0 | 1,624 (-12%) | 3mo | $477,931 | $294 | 57 |
| 3379 Fulshear Cir | 0.49mi | 2/2.0 | 1,624 (-12%) | 0mo | $487,338 | $300 | 57 |
| 3371 Fulshear Cir | 0.52mi | 2/2.0 | 1,624 (-12%) | 0mo | $545,734 | $336 | 56 |
| 2799 Squaw Valley Trl | 0.73mi | 3/2.5 (+1) | 1,812 (-2%) | 2mo | $409,000 | $226 | 55 |
| 3372 Fulshear Cir | 0.54mi | 2/2.0 | 1,624 (-12%) | 1mo | $476,714 | $294 | 54 |
Match score weights: distance 35% · size 25% · config 20% · recency 20%. Top-matched comps best support the ARV.
Projected returns pro-forma
10.0% appreciation · 3.0% rent growth · sell at horizon
- IRR
- 15.2%
- Equity multiple
- 2.25×
- Total profit
- $198,106
- Equity at exit
- $508,288
- IRR
- 14.8%
- Equity multiple
- 5.24×
- Total profit
- $669,363
- Equity at exit
- $1,096,142
Cash invested: $157,980 (down + closing). Projections, not guarantees.
Landlord ↔ Tenant lean methodology
- Overall (STATE)
- 43 Moderately Tenant-Leaning
- State Illinois
- 43 Moderately Tenant-Leaning · D+7
- County
- — inherits STATE
- City
- — inherits STATE
ZIP-level market 60503
- Home prices YoY
- 4.6%
- Active inventory
- 121
- Price-to-rent
- 17.0×
Monthly cashflow live
- Estimated rent
- $2,765 high interval (Pro) →
- Mortgage (P&I)
- −$2,959
- Tax est. 1.5%
- −$705 /mo · $8,463/yr
- Insurance
- −$235
- HOA
- −$0
- Vacancy / Maint / Mgmt
- −$581
- Net cashflow
- $-1,715
Break-even live
Sensitivity live
| Price | -10% $-1,325 | -5% $-1,520 | +0% $-1,715 | +5% $-1,910 | +10% $-2,105 |
|---|---|---|---|---|---|
| Rent | -10% $-1,933 | -5% $-1,824 | +0% $-1,715 | +5% $-1,606 | +10% $-1,496 |
| Rate | -1.0pp $-1,431 | -0.5pp $-1,571 | base $-1,715 | +0.5pp $-1,861 | +1.0pp $-2,010 |
UW: 25.0% down · 7.5% · 30yr · 1.5% tax · 5.0% vac · 8.0% maint · 8.0% mgmt
Financing live
Cash to close
- Down payment
- $141,053
- Closing costs
- $16,926
- Reserves months
- —
- Total cash needed
- —
Loan-product check · same deal, 3 products live
Conventional
25% down · 7.5% · 30yr
- Down + closing
- —
- Monthly P&I
- —
- Monthly cashflow
- —
- DSCR
- —
- Eligible?
- —
Personal DTI + credit; lowest rate.
DSCR
20% down · 8.5% · 30yr
- Down + closing
- —
- Monthly P&I
- —
- Monthly cashflow
- —
- DSCR
- —
- Eligible?
- —
No personal income docs; deal must DSCR.
Hard money
10% down · 12.0% · 12mo
- Down + closing
- —
- Monthly P&I
- —
- Monthly cashflow
- —
- DSCR
- —
- Eligible?
- —
Short-term bridge; refi at stabilization.
Rent comps 27 comps
| Address | Beds | Baths | Sqft | Rent | $/sqft | DOM | Units | Dist |
|---|---|---|---|---|---|---|---|---|
| 2873 Carlsbad Cir Aurora, IL | 3.0 | 2.5 | 1626 | $2,990 | $1.84 | 44d | 1 | 0.55mi |
| 2454 Frost Dr Unit 2454 Aurora, IL | 2.0 | 2.5 | 1230 | $2,300 | $1.87 | 44d | 1 | 0.57mi |
| 464 Valentine Way Oswego, IL | 3.0 | 2.5 | 2071 | $2,800 | $1.35 | 0d | 1 | 0.98mi |
| 260 Devoe Dr Oswego, IL | 3.0 | 2.5 | 1704 | $2,400 | $1.41 | 13d | 1 | 1.07mi |
| 246 Cooney Way Oswego, IL | 3.0 | 2.5 | 1767 | $2,800 | $1.58 | 44d | 1 | 1.11mi |
| 337 Devoe Dr #337 Oswego, IL | 3.0 | 2.5 | 1500 | $2,600 | $1.73 | 25d | 1 | 1.26mi |
| 4227 Pond Willow Rd Naperville, IL | 2.0 | 2.0 | 1370 | $3,045 | $2.22 | 3d | 1 | 1.27mi |
| 347 Devoe Dr Oswego, IL | 3.0 | 2.5 | 1520 | $2,595 | $1.71 | 13d | 1 | 1.27mi |
| 4217 Pond Willow Rd Naperville, IL | 2.0 | 2.0 | 1370 | $3,015 | $2.20 | 0d | 1 | 1.30mi |
| 4218 Pond Willow Rd Naperville, IL | 2.0 | 2.0 | 1370 | $2,815 | $2.05 | 19d | 1 | 1.31mi |
| 4209 Pond Willow Rd Naperville, IL | 2.0 | 2.0 | 1370 | $3,045 | $2.22 | 2d | 1 | 1.31mi |
| 4209 Pond Willow Rd Naperville, IL | 2.0 | 2.0 | 1370 | $2,620 | $1.91 | 44d | 1 | 1.31mi |
| 2550 Providence Ave Aurora, IL | 2.0 | 2.5 | 1550 | $2,300 | $1.48 | 44d | 1 | 1.37mi |
| 2531 Congress Ave #2531 Aurora, IL | 3.0 | 2.5 | 1532 | $2,500 | $1.63 | 44d | 1 | 1.39mi |
| 421 Hathaway Ln Oswego, IL | 3.0 | 2.5 | 2074 | $3,850 | $1.86 | 44d | 1 | 1.42mi |
| 2270 Georgetown Cir Unit 2270 Aurora, IL | 3.0 | 2.5 | 1533 | $2,800 | $1.83 | 44d | 1 | 1.43mi |
| 2460 Georgetown Cir Aurora, IL | 2.0 | 2.5 | 1532 | $2,400 | $1.57 | 2d | 1 | 1.44mi |
| 4462 Monroe Ct Naperville, IL | 2.0 | 2.5 | 1783 | $3,400 | $1.91 | 44d | 1 | 1.47mi |
| 2575 Hillsboro Blvd Aurora, IL | 3.0 | 2.5 | 1530 | $2,500 | $1.63 | 44d | 1 | 1.48mi |
| 2923 Madison Dr Naperville, IL | 2.0 | 2.5 | 1550 | $2,550 | $1.65 | 23d | 1 | 1.49mi |
| 4456 Monroe Ct Naperville, IL | 2.0 | 2.5 | 1588 | $2,795 | $1.76 | 44d | 1 | 1.49mi |
| 4456 Monroe Ct Naperville, IL | 2.0 | 2.5 | 1588 | $2,795 | $1.76 | 12d | 1 | 1.49mi |
| 4456 Monroe Ct Naperville, IL | 2.0 | 2.5 | 1600 | $2,850 | $1.78 | 2d | 1 | 1.49mi |
| 2933 Madison Dr Naperville, IL | 2.0 | 2.5 | 1783 | $3,000 | $1.68 | 11d | 1 | 1.49mi |
| 2909 Madison Dr Naperville, IL | 3.0 | 2.5 | 1783 | $3,095 | $1.74 | 19d | 1 | 1.49mi |
| 4444 Monroe Ct Unit 4444 Naperville, IL | 3.0 | 2.5 | 1783 | $3,300 | $1.85 | 2d | 1 | 1.49mi |
| 4444 Monroe Ct Naperville, IL | 3.0 | 2.5 | 1783 | $3,300 | $1.85 | 0d | 1 | 1.49mi |
Listing history 23 events
-
2026-06-21days on market $564,213 Active 123 DOM
-
2026-06-18days on market $564,213 Active 120 DOM
-
2026-06-17days on market $564,213 Active 119 DOM
-
2026-06-16days on market $564,213 Active 118 DOM
-
2026-06-15days on market $564,213 Active 117 DOM
-
2026-06-13days on market $564,213 Active 115 DOM
-
2026-06-09days on market $564,213 Active 111 DOM
-
2026-06-08days on market $564,213 Active 110 DOM
-
2026-06-07days on market $564,213 Active 109 DOM
-
2026-06-04pricedays on market $564,213 Active 106 DOM
-
2026-06-03days on market $563,213 Active 105 DOM
-
2026-06-02days on market $563,213 Active 104 DOM
-
2026-06-01days on market $563,213 Active 103 DOM
-
2026-05-31days on market $563,213 Active 102 DOM
-
2026-05-15price $563,213 234-char remark
Show marketing remark (234 chars)
Mystique Ranch Home Available July 2026. Large Corner Homesite. Front Porch Exterior to Enjoy the Morning Sunshine. Walk to the Clubhouse and Amenities Including Pools, Fitness and Pickleball. Enjoy Low Maintenance Living at Del Webb.
-
2026-05-08price $562,876 234-char remark
Show marketing remark (234 chars)
Mystique Ranch Home Available July 2026. Large Corner Homesite. Front Porch Exterior to Enjoy the Morning Sunshine. Walk to the Clubhouse and Amenities Including Pools, Fitness and Pickleball. Enjoy Low Maintenance Living at Del Webb.
-
2026-05-07price $572,921 234-char remark
Show marketing remark (234 chars)
Mystique Ranch Home Available July 2026. Large Corner Homesite. Front Porch Exterior to Enjoy the Morning Sunshine. Walk to the Clubhouse and Amenities Including Pools, Fitness and Pickleball. Enjoy Low Maintenance Living at Del Webb.
-
2026-05-01historical
-
2026-04-07price $569,921 234-char remark
Show marketing remark (234 chars)
Mystique Ranch Home Available July 2026. Large Corner Homesite. Front Porch Exterior to Enjoy the Morning Sunshine. Walk to the Clubhouse and Amenities Including Pools, Fitness and Pickleball. Enjoy Low Maintenance Living at Del Webb.
-
2026-04-03price $534,470 234-char remark
Show marketing remark (234 chars)
Mystique Ranch Home Available July 2026. Large Corner Homesite. Front Porch Exterior to Enjoy the Morning Sunshine. Walk to the Clubhouse and Amenities Including Pools, Fitness and Pickleball. Enjoy Low Maintenance Living at Del Webb.
-
2026-04-02price
-
2026-03-19Active
-
2026-02-19$532,470 Active 234-char remark
Show marketing remark (234 chars)
Mystique Ranch Home Available July 2026. Large Corner Homesite. Front Porch Exterior to Enjoy the Morning Sunshine. Walk to the Clubhouse and Amenities Including Pools, Fitness and Pickleball. Enjoy Low Maintenance Living at Del Webb.
ⓘ Source: listings_history table (triggers on properties + properties_extension) + one-shot
backfill from property_details.listing_events for pre-trigger history.
Nearby sold comps map
Loading sold comps map…
Walkable amenities ~0.75 mi
Loading nearby amenities…
Taxation est. · year 1
- Rental income
- $33,179
- − Mortgage interest
- −$31,605
- − Property taxes
- −$8,463
- − Insurance
- −$2,821
- − Repairs & maintenance
- −$2,654
- − Management
- −$2,654
- − Depreciation
- −$16,413
- Taxable loss
- −$31,432
- Est. tax savings @ 24.0%
- +$7,544
- After-tax cash flow
- $-13,035/yr
For passive investors: Depreciation is non-cash, so a rental often shows a tax loss while cash-flowing — sheltering income. Rental losses are passive: they offset passive income freely, and up to $25,000/yr can offset ordinary (W-2) income if you actively participate and your MAGI is under $100k (phasing out to $0 by $150k); unused losses carry forward. On sale, claimed depreciation is recaptured at up to 25%, and gains may owe capital-gains tax (a 1031 exchange can defer both). Figures are a year-1 estimate at your 24.0% rate — not tax advice; consult a CPA.
Schools (NCES district)
- District
- CUSD 308
- NCES district ID
- 1730270
- Math proficiency
- 29% ▼ -10.00%
- Reading proficiency
- 34% ▼ -9.00%
- Median HH income
- $89,945
- Composite
- 31.25/100
- National rank
- #6028
- State rank
- #179 of 620 in IL
Livability — Aurora
- Score
- 75/100
- State rank
- #232
- US rank
- #4272
Category grades
Schools grade is shown separately in the Schools card above.
Census & demographics
- Census place
- Aurora, IL
- County
- Will County · 412,448 people
- City population
- 186,692
- Metro
- Chicago-Naperville-Elgin, IL-IN-WI
- Population (ZIP)
- 16,789
- Household income
- $136,726
- Rent vs Own
- Severe rent burden
- 19.0
Population outlook (Will County) Hauer SSP2
- Today (2025)
- 705,368 people
- By 2030
- 708,154 · +0.4%
- By 2040
- 702,692 · -0.4%
- By 2050
- 680,249 · -3.6%
- By 2075
- 611,990 · -13.2%
- By 2100
- 516,215 · -26.8%
Race, ethnicity, and origin ACS 2023
- Neighborhood character
- Diverse neighborhood (Simpson 0.69)
- Race & ethnicity
- White 49% Asian 19% Black 14% Hispanic / Latino 14% Two or more races 7%
- Hispanic origin (detail)
- Mexican 11% Puerto Rican 1%
- Common ancestry
- Romanian 10% Scandinavian 3% Italian 1%
- Foreign-born
- 22% · Canada, China, Vietnam
- Languages at home
- 68% English-only · Other Indo-European 11% Spanish 8% Other Asian/Pacific 4%
Political lean MEDSL · Will
- 2024 margin
- Toss-up / Even · D 50.1% · R 48.5% · Other 1.4%
- 2008→2024 swing
- -11.6pp toward R · 2008: 13.2pp · 2024: 1.6pp
- All cycles
- 2024: D+1.6 2020: D+8.3 2016: D+5.7 2012: D+3.7 2008: D+13.2
Not yet ingested
- Civics
- —
Market trends
- HPI YoY
- ▲ 10.31%
- Current HPI
- 232.382
- Rent YoY
- —
- Metro
- Chicago-Naperville-Elgin, IL-IN-WI
- State GDP YoY
- ▲ 1.59%
- F500 in state
- 60
Industry mix (Fortune 500 HQ in IL)
| Industry | F500 HQs | Revenue |
|---|---|---|
| Insurance | 4 | $201B |
|
||
| Consumer Goods | 4 | $87B |
|
||
| Industrial Machinery | 3 | $64B |
|
||
| Healthcare | 2 | $55B |
|
||
| Retail / Pharmacy | 1 | $148B |
|
||
| Agriculture / Food | 1 | $86B |
|
||
Price history
+5.8% since first listed9 events — show timeline
- 2026-05-15 Price Changed $563,213 Zillow
- 2026-05-08 Price Changed $562,876 Zillow
- 2026-05-07 Price Changed $572,921 Zillow
- 2026-05-01 Listing Removed — MRED as Distributed by MLS Grid
- 2026-04-07 Price Changed $569,921 Zillow
- 2026-04-03 Price Changed $534,470 Zillow
- 2026-04-02 Price Changed — MRED as Distributed by MLS Grid
- 2026-03-19 Listed — MRED as Distributed by MLS Grid
- 2026-02-19 Listed $532,470 Zillow
Cash-flow waterfall
monthlySold comps — $/sqft
last 12 mo · ≤1 miLoading sold comps…