11818 Button Willow Cv · San Antonio, TX
Flood risk 1/10 · Minimal
- FEMA flood zone
- X (unshaded)
- Chance of flooding over 30 yrs
- 0.0%
- Est. flood insurance / yr
- $507 – $1,088
Fire risk 1/10 · Minimal
- Est. fire insurance / yr
- $1,222 – $2,270
Heat risk 8/10 · Major
- Hot days now (above 107°F)
- 7 days/yr
- Hot days in 30 yrs
- 23 days/yr
Wind risk 6/10 · Moderate
- Chance of severe wind over 30 yrs
- 71.0%
Air-quality risk 2/10 · Minimal
- Unhealthy air days now
- 1 days/yr
- Unhealthy air days in 30 yrs
- 1 days/yr
Risk factors via First Street. Map © Google.
Why this score? — see what drove the C grade
The composite is a weighted blend of 9 inputs, each scored 0–100. Each bar is that input's sub-score; the figure is the points it added to the 100-point composite (weight × sub-score).
- Cash flow +18.3/30.0
- ARV discount +15.0/15.0
- 1% rule +7.1/10.0
- DSCR +5.8/10.0
- Livability +4.0/5.0
- Schools +3.8/10.0
- Condition / age +2.5/5.0
- Rent growth +0.7/5.0
- Appreciation +0.0/10.0
$200,000
🖨 Deal sheet 📄 Offer letter ✓ Due diligence
Listing remarks
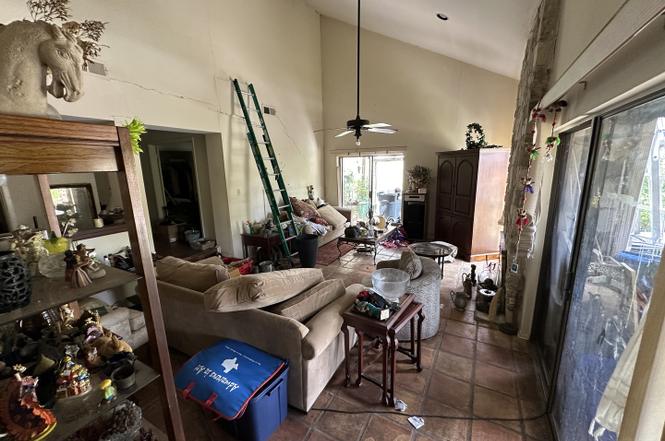
Investor Special - Prime Flip Opportunity in NEISD! Attention investors and rehabbers! This 4-bedroom, 2.5-bath home located on a quiet cul-de-sac in North Central San Antonio is being sold AS-IS and is ready for transformation. The property needs significant repairs and updates, but offers strong upside potential with comparable homes in the area. Featuring over 2231 square feet of living space, an in-ground pool, a spacious lot with mature trees, and a desirable location in the North East ISD, this is the perfect project for seasoned flippers or buyers seeking sweat equity. Cash or hard money only. No repairs will be made. Buyer to verify all measurements and condition. This is a true inv
Key facts
- In-ground pool
- Desirable location
- Spacious lot
Tags
Property features AI
Finance
- Other: Subdivision: SUMMERHILL / SUMMERHILL/VISTA VIEW
- Financial info: Association transfer fee applies
- HOA & community: Mandatory HOA; Annual HOA fee; Community amenities: pool, tennis, park/playground, sports court, bike trails
Exterior
- Parking: 2-car garage
- Utilities: City sewer; Sewer system (city)
- Home design: Wood exterior; Front faces west; Pre-owned home
- Construction: Approximately 49 years old; Slab foundation; Composition roof
- Exterior features: In-ground pool; Cul-de-sac lot; Paved streets with curbs, gutters and sidewalks; Streetlights; Asphalt streets
Interior
- Kitchen: Built-in oven; Microwave oven; Stove/Range
- Bedrooms: Master bedroom (lower level), approx. 18 x 18; Bedroom 2, approx. 10 x 10; Bedroom 3, approx. 10 x 10; Bedroom 4, approx. 10 x 10
- Flooring: Carpeting; Saltillo tile
- Bathrooms: Total: 3 (2 full, 1 half); Master bath with tub/shower combination, approx. 8 x 8
- Heating & cooling: Central heating (natural gas); Central air conditioning
- Interior features: Ceiling fans; Chandelier; Built-in oven; Microwave oven; Stove/Range; Gas cooking; Two living areas; Some window coverings remain; Fireplace
- Laundry & utility: Washer connection; Dryer connection
Neighborhood map
What this means for you Summary
Snapshot
- This is a 4-bed/2.5-bath single-family listed at $200k.
Deal economics
- At list price, monthly cash flow is $185 ($2k/yr) — positive.
- The deal already cash-flows at list — no discount required.
- Meets the 1% rule at list price ($2k rent vs $200k).
- Recommended offer: $176k (12.0% below list) — sets the bar for market timing.
- Cap rate 7.4% vs local median 3.8% in San Antonio — top-decile yield for the area; either an underpriced asset or a hidden risk that comps aren't pricing in. Stress-test before assuming the spread holds.
Location & tenants
- Location reads 80/100 on livability (#31 in TX, #1,616 nationally) — a professional / high-income tenant draw. Strengths: amenities A+, commute A+, cost of living A+; Watch: crime F.
- North East ISD (urban): math 38% / reading 49% proficiency, ranked #276 of 826 in TX (top 33%) — families likely to look elsewhere, expect single-tenant / working-renter base with shorter leases.
- Zoned schools: Larkspur El (math 18% / reading 27%, grade F, #3,311 of 4,322 statewide, top 77%, 882 students, 90% FRL); Churchill H S (math 35% / reading 56%, grade D-, #634 of 1,632 statewide, top 39%, 2,510 students, 43% FRL) — zoned schools average 66% FRL vs 41% district-wide (25 pts higher); higher-poverty schools than district average — tighter screening recommended.
- Market conditions: Rents falling (-7.3%/yr); 104 active listings in the ZIP; 24 comparable units currently listed for rent nearby; rentals at typical pace (median 24d on market — plan ~3-4 weeks tenant-placement turnaround); 8,308 units permitted in Bexar County in 2024 (2,506 in 5+ unit buildings).
- At $2,430/mo this rent would consume 52% of the median local household income ($56k/yr) (locally 2375% of renters already pay >50% of income on rent) — very limited rent-growth headroom before tenants either downsize or default.
Forward outlook
- Local home prices are declining (-3.0%/yr); year-one equity from $1k of loan paydown is wiped out by about $6k of value loss. Plan a longer hold.
- Bexar County population projected at +50% by 2050 — long-run rental-demand tailwind backs the buy-and-hold thesis.
Negotiation context
- It's been on market 237 days — a 12% lower offer ($176k) is reasonable based on typical stale-listing flexibility.
- 2 sale attempts; this cycle's ask is 8% above the opening price — seller raised mid-cycle; expect resistance to lowballs.
Risks & watch-outs
- Watch-outs: property tax is 3.5% of price.
- Climate carrying-cost: major wind risk, 71% chance of damaging wind over 30y; extreme-heat days projected 7→23/yr by 2055 (HVAC capex compounding) — expect insurance premiums to compound above CPI over the hold.
Questions for the listing agent
- It's been on market 237 days. Have you received any prior offers? Is the seller open to a 12% concession, seller financing, or rate buy-down credit?
- Built in 1976 — when were the roof, HVAC, electrical panel, plumbing, and water heater last replaced?
- Property tax is high relative to price — has the assessment been appealed recently, and will the sale trigger a re-assessment?
- What does the HOA fee cover, when was the last increase, and are there any pending special assessments or reserve-fund shortfalls?
- Why hasn't it sold? Are there any deal-killer items the seller is aware of (foundation, flood, title, zoning, code violations)?
- Is there a deadline driving the sale (1031 exchange, divorce, estate, relocation)? That informs how much negotiation room exists.
- Crime grade is F in this area — have there been break-ins, vandalism, or insurance claims at this property in the last 3 years? What carrier currently insures it and at what premium?
- What's the average days-on-market for RENTAL listings here right now (not sales)? A rising rental-DOM trend means longer vacancies and softer asking-rent achievability than the comps imply.
- What's the recent tenant-quality profile in this submarket — average credit score on applications, eviction rate, late-payment / NSF rate, and stable-employment percentage? A property-management company in the area should have these aggregated.
- How much new for-sale + rental construction is in the pipeline within 1–3 miles? Heavy new supply typically softens prices + rents 12–24 months out; constrained supply supports both.
Investment metrics
- 1% rule
- 1.21% ✓
- Cap rate
- 7.40%
- Cash-on-cash
- 3.96%
- DSCR
- 1.18
- GRM
- 6.9
CMA / ARV
- ARV (on-the-fly)
- $377,039
- Comps found
- 12
Show comp detail 12 sales within ~0.75 mi
| Address | Dist | Beds/Ba | Sqft | Sold | Price | $/sf | Match |
|---|---|---|---|---|---|---|---|
| 11802 Tarragon | 0.16mi | 4/2.5 | 2,090 (-6%) | 6mo | $400,000 | $191 | 77 |
| 11830 Button Willow | 0.03mi | 3/2.0 (-1) | 2,019 (-10%) | 3mo | $299,700 | $148 | 73 |
| 1822 Paisley | 0.22mi | 3/2.0 (-1) | 2,430 (+9%) | 1mo | $394,900 | $163 | 67 |
| 2230 Bedford Stage | 0.40mi | 3/2.5 (-1) | 2,175 (-2%) | 6mo | $310,000 | $143 | 67 |
| 1519 Larkspur | 0.57mi | 4/3.0 | 2,326 (+4%) | 7mo | $455,000 | $196 | 58 |
| 8219 Foxtail Frk | 0.25mi | 4/2.5 | 2,559 (+15%) | 11mo | $324,990 | $127 | 55 |
| 1510 Vista Azul | 0.25mi | 3/2.0 (-1) | 1,956 (-12%) | 10mo | $314,000 | $161 | 53 |
| 11422 Lima Dr | 0.41mi | 3/2.5 (-1) | 2,558 (+15%) | 2mo | $387,000 | $151 | 50 |
| 11934 Tokyo | 0.73mi | 3/2.5 (-1) | 2,413 (+8%) | 3mo | $467,000 | $194 | 45 |
| 11919 Tokyo | 0.73mi | 4/3.0 | 2,076 (-7%) | 11mo | $464,000 | $224 | 43 |
| 10715 Ysamy Way | 0.54mi | 3/2.5 (-1) | 2,516 (+13%) | 7mo | $425,000 | $169 | 42 |
| 10618 Alys Way | 0.69mi | 3/2.0 (-1) | 2,372 (+6%) | 10mo | $450,000 | $190 | 42 |
Match score weights: distance 35% · size 25% · config 20% · recency 20%. Top-matched comps best support the ARV.
Projected returns pro-forma
-3.0% appreciation · 0.0% rent growth · sell at horizon
- IRR
- -14.2%
- Equity multiple
- 0.51×
- Total profit
- $-27,502
- Equity at exit
- $29,821
- IRR
- -12.9%
- Equity multiple
- 0.37×
- Total profit
- $-35,278
- Equity at exit
- $17,292
Cash invested: $56,000 (down + closing). Projections, not guarantees.
Landlord ↔ Tenant lean methodology
- Overall (STATE)
- 87 Strongly Landlord-Friendly
- State Texas
- 87 Strongly Landlord-Friendly · R+5
- County
- — inherits STATE
- City
- — inherits STATE
ZIP-level market 78213
- Rents YoY
- -7.3%
- Active inventory
- 104
- Price-to-rent
- 6.9×
Monthly cashflow live
- Estimated rent
- $2,430 high interval (Pro) →
- Mortgage (P&I)
- −$1,049
- Tax from tax record
- −$587 /mo · $7,038/yr
- Insurance
- −$83
- HOA
- −$16
- Vacancy / Maint / Mgmt
- −$510
- Net cashflow
- $185
Break-even live
UW: 25.0% down · 7.5% · 30yr · 1.5% tax · 5.0% vac · 8.0% maint · 8.0% mgmt
Financing live
Cash to close
- Down payment
- $50,000
- Closing costs
- $6,000
- Reserves months
- —
- Total cash needed
- —
Loan-product check · same deal, 3 products live
Conventional
25% down · 7.5% · 30yr
- Down + closing
- —
- Monthly P&I
- —
- Monthly cashflow
- —
- DSCR
- —
- Eligible?
- —
Personal DTI + credit; lowest rate.
DSCR
20% down · 8.5% · 30yr
- Down + closing
- —
- Monthly P&I
- —
- Monthly cashflow
- —
- DSCR
- —
- Eligible?
- —
No personal income docs; deal must DSCR.
Hard money
10% down · 12.0% · 12mo
- Down + closing
- —
- Monthly P&I
- —
- Monthly cashflow
- —
- DSCR
- —
- Eligible?
- —
Short-term bridge; refi at stabilization.
Rent comps 24 comps
| Address | Beds | Baths | Sqft | Rent | $/sqft | DOM | Units | Dist |
|---|---|---|---|---|---|---|---|---|
| 11423 Baltic Dr San Antonio, TX | 4.0 | 2.5 | 2156 | $4,500 | $2.09 | 44d | 1 | 0.21mi |
| 11303 Baltic Dr San Antonio, TX | 3.0 | 2.5 | 1446 | $1,850 | $1.28 | 4d | 1 | 0.31mi |
| 2031 Silver Oaks San Antonio, TX | 3.0 | 2.0 | 1400 | $1,800 | $1.29 | 15d | 1 | 0.40mi |
| 11215 Archers Bay San Antonio, TX | 3.0 | 2.5 | 1721 | $2,600 | $1.51 | 44d | 1 | 0.49mi |
| 2358 NW Military Hwy San Antonio, TX | 1.0–4.0 | 1.0–2.0 | 1082 | $1,599 | $1.48 | 24d | 5 | 0.68mi |
| 11726 West Ave Unit 3213 San Antonio, TX | 3.0 | 2.0 | 1526 | $3,145 | $2.06 | 3d | 1 | 0.74mi |
| 734 Susie Ct San Antonio, TX | 4.0 | 1.0 | 2054 | $2,250 | $1.10 | 4d | 1 | 0.91mi |
| 734 Susie Ct San Antonio, TX | 4.0 | 2.0 | 2054 | $2,250 | $1.10 | 4d | 1 | 0.91mi |
| 10507 Mount Boracho Dr San Antonio, TX | 4.0 | 2.0 | 1400 | $1,825 | $1.30 | 24d | 1 | 0.95mi |
| 12719 Goldenrain Bay San Antonio, TX | 3.0 | 2.5 | 1962 | $2,200 | $1.12 | 44d | 1 | 0.96mi |
| 11611 Veradero Dr San Antonio, TX | 3.0 | 2.0 | 1704 | $2,200 | $1.29 | 24d | 1 | 1.00mi |
| 11622 Veradero Dr San Antonio, TX | 3.0 | 2.5 | 2359 | $2,150 | $0.91 | 44d | 1 | 1.05mi |
| 11414 Sandman St San Antonio, TX | 3.0 | 2.0 | 2110 | $2,000 | $0.95 | 24d | 1 | 1.05mi |
| 791 Sycamore Moon San Antonio, TX | 3.0 | 2.5 | 1793 | $1,850 | $1.03 | 24d | 1 | 1.10mi |
| 602 Briar Oak St San Antonio, TX | 4.0 | 2.0 | 1882 | $2,250 | $1.20 | 24d | 1 | 1.11mi |
| 742 Sycamore Moon San Antonio, TX | 3.0 | 2.0 | 1494 | $1,850 | $1.24 | 14d | 1 | 1.13mi |
| 2503 Manor Heights Dr San Antonio, TX | 3.0 | 3.5 | 1962 | $3,000 | $1.53 | 8d | 1 | 1.17mi |
| 707 Sycamore Moon San Antonio, TX | 3.0 | 2.5 | 1888 | $1,850 | $0.98 | 24d | 1 | 1.20mi |
| 208 S Winston Ln Castle Hills, TX | 3.0 | 2.0 | 1896 | $2,695 | $1.42 | 2d | 1 | 1.20mi |
| 555 Patricia San Antonio, TX | 4.0 | 2.0 | 1720 | $2,400 | $1.40 | 2d | 1 | 1.21mi |
| 13319 Stairock St San Antonio, TX | 3.0 | 2.5 | 2028 | $3,000 | $1.48 | 17d | 1 | 1.31mi |
| 2535 Wilderness Hl San Antonio, TX | 3.0 | 2.0 | 2658 | $2,400 | $0.90 | 11d | 1 | 1.34mi |
| 1127 Mount Rainier Dr San Antonio, TX | 3.0 | 2.0 | 1796 | $1,995 | $1.11 | 18d | 1 | 1.34mi |
| 13618 Cobble Way Cir San Antonio, TX | 3.0 | 2.0 | 1691 | $2,200 | $1.30 | 44d | 1 | 1.49mi |
HOA detail
- Monthly dues
- $16 · $192/yr
- Likely covers
- pool
Listing history 7 events
-
2026-05-12status Pending
-
2026-04-06historical Active Option
-
2025-09-24price $200,000
-
2025-09-17$185,000 New
-
2025-09-10historical
-
2025-07-17$185,000 New
-
1991-09-01soldstatus
ⓘ Source: listings_history table (triggers on properties + properties_extension) + one-shot
backfill from property_details.listing_events for pre-trigger history.
Tax reassessment forecast TX · Resets to sale price
- Current annual tax
- $7,038 · $587/mo
- Projected year-2 tax
- $7,038 · $587/mo
- Expected delta
- $0/yr ($0/mo · 0.0%)
ⓘ Screening estimate from a state-policy table — verify with the county assessor before closing.
Climate risk First Street
- Flood 1/10 Low FEMA zone X (unshaded) · 0% chance over 30 yrs
- Wildfire 1/10 Low
- Heat 8/10 Severe 7 d/yr ≥107°F today · 23 d/yr by 30 yrs out
- Wind 6/10 Major 71% chance of damaging wind over 30 yrs
- Air quality 2/10 Low 1 unhealthy d/yr today · 1 by 30 yrs out
Nearby sold comps map
Loading sold comps map…
Walkable amenities ~0.75 mi
Loading nearby amenities…
Taxation est. · year 1
- Rental income
- $29,157
- − Mortgage interest
- −$11,203
- − Property taxes
- −$7,038
- − Insurance
- −$1,000
- − Repairs & maintenance
- −$2,333
- − Management
- −$2,333
- − HOA
- −$192
- − Depreciation
- −$5,818
- Taxable loss
- −$759
- Est. tax savings @ 24.0%
- +$182
- After-tax cash flow
- $2,401/yr
For passive investors: Depreciation is non-cash, so a rental often shows a tax loss while cash-flowing — sheltering income. Rental losses are passive: they offset passive income freely, and up to $25,000/yr can offset ordinary (W-2) income if you actively participate and your MAGI is under $100k (phasing out to $0 by $150k); unused losses carry forward. On sale, claimed depreciation is recaptured at up to 25%, and gains may owe capital-gains tax (a 1031 exchange can defer both). Figures are a year-1 estimate at your 24.0% rate — not tax advice; consult a CPA.
Schools (NCES district)
- District
- North East ISD
- NCES district ID
- 4832940
- Math proficiency
- 38% ▼ -14.00%
- Reading proficiency
- 49% ▼ -4.00%
- Median HH income
- $57,715
- Composite
- 38.1/100
- National rank
- #4276
- State rank
- #276 of 826 in TX
Livability — San Antonio
- Score
- 80/100
- State rank
- #31
- US rank
- #1616
Category grades
Schools grade is shown separately in the Schools card above.
Census & demographics
- Census place
- San Antonio, TX
- County
- Bexar County · 1,990,555 people
- City population
- 1,806,925
- Metro
- San Antonio-New Braunfels, TX
- Population (ZIP)
- 40,526
- Household income
- $55,884
- Rent vs Own
- Severe rent burden
- 2375.0
Population outlook (Bexar County) Hauer SSP2
- Today (2025)
- 2,336,851 people
- By 2030
- 2,560,728 · +9.6%
- By 2040
- 3,020,569 · +29.3%
- By 2050
- 3,493,522 · +49.5%
- By 2075
- 4,668,459 · +99.8%
- By 2100
- 5,533,242 · +136.8%
Race, ethnicity, and origin ACS 2023
- Neighborhood character
- Predominantly Hispanic (73%)
- Race & ethnicity
- Hispanic / Latino 73% Two or more races 45% White 19% Black 4% Asian 1%
- Hispanic origin (detail)
- Mexican 63%
- Common ancestry
- Slovak 1% Lithuanian 1% Romanian 1%
- Foreign-born
- 18% · Canada
- Languages at home
- 54% English-only · Spanish 44%
Political lean MEDSL · Bexar
- 2024 margin
- Lean D (+9.8) · D 54.3% · R 44.6% · Other 1.1%
- 2008→2024 swing
- +4.2pp toward D · 2008: 5.6pp · 2024: 9.8pp
- All cycles
- 2024: D+9.8 2020: D+18.2 2016: D+13.5 2012: D+4.6 2008: D+5.6
Not yet ingested
- Civics
- —
Market trends
- HPI YoY
- ▼ -155.64%
- Current HPI
- 238.7889
- Rent YoY
- ▼ -7.31%
- Metro
- San Antonio-New Braunfels, TX
- State GDP YoY
- ▲ 3.95%
- F500 in state
- 110
Industry mix (Fortune 500 HQ in TX)
| Industry | F500 HQs | Revenue |
|---|---|---|
| Energy | 16 | $1,198B |
|
||
| Technology | 5 | $198B |
|
||
| Engineering / Construction | 4 | $72B |
|
||
| Energy Services | 3 | $60B |
|
||
| Utilities | 3 | $41B |
|
||
| Healthcare | 2 | $330B |
|
||
Price history
+8.1% since first listed7 events — show timeline
- 2026-05-12 Pending — LERA
- 2026-04-06 Contingent — LERA
- 2025-09-24 Price Changed $200,000 LERA
- 2025-09-17 Listed $185,000 LERA
- 2025-09-10 Listing Removed — LERA
- 2025-07-17 Listed $185,000 LERA
- 1991-09-01 Sold (Public Records) — Public Records
Property tax history
+3.7%/yrLatest (2025): $7,038 · -3.8% YoY. Source: county tax records.
Cash-flow waterfall
monthlySold comps — $/sqft
last 12 mo · ≤1 miLoading sold comps…