2255 Middle Ridge Dr · Conroe, TX
Flood risk No data
- FEMA flood zone
- —
- Chance of flooding over 30 yrs
- —
- Est. flood insurance / yr
- —
Fire risk No data
- Est. fire insurance / yr
- —
Heat risk No data
- Hot days now (above threshold)
- —
- Hot days in 30 yrs
- —
Wind risk No data
- Chance of severe wind over 30 yrs
- —
Air-quality risk No data
- Unhealthy air days now
- —
- Unhealthy air days in 30 yrs
- —
Risk factors via First Street. Map © Google.
Why this score? — see what drove the D grade
The composite is a weighted blend of 9 inputs, each scored 0–100. Each bar is that input's sub-score; the figure is the points it added to the 100-point composite (weight × sub-score).
- ARV discount +11.0/15.0
- Cash flow +7.8/30.0
- Schools +5.1/10.0
- Condition / age +4.0/5.0
- 1% rule +3.9/10.0
- Livability +3.7/5.0
- Rent growth +2.9/5.0
- DSCR +1.9/10.0
- Appreciation +0.0/10.0
$219,990
🖨 Deal sheet 📄 Offer letter ✓ Due diligence
Listing remarks
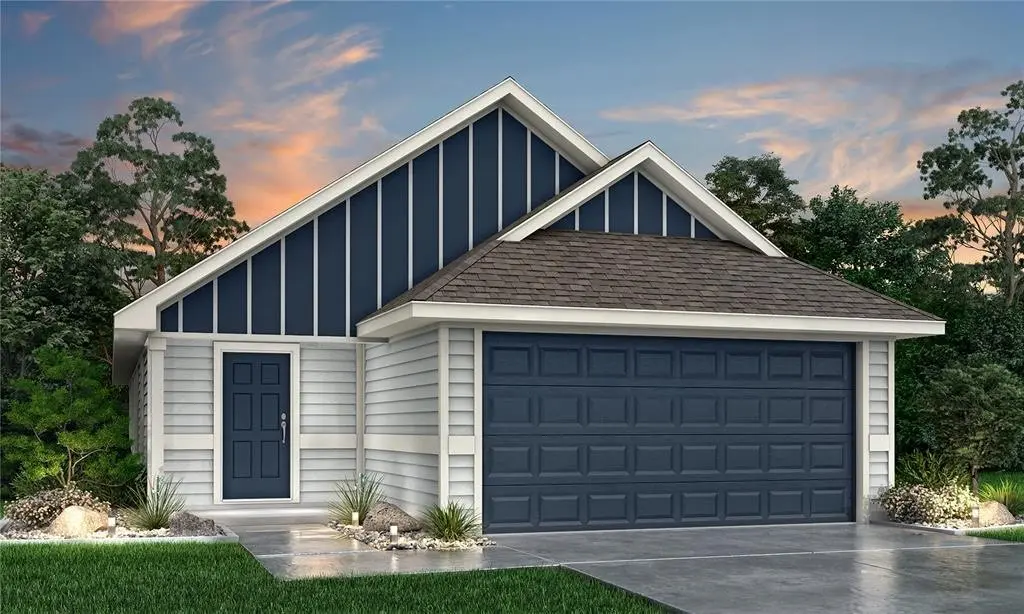
Welcome to one of Legend's newest communities in Conroe, TX! Conveniently located off the 336 Loop, Cliffstone Hills makes commuting a breeze! The Pinewood floor plan is a charming 1-story home with 3 bedrooms, 2 bathrooms, and a 2-car garage! This home has it all, including vinyl plank flooring throughout the common areas! The gourmet kitchen is sure to please with 42” cabinets, granite countertops, and stainless-steel appliances! Retreat to the Owner’s Suite featuring a sizable shower and a spacious walk-in closet! Enjoy the great outdoors with full sod and sprinkler system! Walking distance to great schools, community playground is right across the street from the house, sche
Key facts
- Gourmet kitchen
- Sizable shower
- Sprinkler system
Tags
Property features AI
Finance
- HOA & community: Homeowners association with an annual fee of $450
Exterior
- Parking: Attached 2-car garage
- Utilities: Public water; Public sewer; Electric service available
- Home design: Residential property; Single-story (entry level: first floor)
- Construction: Built in 2023; Composition roof; Slab foundation; Construction materials: Unknown
- Exterior features: Subdivision lot; Faces south
Interior
- Kitchen: Dishwasher, Disposal, Microwave
- Bathrooms: 2 full bathrooms
- Heating & cooling: Central gas heating; Heat pump cooling
- Interior features: Dishwasher, Disposal, Microwave; Total of 4 rooms; Living room on the first floor
Neighborhood map
What this means for you Summary
Snapshot
- This is a 3-bed/2.0-bath single-family listed at $220k. Condition is rated good.
Deal economics
- At list price, monthly cash flow is $-244 ($-3k/yr) — negative.
- To cash-flow at today's rent, offer at most $177k (19.6% below list).
- To meet the 1% rule (rent ≥ 1% of price), the offer needs to be $197k (10.6% below list).
- Recommended offer: $177k (19.6% below list) — sets the bar for cash-flow.
- Cap rate 5.0% vs local median 3.1% in Conroe — top-decile yield for the area; either an underpriced asset or a hidden risk that comps aren't pricing in. Stress-test before assuming the spread holds.
Location & tenants
- Location reads 74/100 on livability (#169 in TX, #4,447 nationally) — a middle-class / working-renter tenant base. Strengths: cost of living A+, housing A+, amenities B; Watch: commute F, health & safety F.
- Conroe ISD (other): math 57% / reading 57% proficiency, ranked #69 of 826 in TX (top 8%) — acceptable for families but not a draw, mixed tenant base, ~2y average lease.
- Zoned schools: Patterson El (math 33% / reading 35%, grade F, #2,149 of 4,322 statewide, top 50%, 977 students, 74% FRL); Conroe H S (math 32% / reading 51%, grade F, #767 of 1,632 statewide, top 47%, 4,915 students, 61% FRL) — zoned schools average 68% FRL vs 34% district-wide (33 pts higher); higher-poverty schools than district average — tighter screening recommended.
- Zoned-school proficiency averages 38% at this address vs 57% district-wide (-19 pts) — the specific schools serving this property underperform the Conroe ISD average; the district grade overstates school quality for this exact location.
- Market conditions: Rents rising (+1.4%/yr); 486 active listings in the ZIP; 2 comparable units currently listed for rent nearby; 13,259 units permitted in Montgomery County in 2024 (1,402 in 5+ unit buildings).
- This rent runs 36% of the median local income ($66k/yr) — at the standard rent-burdened threshold; future hikes will face affordability resistance.
Forward outlook
- Local home prices are declining (-3.0%/yr); year-one equity from $2k of loan paydown is wiped out by about $7k of value loss. Plan a longer hold.
- Montgomery County population projected at +65% by 2050 — long-run rental-demand tailwind backs the buy-and-hold thesis.
Negotiation context
- It's been on market 40 days — a 3% lower offer ($213k) is reasonable based on typical stale-listing flexibility.
- 5 sale attempts since 3y ago; this cycle's ask is 12471% above the opening price — seller raised mid-cycle; expect resistance to lowballs.
Risks & watch-outs
- Watch-outs: property tax is 2.8% of price.
Questions for the listing agent
- What do current leases actually rent for vs. the listed asking? Can we see a recent rent roll and the last 12 months of T-12 income?
- It's been on market 40 days. Have you received any prior offers? Is the seller open to a 20% concession, seller financing, or rate buy-down credit?
- Property tax is high relative to price — has the assessment been appealed recently, and will the sale trigger a re-assessment?
- What does the HOA fee cover, when was the last increase, and are there any pending special assessments or reserve-fund shortfalls?
- Is there a deadline driving the sale (1031 exchange, divorce, estate, relocation)? That informs how much negotiation room exists.
- Schools are D-rated, which usually means shorter tenancies and higher turnover. Who's the typical renter profile here, and what's been the actual vacancy rate?
- The area grade is low — what's the realistic commute time and amenity access for the typical tenant pool here? Any planned neighborhood developments (good or bad) we should know about?
- What's the average days-on-market for RENTAL listings here right now (not sales)? A rising rental-DOM trend means longer vacancies and softer asking-rent achievability than the comps imply.
- What's the recent tenant-quality profile in this submarket — average credit score on applications, eviction rate, late-payment / NSF rate, and stable-employment percentage? A property-management company in the area should have these aggregated.
- How much new for-sale + rental construction is in the pipeline within 1–3 miles? Heavy new supply typically softens prices + rents 12–24 months out; constrained supply supports both.
Investment metrics
- 1% rule
- 0.89% ✗
- Cap rate
- 4.96%
- Cash-on-cash
- -4.75%
- DSCR
- 0.79
- GRM
- 9.3
CMA / ARV
- ARV (median comp)
- $238,737
- List price
- $219,990
- Delta
- -7.85%
- Verdict
- FAIR
- Comps
- 20 within 1.0 mi
Show comp detail 12 sales within ~0.75 mi
| Address | Dist | Beds/Ba | Sqft | Sold | Price | $/sf | Match |
|---|---|---|---|---|---|---|---|
| 1368 Mount Bassie Trl | 0.03mi | 3/2.0 | 1,355 (+8%) | 9mo | $234,990 | $173 | 78 |
| 2541 Hawks Eye Dr | 0.28mi | 3/2.0 | 1,331 (+6%) | 2mo | $219,990 | $165 | 75 |
| 2532 Hawks Eye Dr | 0.31mi | 3/2.0 | 1,331 (+6%) | 1mo | $219,990 | $165 | 74 |
| 2521 Hawks Eye Dr | 0.30mi | 3/2.0 | 1,331 (+6%) | 2mo | $219,990 | $165 | 74 |
| 2445 Bray Head Dr | 0.11mi | 3/2.0 | 1,331 (+6%) | 15mo | $219,990 | $165 | 72 |
| 2512 Hawks Eye Dr | 0.34mi | 3/2.0 | 1,331 (+6%) | 4mo | $229,990 | $173 | 71 |
| 2517 Hawks Eye Dr | 0.31mi | 3/2.0 | 1,355 (+8%) | 2mo | $224,990 | $166 | 71 |
| 2528 Hawks Eye Dr | 0.32mi | 3/2.0 | 1,355 (+8%) | 4mo | $245,549 | $181 | 69 |
| 1332 Sue Peak Dr | 0.19mi | 3/2.0 | 1,331 (+6%) | 15mo | $219,990 | $165 | 69 |
| 1381 Mount Blanc Path | 0.18mi | 3/2.0 | 1,355 (+8%) | 15mo | $239,990 | $177 | 66 |
| 1392 Mount Blanc Path | 0.20mi | 3/2.0 | 1,355 (+8%) | 14mo | $229,990 | $170 | 65 |
| 607 Airline Dr | 0.41mi | 3/1.0 | 1,101 (-12%) | 5mo | $175,000 | $159 | 52 |
Match score weights: distance 35% · size 25% · config 20% · recency 20%. Top-matched comps best support the ARV.
Projected returns pro-forma
-3.0% appreciation · 1.43% rent growth · sell at horizon
- IRR
- -26.4%
- Equity multiple
- 0.12×
- Total profit
- $-54,022
- Equity at exit
- $32,801
- IRR
- -30.7%
- Equity multiple
- -0.27×
- Total profit
- $-78,370
- Equity at exit
- $19,021
Cash invested: $61,597 (down + closing). Projections, not guarantees.
Landlord ↔ Tenant lean methodology
- Overall (STATE)
- 87 Strongly Landlord-Friendly
- State Texas
- 87 Strongly Landlord-Friendly · R+5
- County
- — inherits STATE
- City
- — inherits STATE
ZIP-level market 77301
- Home prices YoY
- -8.4%
- Rents YoY
- 1.4%
- Active inventory
- 486
- Price-to-rent
- 9.3×
Monthly cashflow live
- Estimated rent
- $1,967 medium interval (Pro) →
- Mortgage (P&I)
- −$1,154
- Tax from tax record
- −$514 /mo · $6,168/yr
- Insurance
- −$92
- HOA
- −$38
- Vacancy / Maint / Mgmt
- −$413
- Net cashflow
- $-244
Break-even live
UW: 25.0% down · 7.5% · 30yr · 1.5% tax · 5.0% vac · 8.0% maint · 8.0% mgmt
Financing live
Cash to close
- Down payment
- $54,998
- Closing costs
- $6,600
- Reserves months
- —
- Total cash needed
- —
Loan-product check · same deal, 3 products live
Conventional
25% down · 7.5% · 30yr
- Down + closing
- —
- Monthly P&I
- —
- Monthly cashflow
- —
- DSCR
- —
- Eligible?
- —
Personal DTI + credit; lowest rate.
DSCR
20% down · 8.5% · 30yr
- Down + closing
- —
- Monthly P&I
- —
- Monthly cashflow
- —
- DSCR
- —
- Eligible?
- —
No personal income docs; deal must DSCR.
Hard money
10% down · 12.0% · 12mo
- Down + closing
- —
- Monthly P&I
- —
- Monthly cashflow
- —
- DSCR
- —
- Eligible?
- —
Short-term bridge; refi at stabilization.
Rent comps 2 comps
| Address | Beds | Baths | Sqft | Rent | $/sqft | DOM | Units | Dist |
|---|---|---|---|---|---|---|---|---|
| 1058 Pleasant Bnd Conroe, TX | 3.0 | 2.0 | 1651 | $1,789 | $1.08 | 3d | 1 | 0.86mi |
| 994 Arbor Xing Conroe, TX | 3.0 | 2.0 | 1620 | $1,890 | $1.17 | 12d | 1 | 1.28mi |
HOA detail
- Monthly dues
- $38 · $456/yr
Listing history 24 events
-
2026-06-18days on market $219,990 Active 40 DOM
-
2026-06-17days on market $219,990 Active 39 DOM
-
2026-06-16days on market $219,990 Active 38 DOM
-
2026-06-15days on market $219,990 Active 37 DOM
-
2026-06-13days on market $219,990 Active 35 DOM
-
2026-06-09days on market $219,990 Active 31 DOM
-
2026-06-08days on market $219,990 Active 30 DOM
-
2026-06-08price $219,990 Active 29 DOM
-
2026-06-07days on market $224,880 Active 29 DOM
-
2026-06-04days on market $224,880 Active 26 DOM
-
2026-06-03days on market $224,880 Active 25 DOM
-
2026-06-02days on market $224,880 Active 24 DOM
-
2026-06-01days on market $224,880 Active 23 DOM
-
2026-05-31days on market $224,880 Active 22 DOM
-
2026-05-09$229,990 Active 718-char remark
-
2025-06-05historical
-
2025-05-03$229,990 Active
-
2025-05-02historical
-
2025-04-17$235,000 Active
-
2024-01-30soldstatus Sold
-
2023-11-27status Pending
-
2023-11-09price $224,990
-
2023-09-23price $229,990
-
2023-09-13$230,412 Active
ⓘ Source: listings_history table (triggers on properties + properties_extension) + one-shot
backfill from property_details.listing_events for pre-trigger history.
Tax reassessment forecast TX · Resets to sale price
- Current annual tax
- $6,168 · $514/mo
- Projected year-2 tax
- $6,168 · $514/mo
- Expected delta
- $0/yr ($0/mo · 0.0%)
ⓘ Screening estimate from a state-policy table — verify with the county assessor before closing.
Nearby sold comps map
Loading sold comps map…
Walkable amenities ~0.75 mi
Loading nearby amenities…
Taxation est. · year 1
- Rental income
- $23,601
- − Mortgage interest
- −$12,323
- − Property taxes
- −$6,168
- − Insurance
- −$1,100
- − Repairs & maintenance
- −$1,888
- − Management
- −$1,888
- − HOA
- −$456
- − Depreciation
- −$6,400
- Taxable loss
- −$6,622
- Est. tax savings @ 24.0%
- +$1,589
- After-tax cash flow
- $-1,334/yr
For passive investors: Depreciation is non-cash, so a rental often shows a tax loss while cash-flowing — sheltering income. Rental losses are passive: they offset passive income freely, and up to $25,000/yr can offset ordinary (W-2) income if you actively participate and your MAGI is under $100k (phasing out to $0 by $150k); unused losses carry forward. On sale, claimed depreciation is recaptured at up to 25%, and gains may owe capital-gains tax (a 1031 exchange can defer both). Figures are a year-1 estimate at your 24.0% rate — not tax advice; consult a CPA.
Condition & rehab AI · 12 photos
This move-in-ready single-family home in Conroe, TX, features a charming Pinewood floor plan with vinyl plank flooring, granite countertops, and stainless-steel appliances. The home is located in a convenient community with walking distance to schools and a playground.
Value-add opportunities
- Both landscaping — enhances curb appeal and adds value
- Both painting — refreshes interior and exterior
- Both window treatments — improves energy efficiency and aesthetics
Renovation cost estimate screening
Value-add ROI direction
- Both landscaping — enhances curb appeal and adds value ↑
- Both painting — refreshes interior and exterior ↑
- Both window treatments — improves energy efficiency and aesthetics ↑
ⓘ Cost ranges are severity-bucket heuristics (US national rule-of-thumb). Get contractor quotes + a written scope before underwriting a rehab budget.
Schools (NCES district)
- District
- Conroe ISD
- NCES district ID
- 4815000
- Math proficiency
- 57% ▼ -6.00%
- Reading proficiency
- 57% ▼ -1.00%
- Median HH income
- $71,541
- Composite
- 50.65/100
- National rank
- #1833
- State rank
- #69 of 826 in TX
Livability — Conroe
- Score
- 74/100
- State rank
- #169
- US rank
- #4447
Category grades
Schools grade is shown separately in the Schools card above.
Census & demographics
- Census place
- Conroe, TX
- County
- Montgomery County · 663,713 people
- City population
- 205,417
- Metro
- Houston-The Woodlands-Sugar Land, TX
- Population (ZIP)
- 37,769
- Household income
- $66,475
- Rent vs Own
- Severe rent burden
- 1256.0
Population outlook (Montgomery County) Hauer SSP2
- Today (2025)
- 713,896 people
- By 2030
- 805,263 · +12.8%
- By 2040
- 992,708 · +39.1%
- By 2050
- 1,179,590 · +65.2%
- By 2075
- 1,628,084 · +128.1%
- By 2100
- 1,937,880 · +171.5%
Race, ethnicity, and origin ACS 2023
- Neighborhood character
- Diverse neighborhood (Simpson 0.62)
- Race & ethnicity
- Hispanic / Latino 52% White 31% Two or more races 19% Black 13% Asian 2% Native American 2%
- Hispanic origin (detail)
- Mexican 37%
- Common ancestry
- Lithuanian 2% Slovak 1% Romanian 1%
- Foreign-born
- 27% · Canada, Jamaica
- Languages at home
- 51% English-only · Spanish 45% Other Asian/Pacific 2%
Political lean MEDSL · Montgomery
- 2024 margin
- Solid R (+45.5) · D 26.8% · R 72.3%
- 2008→2024 swing
- +7.2pp toward D · 2008: -52.7pp · 2024: -45.5pp
- All cycles
- 2024: R+45.5 2020: R+43.8 2016: R+51.4 2012: R+60.7 2008: R+52.7
Not yet ingested
- Civics
- —
Market trends
- HPI YoY
- ▼ -25.51%
- Current HPI
- 278.6662
- Rent YoY
- ▲ 1.43%
- Metro
- Houston-The Woodlands-Sugar Land, TX
- State GDP YoY
- ▲ 3.95%
- F500 in state
- 110
Industry mix (Fortune 500 HQ in TX)
| Industry | F500 HQs | Revenue |
|---|---|---|
| Energy | 16 | $1,198B |
|
||
| Technology | 5 | $198B |
|
||
| Engineering / Construction | 4 | $72B |
|
||
| Energy Services | 3 | $60B |
|
||
| Utilities | 3 | $41B |
|
||
| Healthcare | 2 | $330B |
|
||
Price history
-4.5% since first listed13 events — show timeline
- 2026-06-07 Price Changed $219,990 HARMLS
- 2026-06-05 Listed for Rent $1,750 HARMLS
- 2026-05-29 Price Changed $224,880 HARMLS
- 2026-05-09 Listed $229,990 HARMLS
- 2025-06-05 Listing Removed — HARMLS
- 2025-05-03 Listed $229,990 HARMLS
- 2025-05-02 Listing Removed — HARMLS
- 2025-04-17 Listed $235,000 HARMLS
- 2024-01-30 Sold (MLS) — HARMLS
- 2023-11-27 Pending — HARMLS
- 2023-11-09 Price Changed $224,990 HARMLS
- 2023-09-23 Price Changed $229,990 HARMLS
- 2023-09-13 Listed $230,412 HARMLS
Property tax history
+236.2%/yrLatest (2025): $6,168 · +54.8% YoY. Source: county tax records.
Cash-flow waterfall
monthlySold comps — $/sqft
last 12 mo · ≤1 miLoading sold comps…