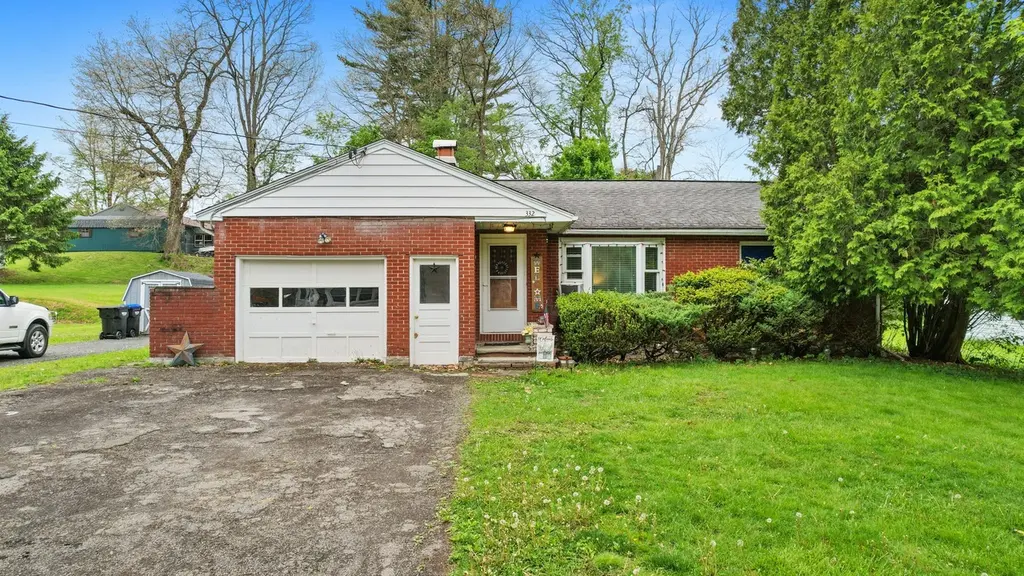
332 Midland Rd · Endicott, NY
Flood risk 6/10 · Moderate
- FEMA flood zone
- X
- Chance of flooding over 30 yrs
- 0.74%
- Est. flood insurance / yr
- $473 – $860
Fire risk 2/10 · Minimal
- Est. fire insurance / yr
- $691 – $1,283
Heat risk 3/10 · Minor
- Hot days now (above 92°F)
- 8 days/yr
- Hot days in 30 yrs
- 17 days/yr
Wind risk 2/10 · Minimal
- Chance of severe wind over 30 yrs
- 1.0%
Air-quality risk 2/10 · Minimal
- Unhealthy air days now
- 0 days/yr
- Unhealthy air days in 30 yrs
- 1 days/yr
Risk factors via First Street. Map © Google.
Why this score? — see what drove the F grade
The composite is a weighted blend of 9 inputs, each scored 0–100. Each bar is that input's sub-score; the figure is the points it added to the 100-point composite (weight × sub-score).
- Cash flow +7.3/30.0
- ARV discount +5.9/15.0
- Schools +5.7/10.0
- Livability +3.5/5.0
- 1% rule +3.0/10.0
- Rent growth +2.5/5.0
- Condition / age +2.5/5.0
- DSCR +1.4/10.0
- Appreciation +0.0/10.0
$149,900
🖨 Deal sheet (PDF) 📄 Offer letter ✓ Due diligence
Listing remarks
Cozy brick ranch in the Vestal school district offering easy one-floor living with added space in the finished lower level! This 3-bedroom, 1-bath home features hardwood floors throughout, a nice eat-in kitchen area, and a comfortable layout perfect for everyday living. The finished lower level provides additional living or entertaining space plus a large utility/bonus room ideal for a workshop, hobby area, gym, or extra storage. Enjoy outdoor living with a covered patio overlooking the large backyard.
Key facts
- Covered patio
- Eat-in kitchen
- Large flat backyard
Tags
Property features AI
Finance
- Other: Workshop on property
Exterior
- Parking: Attached garage (1 car)
- Utilities: Public water; Public sewer; Cable available
- Home design: Single-family residence; Residential property
- Construction: Aluminum siding and brick exterior; Above-grade finished area and finished lower level
- Exterior features: Covered patio
Interior
- Kitchen: Oven; Cooktop; Range; Dishwasher; Refrigerator; Gas water heater
- Flooring: Hardwood floors; Tile floors
- Bathrooms: 1 full bathroom
- Heating & cooling: Forced air heating
- Interior features: Wood-burning fireplace in the living room; Basement
Neighborhood map
What this means for you Summary
Snapshot
- This is a 3-bed/2.0-bath single-family listed at $150k.
Deal economics
- At list price, monthly cash flow is $-201 ($-2k/yr) — negative.
- To cash-flow at today's rent, offer at most $114k (23.7% below list).
- To meet the 1% rule (rent ≥ 1% of price), the offer needs to be $120k (19.9% below list).
- Recommended offer: $114k (23.7% below list) — sets the bar for cash-flow.
Location & tenants
- Location reads 70/100 on livability (#438 in NY) — a middle-class / working-renter tenant base. Strengths: cost of living A+, health & safety A+, housing A; Watch: amenities D, crime F, commute F.
- Vestal Central School District (suburban): math 63% / reading 68% proficiency, ranked #168 of 590 in NY (top 28%) — acceptable for families but not a draw, mixed tenant base, ~2y average lease; only 17% free/reduced lunch — higher-income household profile.
- Zoned schools: Clayton Avenue Elementary School (math 52% / reading 62%, grade C+, #842 of 2,108 statewide, top 43%, 248 students, 49% FRL) — zoned schools average 49% FRL vs 17% district-wide (31 pts higher); higher-poverty schools than district average — tighter screening recommended.
- Market conditions: 90 active listings in the ZIP; 1 comparable units currently listed for rent nearby; 340 units permitted in Broome County in 2024 (269 in 5+ unit buildings).
Forward outlook
- Local home prices are declining (-3.0%/yr); year-one equity from $1k of loan paydown is wiped out by about $4k of value loss. Plan a longer hold.
- Broome County population projected at -13% by 2050 — secular population decline; favor cash flow + early exit over multi-decade hold.
Negotiation context
- Only 12 days on market — expect competitive offers; lowballing is unlikely to land.
- 2 sale attempts with the ask held roughly flat each time — persistent listings suggest the price (not the market) is what's stuck; bring a comps-based counter.
Risks & watch-outs
- Watch-outs: built in 1950 — expect roof / HVAC / electrical / plumbing capex.
- Climate carrying-cost: major flood risk — expect insurance premiums to compound above CPI over the hold.
Questions for the listing agent
- What do current leases actually rent for vs. the listed asking? Can we see a recent rent roll and the last 12 months of T-12 income?
- Built in 1950 — when were the roof, HVAC, electrical panel, plumbing, and water heater last replaced?
- Is there a deadline driving the sale (1031 exchange, divorce, estate, relocation)? That informs how much negotiation room exists.
- Schools are D-rated, which usually means shorter tenancies and higher turnover. Who's the typical renter profile here, and what's been the actual vacancy rate?
- Crime grade is F in this area — have there been break-ins, vandalism, or insurance claims at this property in the last 3 years? What carrier currently insures it and at what premium?
- The area grade is low — what's the realistic commute time and amenity access for the typical tenant pool here? Any planned neighborhood developments (good or bad) we should know about?
- What's the average days-on-market for RENTAL listings here right now (not sales)? A rising rental-DOM trend means longer vacancies and softer asking-rent achievability than the comps imply.
- What's the recent tenant-quality profile in this submarket — average credit score on applications, eviction rate, late-payment / NSF rate, and stable-employment percentage? A property-management company in the area should have these aggregated.
- How much new for-sale + rental construction is in the pipeline within 1–3 miles? Heavy new supply typically softens prices + rents 12–24 months out; constrained supply supports both.
Investment metrics
- 1% rule
- 0.80% ✗
- Cap rate
- 4.69%
- Cash-on-cash
- -5.74%
- DSCR
- 0.74
- GRM
- 10.4
CMA / ARV
- ARV (on-the-fly)
- $144,840
- Comps found
- 2
Show comp detail 2 sales within ~0.75 mi
| Address | Dist | Beds/Ba | Sqft | Sold | Price | $/sf | Match |
|---|---|---|---|---|---|---|---|
| 2078 Owego Rd | 0.70mi | 3/1.0 | 972 (+14%) | 11mo | $165,000 | $170 | 30 |
| 747 Tobey Rd | 0.65mi | 2/1.0 (-1) | 942 (+11%) | 20mo | $90,000 | $96 | 26 |
Match score weights: distance 35% · size 25% · config 20% · recency 20%. Top-matched comps best support the ARV.
Projected returns pro-forma
-3.0% appreciation · 3.0% rent growth · sell at horizon
- IRR
- -26.1%
- Equity multiple
- 0.12×
- Total profit
- $-36,995
- Equity at exit
- $22,351
- IRR
- -22.6%
- Equity multiple
- -0.15×
- Total profit
- $-48,331
- Equity at exit
- $12,961
Cash invested: $41,972 (down + closing). Projections, not guarantees.
Landlord ↔ Tenant lean methodology
- Overall (STATE)
- 15 Strongly Tenant-Friendly
- State New York
- 15 Strongly Tenant-Friendly · D+10
- County
- — inherits STATE
- City
- — inherits STATE
ZIP-level market 13850
- Home prices YoY
- -33.5%
- Active inventory
- 90
- Price-to-rent
- 10.4×
Monthly cashflow live
- Estimated rent
- $1,200 medium interval (Pro) →
- Mortgage (P&I)
- −$786
- Tax from tax record
- −$300 /mo · $3,604/yr
- Insurance
- −$62
- HOA
- −$0
- Vacancy / Maint / Mgmt
- −$252
- Net cashflow
- $-201
Break-even live
Sensitivity live
| Price | -10% $-116 | -5% $-158 | +0% $-201 | +5% $-243 | +10% $-286 |
|---|---|---|---|---|---|
| Rent | -10% $-296 | -5% $-248 | +0% $-201 | +5% $-153 | +10% $-106 |
| Rate | -1.0pp $-125 | -0.5pp $-163 | base $-201 | +0.5pp $-240 | +1.0pp $-279 |
UW: 25.0% down · 7.5% · 30yr · 1.5% tax · 5.0% vac · 8.0% maint · 8.0% mgmt
Financing live
Cash to close
- Down payment
- $37,475
- Closing costs
- $4,497
- Reserves months
- —
- Total cash needed
- —
Loan-product check · same deal, 3 products live
Conventional
25% down · 7.5% · 30yr
- Down + closing
- —
- Monthly P&I
- —
- Monthly cashflow
- —
- DSCR
- —
- Eligible?
- —
Personal DTI + credit; lowest rate.
DSCR
20% down · 8.5% · 30yr
- Down + closing
- —
- Monthly P&I
- —
- Monthly cashflow
- —
- DSCR
- —
- Eligible?
- —
No personal income docs; deal must DSCR.
Hard money
10% down · 12.0% · 12mo
- Down + closing
- —
- Monthly P&I
- —
- Monthly cashflow
- —
- DSCR
- —
- Eligible?
- —
Short-term bridge; refi at stabilization.
Rent comps 1 comps
| Address | Beds | Baths | Sqft | Rent | $/sqft | DOM | Units | Dist |
|---|---|---|---|---|---|---|---|---|
| 17 Coventry Rd Unit 4 Endicott, NY | 2.0 | 1.0 | 725 | $1,200 | $1.66 | 22d | 1 | 1.09mi |
Listing history 7 events
-
2026-06-02status $149,900 Pending 12 DOM
-
2026-06-01days on market $149,900 Active 12 DOM
-
2026-05-31days on market $149,900 Active 11 DOM
-
2026-05-30days on market $149,900 Active 10 DOM
-
2026-05-21status Active
-
2026-05-20status Pending
-
2026-05-19$149,900 Active
ⓘ Source: listings_history table (triggers on properties + properties_extension) + one-shot
backfill from property_details.listing_events for pre-trigger history.
Tax reassessment forecast NY · Partial reset (capped growth)
- Current annual tax
- $3,604 · $300/mo
- Projected year-2 tax
- $3,604 · $300/mo
- Expected delta
- $0/yr ($0/mo · 0.0%)
ⓘ Screening estimate from a state-policy table — verify with the county assessor before closing.
Climate risk First Street
- Flood 6/10 Major FEMA zone X · 74% chance over 30 yrs
- Wildfire 2/10 Low
- Heat 3/10 Moderate 8 d/yr ≥92°F today · 17 d/yr by 30 yrs out
- Wind 2/10 Low 100% chance of damaging wind over 30 yrs
- Air quality 2/10 Low 0 unhealthy d/yr today · 1 by 30 yrs out
Nearby sold comps map
Loading sold comps map…
Walkable amenities ~0.75 mi
Loading nearby amenities…
Taxation est. · year 1
- Rental income
- $14,400
- − Mortgage interest
- −$8,397
- − Property taxes
- −$3,604
- − Insurance
- −$750
- − Repairs & maintenance
- −$1,152
- − Management
- −$1,152
- − Depreciation
- −$4,361
- Taxable loss
- −$5,015
- Est. tax savings @ 24.0%
- +$1,203
- After-tax cash flow
- $-1,207/yr
For passive investors: Depreciation is non-cash, so a rental often shows a tax loss while cash-flowing — sheltering income. Rental losses are passive: they offset passive income freely, and up to $25,000/yr can offset ordinary (W-2) income if you actively participate and your MAGI is under $100k (phasing out to $0 by $150k); unused losses carry forward. On sale, claimed depreciation is recaptured at up to 25%, and gains may owe capital-gains tax (a 1031 exchange can defer both). Figures are a year-1 estimate at your 24.0% rate — not tax advice; consult a CPA.
Schools (NCES district)
- District
- Vestal Central School District
- NCES district ID
- 3629610
- Math proficiency
- 63% ▼ -7.00%
- Reading proficiency
- 68% ▲ 4.00%
- Median HH income
- $64,143
- Composite
- 56.97/100
- National rank
- #1111
- State rank
- #168 of 590 in NY
Livability — Endicott
- Score
- 70/100
- State rank
- #438
- US rank
- #7657
Category grades
Schools grade is shown separately in the Schools card above.
Census & demographics
- City population
- 42,896
- Population (ZIP)
- 23,675
Population outlook (Broome County) Hauer SSP2
- Today (2025)
- 187,989 people
- By 2030
- 183,066 · -2.6%
- By 2040
- 172,228 · -8.4%
- By 2050
- 163,161 · -13.2%
- By 2075
- 153,641 · -18.3%
- By 2100
- 140,851 · -25.1%
Race, ethnicity, and origin ACS 2023
- Neighborhood character
- Predominantly White (78%)
- Race & ethnicity
- White 78% Asian 12% Hispanic / Latino 5% Two or more races 5% Black 2%
- Hispanic origin (detail)
- Puerto Rican 2%
- Common ancestry
- Romanian 6% Scotch-Irish 2% Italian 2%
- Foreign-born
- 14% · China, Canada, South Korea
- Languages at home
- 84% English-only · Chinese 6% Other Indo-European 5% Other Asian/Pacific 2%
Political lean MEDSL · Broome
- 2024 margin
- Toss-up / Even · D 50.2% · R 49.8%
- 2008→2024 swing
- -7.6pp toward R · 2008: 8.0pp · 2024: 0.4pp
- All cycles
- 2024: D+0.4 2020: D+3.5 2016: R+3.7 2012: D+4.6 2008: D+8.0
Not yet ingested
- Civics
- —
Market trends
- HPI YoY
- ▼ -142.14%
- Current HPI
- 282.4645
- Rent YoY
- —
- Metro
- —
- State GDP YoY
- ▲ 2.60%
- F500 in state
- 92
Industry mix (Fortune 500 HQ in NY)
| Industry | F500 HQs | Revenue |
|---|---|---|
| Financial Services | 10 | $950B |
|
||
| Consumer Goods | 9 | $162B |
|
||
| Insurance | 4 | $225B |
|
||
| Telecommunications | 2 | $144B |
|
||
| Pharmaceuticals | 2 | $112B |
|
||
| Media / Entertainment | 2 | $69B |
|
||
Price history
3 events — show timeline
- 2026-05-21 Relisted — GBAOR
- 2026-05-20 Pending — GBAOR
- 2026-05-19 Listed $149,900 GBAOR
Property tax history
+2.6%/yrLatest (2025): $3,604 · +1.8% YoY. Source: county tax records.
Cash-flow waterfall
monthlySold comps — $/sqft
last 12 mo · ≤1 miLoading sold comps…