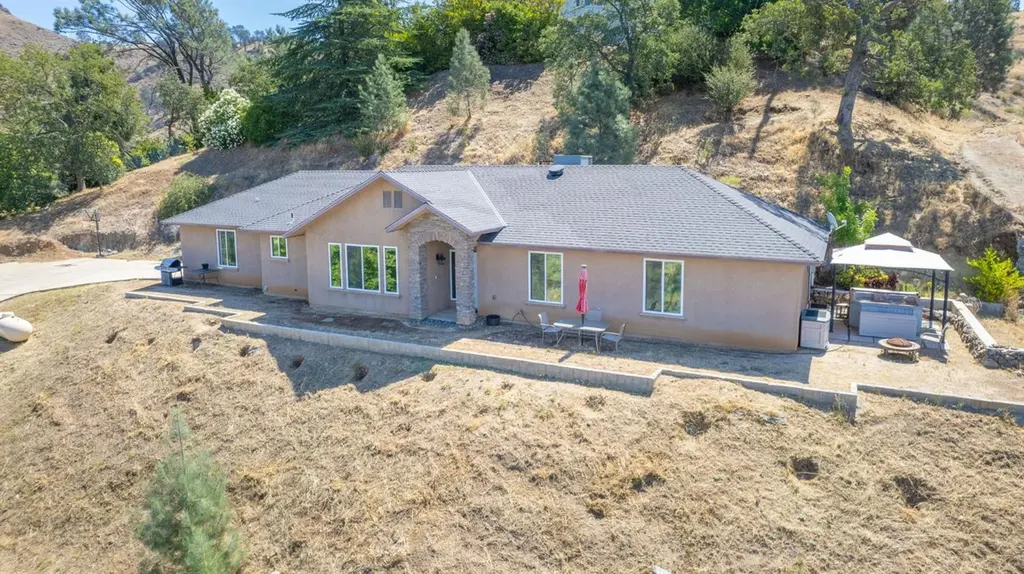
27306 El Lado Rd · Millerton, CA
Flood risk 1/10 · Minimal
- FEMA flood zone
- X (unshaded)
- Chance of flooding over 30 yrs
- 0.0%
- Est. flood insurance / yr
- $507 – $1,088
Fire risk 10/10 · Severe
- Est. fire insurance / yr
- $659 – $1,223
Heat risk 7/10 · Major
- Hot days now (above 107°F)
- 7 days/yr
- Hot days in 30 yrs
- 17 days/yr
Wind risk 1/10 · Minimal
- Chance of severe wind over 30 yrs
- —
Air-quality risk 10/10 · Severe
- Unhealthy air days now
- 61 days/yr
- Unhealthy air days in 30 yrs
- 69 days/yr
Risk factors via First Street. Map © Google.
Why this score? — see what drove the D- grade
The composite is a weighted blend of 9 inputs, each scored 0–100. Each bar is that input's sub-score; the figure is the points it added to the 100-point composite (weight × sub-score).
- Appreciation +10.0/10.0
- Cash flow +7.7/30.0
- ARV discount +4.0/15.0
- Schools +3.7/10.0
- Rent growth +2.5/5.0
- Livability +2.5/5.0
- Condition / age +2.5/5.0
- DSCR +1.8/10.0
- 1% rule +1.6/10.0
$430,000
🖨 Deal sheet (PDF) 📄 Offer letter ✓ Due diligence
Listing remarks
Nestled in the rolling foothills of Friant and overlooking the breathtaking beauty of Millerton Lake, this spacious 3-bedroom, 2-bath home offers a rare blend of comfort, privacy, and endless potential. Designed to capture the surrounding scenery, the home features generously sized rooms, beautiful granite countertops, a tankless water heater, and an expansive walk-in closet in the primary suite. Perched gracefully on the hillside, the property showcases stunning panoramic views where vibrant sunsets paint the sky and reflect across the lake, creating a truly unforgettable backdrop to everyday living. Tucked away on a private drive, the setting feels tranquil and secluded, yet remains just
Key facts
- 0.45 acre lot
- 2 garage spots
- Built 2009
Property features AI
Finance
- Other: Directions: From Millerton Rd, head north on Sky Harbour Rd; stay on Sky Harbour until El Lado Rd. Driveway to residence is on the right.; Located in Fresno County
Exterior
- Parking: 2-car garage
- Utilities: Electric service on; Public sewer; Public utilities available; Propane
- Home design: Single-family residence
- Construction: Stucco exterior; Composition roof; Concrete foundation; Built with public records as source of living area
- Exterior features: One level; Foothill lot setting
Interior
- Flooring: Carpet; Laminate
- Bathrooms: 2 bathrooms
- Heating & cooling: Central heat and air
- Interior features: Carpet and laminate flooring; Inside laundry with gas dryer hookup; Central heating and cooling
- Laundry & utility: Laundry located inside; Gas dryer hookup
Neighborhood map
What this means for you Summary
Snapshot
- This is a 3-bed/2.0-bath single-family listed at $430k.
Deal economics
- At list price, monthly cash flow is $-492 ($-6k/yr) — negative.
- To cash-flow at today's rent, offer at most $343k (20.2% below list).
- To meet the 1% rule (rent ≥ 1% of price), the offer needs to be $286k (33.6% below list).
- Recommended offer: $286k (33.6% below list) — sets the bar for 1% rule.
Location & tenants
- Location reads: area grade D — affects rentability + tenant quality, not the cash-flow math above.
- Sierra Unified (rural): math 31% / reading 51% proficiency, ranked #212 of 517 in CA (top 41%) — families likely to look elsewhere, expect single-tenant / working-renter base with shorter leases.
- Zoned schools: Foothill Elementary (math 37% / reading 48%, grade F, #552 of 1,571 statewide, top 35%, 660 students, 47% FRL); Sierra Junior High (math 32% / reading 57%, grade D, #130 of 498 statewide, top 27%, 185 students, 36% FRL); Sierra High (math 17% / reading 57%, grade F, #578 of 1,170 statewide, top 51%, 399 students, 32% FRL) — zoned schools at 38% FRL track the district average.
- Market conditions: 102 active listings in the ZIP; 2,426 units permitted in Fresno County in 2024 (296 in 5+ unit buildings).
Forward outlook
- In year one you build about $46k of equity ($3k loan paydown + $43k appreciation (10.0% local appreciation)).
- Fresno County population projected at +11% by 2050 — modest demand growth; plan on rents tracking national, not racing it.
- By year 2, paydown + projected appreciation supports a ~$74k cash-out refi (75% LTV) — recoverable capital for the next deal without selling this one.
Negotiation context
- Only 0 days on market — expect competitive offers; lowballing is unlikely to land.
- Current owner paid $95k; list at $430k implies a 353% gain — meaningful room to come down on a strong offer.
Risks & watch-outs
- Climate carrying-cost: severe wildfire risk; extreme-heat days projected 7→17/yr by 2055 (HVAC capex compounding) — expect insurance premiums to compound above CPI over the hold.
Questions for the listing agent
- What do current leases actually rent for vs. the listed asking? Can we see a recent rent roll and the last 12 months of T-12 income?
- Is there a deadline driving the sale (1031 exchange, divorce, estate, relocation)? That informs how much negotiation room exists.
- The area grade is low — what's the realistic commute time and amenity access for the typical tenant pool here? Any planned neighborhood developments (good or bad) we should know about?
- What's the average days-on-market for RENTAL listings here right now (not sales)? A rising rental-DOM trend means longer vacancies and softer asking-rent achievability than the comps imply.
- What's the recent tenant-quality profile in this submarket — average credit score on applications, eviction rate, late-payment / NSF rate, and stable-employment percentage? A property-management company in the area should have these aggregated.
- How much new for-sale + rental construction is in the pipeline within 1–3 miles? Heavy new supply typically softens prices + rents 12–24 months out; constrained supply supports both.
Investment metrics
- 1% rule
- 0.66% ✗
- Cap rate
- 4.92%
- Cash-on-cash
- -4.91%
- DSCR
- 0.78
- GRM
- 12.5
CMA / ARV
- ARV (on-the-fly)
- $399,252
- Comps found
- 5
Show comp detail 5 sales within ~0.75 mi
| Address | Dist | Beds/Ba | Sqft | Sold | Price | $/sf | Match |
|---|---|---|---|---|---|---|---|
| 27415 Sky Harbour Rd | 0.15mi | 4/2.5 (+1) | 2,077 (+1%) | 9mo | $790,000 | $380 | 77 |
| 27397 Aqua Vista Rd | 0.12mi | 3/2.0 | 2,192 (+6%) | 23mo | $425,000 | $194 | 65 |
| 28489 Perkins Rd | 0.46mi | 3/2.5 | 1,806 (-12%) | 18mo | $430,000 | $238 | 41 |
| 28162 Sky Harbour Rd | 0.38mi | 4/2.0 (+1) | 2,316 (+12%) | 22mo | $370,000 | $160 | 38 |
| 28162 Sky Harbour Rd | 0.38mi | 4/2.0 (+1) | 2,316 (+12%) | 22mo | $370,000 | $160 | 38 |
Match score weights: distance 35% · size 25% · config 20% · recency 20%. Top-matched comps best support the ARV.
Projected returns pro-forma
10.0% appreciation · 3.0% rent growth · sell at horizon
- IRR
- 20.8%
- Equity multiple
- 2.68×
- Total profit
- $202,747
- Equity at exit
- $387,378
- IRR
- 18.9%
- Equity multiple
- 6.16×
- Total profit
- $621,523
- Equity at exit
- $835,395
Cash invested: $120,400 (down + closing). Projections, not guarantees.
Landlord ↔ Tenant lean methodology
- Overall (STATE)
- 18 Strongly Tenant-Friendly
- State California
- 18 Strongly Tenant-Friendly · D+13
- County
- — inherits STATE
- City
- — inherits STATE
ZIP-level market 93626
- Home prices YoY
- 7.5%
- Active inventory
- 102
- Price-to-rent
- 12.5×
Monthly cashflow live
- Estimated rent
- $2,857 medium interval (Pro) →
- Mortgage (P&I)
- −$2,255
- Tax from tax record
- −$315 /mo · $3,782/yr
- Insurance
- −$179
- HOA
- −$0
- Vacancy / Maint / Mgmt
- −$600
- Net cashflow
- $-492
Break-even live
Sensitivity live
| Price | -10% $-249 | -5% $-371 | +0% $-492 | +5% $-614 | +10% $-736 |
|---|---|---|---|---|---|
| Rent | -10% $-718 | -5% $-605 | +0% $-492 | +5% $-379 | +10% $-267 |
| Rate | -1.0pp $-276 | -0.5pp $-383 | base $-492 | +0.5pp $-604 | +1.0pp $-717 |
UW: 25.0% down · 7.5% · 30yr · 1.5% tax · 5.0% vac · 8.0% maint · 8.0% mgmt
Financing live
Cash to close
- Down payment
- $107,500
- Closing costs
- $12,900
- Reserves months
- —
- Total cash needed
- —
Loan-product check · same deal, 3 products live
Conventional
25% down · 7.5% · 30yr
- Down + closing
- —
- Monthly P&I
- —
- Monthly cashflow
- —
- DSCR
- —
- Eligible?
- —
Personal DTI + credit; lowest rate.
DSCR
20% down · 8.5% · 30yr
- Down + closing
- —
- Monthly P&I
- —
- Monthly cashflow
- —
- DSCR
- —
- Eligible?
- —
No personal income docs; deal must DSCR.
Hard money
10% down · 12.0% · 12mo
- Down + closing
- —
- Monthly P&I
- —
- Monthly cashflow
- —
- DSCR
- —
- Eligible?
- —
Short-term bridge; refi at stabilization.
Listing history 3 events
-
2026-06-03days on market $430,000 Pending
-
2026-05-22$430,000 Active
-
2002-12-24soldstatus $95,000
ⓘ Source: listings_history table (triggers on properties + properties_extension) + one-shot
backfill from property_details.listing_events for pre-trigger history.
Tax reassessment forecast CA · Resets to sale price
- Current annual tax
- $3,782 · $315/mo
- Projected year-2 tax
- $3,782 · $315/mo
- Expected delta
- $0/yr ($0/mo · 0.0%)
ⓘ Screening estimate from a state-policy table — verify with the county assessor before closing.
Climate risk First Street
- Flood 1/10 Low FEMA zone X (unshaded) · 0% chance over 30 yrs
- Wildfire 10/10 Extreme
- Heat 7/10 Severe 7 d/yr ≥107°F today · 17 d/yr by 30 yrs out
- Wind 1/10 Low
- Air quality 10/10 Extreme 61 unhealthy d/yr today · 69 by 30 yrs out
Nearby sold comps map
Loading sold comps map…
Walkable amenities ~0.75 mi
Loading nearby amenities…
Taxation est. · year 1
- Rental income
- $34,285
- − Mortgage interest
- −$24,087
- − Property taxes
- −$3,782
- − Insurance
- −$2,150
- − Repairs & maintenance
- −$2,743
- − Management
- −$2,743
- − Depreciation
- −$12,509
- Taxable loss
- −$13,728
- Est. tax savings @ 24.0%
- +$3,295
- After-tax cash flow
- $-2,612/yr
For passive investors: Depreciation is non-cash, so a rental often shows a tax loss while cash-flowing — sheltering income. Rental losses are passive: they offset passive income freely, and up to $25,000/yr can offset ordinary (W-2) income if you actively participate and your MAGI is under $100k (phasing out to $0 by $150k); unused losses carry forward. On sale, claimed depreciation is recaptured at up to 25%, and gains may owe capital-gains tax (a 1031 exchange can defer both). Figures are a year-1 estimate at your 24.0% rate — not tax advice; consult a CPA.
Schools (NCES district)
- District
- Sierra Unified
- NCES district ID
- 0636805
- Math proficiency
- 31% ▼ -4.00%
- Reading proficiency
- 51% ▲ 1.00%
- Median HH income
- $67,384
- Composite
- 36.91/100
- National rank
- #4539
- State rank
- #212 of 517 in CA
Livability — Millerton
No livability data for this city. (Only ~50 U.S. cities are tracked.)
Census & demographics
- Population (ZIP)
- 3,039
Population outlook (Fresno County) Hauer SSP2
- Today (2025)
- 1,042,971 people
- By 2030
- 1,072,198 · +2.8%
- By 2040
- 1,122,408 · +7.6%
- By 2050
- 1,157,251 · +11.0%
- By 2075
- 1,182,575 · +13.4%
- By 2100
- 1,105,899 · +6.0%
Race, ethnicity, and origin ACS 2023
- Neighborhood character
- Predominantly White (67%)
- Race & ethnicity
- White 67% Hispanic / Latino 16% Two or more races 16% Asian 6% Black 3% Native American 1%
- Hispanic origin (detail)
- Mexican 13%
- Common ancestry
- Italian 5% Lithuanian 3% Slovak 1%
- Foreign-born
- 6% · Canada, Vietnam
- Languages at home
- 90% English-only · Spanish 7% Other Indo-European 1% Chinese 1%
Political lean MEDSL · Fresno
- 2024 margin
- Toss-up / Even · D 46.5% · R 50.9% · Other 2.6%
- 2008→2024 swing
- -6.5pp toward R · 2008: 2.1pp · 2024: -4.4pp
- All cycles
- 2024: R+4.4 2020: D+7.8 2016: D+3.9 2012: R+2.9 2008: D+2.1
Not yet ingested
- Civics
- —
Market trends
- HPI YoY
- ▲ 23.30%
- Current HPI
- 334.9049
- Rent YoY
- —
- Metro
- —
- State GDP YoY
- ▲ 3.21%
- F500 in state
- 116
Industry mix (Fortune 500 HQ in CA)
| Industry | F500 HQs | Revenue |
|---|---|---|
| Technology | 27 | $1,492B |
|
||
| Financial Services | 3 | $174B |
|
||
| Retail | 3 | $44B |
|
||
| Insurance | 3 | $26B |
|
||
| Media / Entertainment | 2 | $115B |
|
||
| Pharmaceuticals / Biotech | 2 | $62B |
|
||
Price history
+352.6% since first listed2 events — show timeline
- 2026-05-22 Listed $430,000 FRESNOMLS
- 2002-12-24 Sold (Public Records) $95,000 Public Records
Property tax history
+2.2%/yrLatest (2025): $3,782 · +5.9% YoY. Source: county tax records.
Cash-flow waterfall
monthlySold comps — $/sqft
last 12 mo · ≤1 miLoading sold comps…