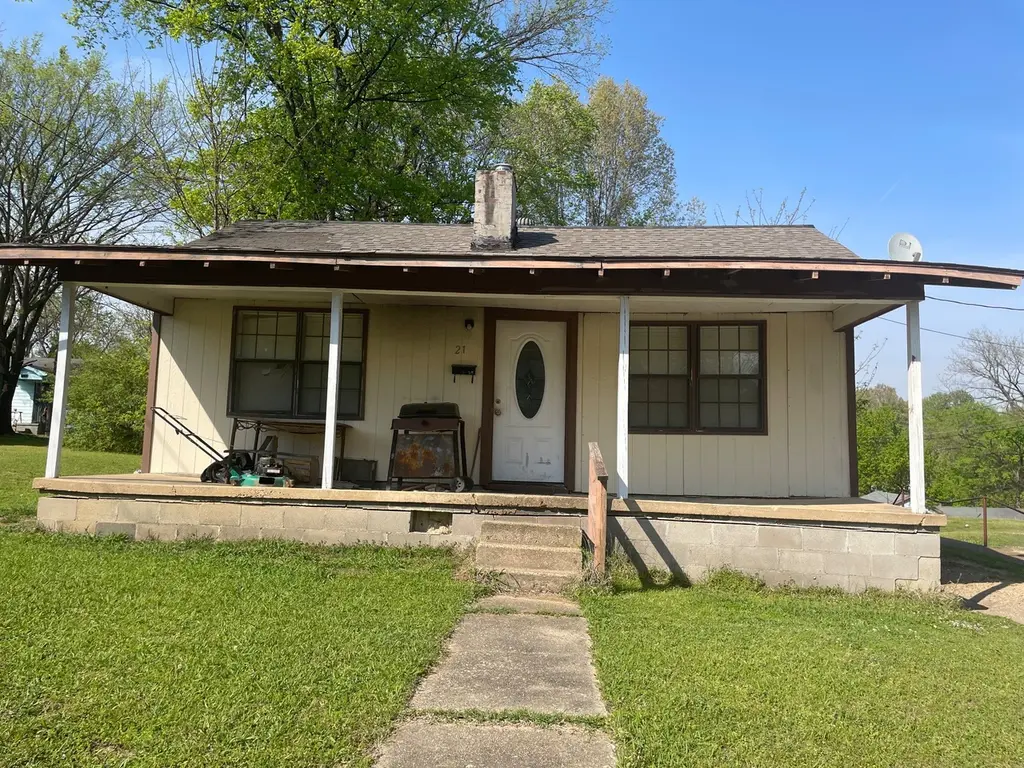
219 Spring St · Ripley, TN
Flood risk 1/10 · Minimal
- FEMA flood zone
- X (unshaded)
- Chance of flooding over 30 yrs
- 0.0%
- Est. flood insurance / yr
- $507 – $1,088
Fire risk 3/10 · Minor
- Est. fire insurance / yr
- $949 – $1,763
Heat risk 6/10 · Moderate
- Hot days now (above 109°F)
- 7 days/yr
- Hot days in 30 yrs
- 21 days/yr
Wind risk 4/10 · Minor
- Chance of severe wind over 30 yrs
- 10.0%
Air-quality risk 2/10 · Minimal
- Unhealthy air days now
- 1 days/yr
- Unhealthy air days in 30 yrs
- 2 days/yr
Risk factors via First Street. Map © Google.
Why this score? — see what drove the B+ grade
The composite is a weighted blend of 9 inputs, each scored 0–100. Each bar is that input's sub-score; the figure is the points it added to the 100-point composite (weight × sub-score).
- Cash flow +30.0/30.0
- 1% rule +10.0/10.0
- DSCR +10.0/10.0
- Appreciation +10.0/10.0
- ARV discount +7.5/15.0
- Livability +2.9/5.0
- Rent growth +2.5/5.0
- Condition / age +2.5/5.0
- Schools +1.1/10.0
$27,000
🖨 Deal sheet 📄 Offer letter ✓ Due diligence
Listing remarks
Attention investors and DIY enthusiasts! Multiple exit strategies: finish this remodel then either flip, rent or move in! Home being sold as is. Cash preferred but will consider financed all offers.
Key facts
- 4,791 sq ft lot
- Built 1934
- Listed 41 days
Property features AI
Finance
- Financial info: Annual tax amount recorded
Exterior
- Parking: No covered parking reported; No off-street parking total reported
- Utilities: Public water; Public sewer; Water available
- Home design: Single-family residence; One story; Existing structure
- Construction: Other construction materials
- Exterior features: Lot about 0.11 acres (50 x 100)
Interior
- Kitchen: No appliances included
- Bedrooms: 2 bedrooms (both on the main level)
- Flooring: Other
- Bathrooms: 1 full bathroom
- Heating & cooling: Heating present (other type); Cooling present (other type)
- Interior features: No basement; Other flooring
- Laundry & utility: No laundry appliances listed
Neighborhood map
What this means for you Summary
Snapshot
- This is a 2-bed/1.0-bath single-family listed at $27k.
Deal economics
- At list price, monthly cash flow is $499 ($6k/yr) — positive.
- The deal already cash-flows at list — no discount required.
- Meets the 1% rule at list price ($852 rent vs $27k).
- Recommended offer: $26k (3.0% below list) — sets the bar for market timing.
Location & tenants
- Location reads 58/100 on livability (#310 in TN) — a working-class tenant base; expect higher turnover. Strengths: cost of living A+, health & safety A+, housing A-; Watch: crime F, amenities F, commute F.
- Lauderdale County (town): math 12% / reading 16% proficiency, ranked #132 of 139 in TN (top 95%) — low school quality limits family demand, transient renter base, plan for 1-2y turnover; 70% free/reduced lunch — lower-income household profile, screen leases tightly.
- Zoned schools: Ripley Elementary (math 9% / reading 14%, grade F, #805 of 952 statewide, top 85%, 480 students, 0% FRL); Ripley High School (math 8% / reading 17%, grade F, #259 of 332 statewide, top 79%, 658 students, 0% FRL) — zoned schools average 0% FRL vs 70% district-wide (70 pts lower); this property's tenant base skews higher-income than the district average.
- Market conditions: 96 active listings in the ZIP; 24 units permitted in Lauderdale County in 2024 (0 in 5+ unit buildings).
Forward outlook
- In year one you build about $3k of equity ($187 loan paydown + $3k appreciation (10.0% local appreciation)).
- Lauderdale County population projected at -15% by 2050 — secular population decline; favor cash flow + early exit over multi-decade hold.
- At projected returns (10.0% appreciation + 3.0% rent growth), your $8k cash investment doubles in ~1 year — after that, you're playing with house money.
- By year 10, paydown + projected appreciation supports a ~$35k cash-out refi (75% LTV) — recoverable capital for the next deal without selling this one.
Negotiation context
- It's been on market 41 days — a 3% lower offer ($26k) is reasonable based on typical stale-listing flexibility.
Risks & watch-outs
- Watch-outs: built in 1934 — expect roof / HVAC / electrical / plumbing capex.
- Climate carrying-cost: extreme-heat days projected 7→21/yr by 2055 (HVAC capex compounding) — expect insurance premiums to compound above CPI over the hold.
Questions for the listing agent
- It's been on market 41 days. Have you received any prior offers? Is the seller open to a 3% concession, seller financing, or rate buy-down credit?
- Built in 1934 — when were the roof, HVAC, electrical panel, plumbing, and water heater last replaced?
- Is there a deadline driving the sale (1031 exchange, divorce, estate, relocation)? That informs how much negotiation room exists.
- Schools are F-rated, which usually means shorter tenancies and higher turnover. Who's the typical renter profile here, and what's been the actual vacancy rate?
- Crime grade is F in this area — have there been break-ins, vandalism, or insurance claims at this property in the last 3 years? What carrier currently insures it and at what premium?
- What's the average days-on-market for RENTAL listings here right now (not sales)? A rising rental-DOM trend means longer vacancies and softer asking-rent achievability than the comps imply.
- What's the recent tenant-quality profile in this submarket — average credit score on applications, eviction rate, late-payment / NSF rate, and stable-employment percentage? A property-management company in the area should have these aggregated.
- How much new for-sale + rental construction is in the pipeline within 1–3 miles? Heavy new supply typically softens prices + rents 12–24 months out; constrained supply supports both.
Investment metrics
- 1% rule
- 3.16% ✓
- Cap rate
- 28.47%
- Cash-on-cash
- 79.21%
- DSCR
- 4.52
- GRM
- 2.6
CMA / ARV
- ARV (median comp)
- $135,571
- List price
- $27,000
- Delta
- -80.08%
- Verdict
- UNDERPRICED
- Comps
- 1 within 2.0 mi
Projected returns pro-forma
10.0% appreciation · 3.0% rent growth · sell at horizon
- IRR
- 89.2%
- Equity multiple
- 7.15×
- Total profit
- $46,492
- Equity at exit
- $24,324
- IRR
- 83.9%
- Equity multiple
- 15.81×
- Total profit
- $111,930
- Equity at exit
- $52,455
Cash invested: $7,560 (down + closing). Projections, not guarantees.
Landlord ↔ Tenant lean methodology
- Overall (STATE)
- 87 Strongly Landlord-Friendly
- State Tennessee
- 87 Strongly Landlord-Friendly · R+13
- County
- — inherits STATE
- City
- — inherits STATE
ZIP-level market 38063
- Home prices YoY
- 4.7%
- Active inventory
- 96
- Price-to-rent
- 2.6×
Monthly cashflow live
- Estimated rent
- $852 medium interval (Pro) →
- Mortgage (P&I)
- −$142
- Tax from tax record
- −$21 /mo · $255/yr
- Insurance
- −$11
- HOA
- −$0
- Vacancy / Maint / Mgmt
- −$179
- Net cashflow
- $499
Break-even live
UW: 25.0% down · 7.5% · 30yr · 1.5% tax · 5.0% vac · 8.0% maint · 8.0% mgmt
Financing live
Cash to close
- Down payment
- $6,750
- Closing costs
- $810
- Reserves months
- —
- Total cash needed
- —
Loan-product check · same deal, 3 products live
Conventional
25% down · 7.5% · 30yr
- Down + closing
- —
- Monthly P&I
- —
- Monthly cashflow
- —
- DSCR
- —
- Eligible?
- —
Personal DTI + credit; lowest rate.
DSCR
20% down · 8.5% · 30yr
- Down + closing
- —
- Monthly P&I
- —
- Monthly cashflow
- —
- DSCR
- —
- Eligible?
- —
No personal income docs; deal must DSCR.
Hard money
10% down · 12.0% · 12mo
- Down + closing
- —
- Monthly P&I
- —
- Monthly cashflow
- —
- DSCR
- —
- Eligible?
- —
Short-term bridge; refi at stabilization.
Listing history 7 events
-
2026-06-05status $27,000 Pending 41 DOM
-
2026-06-03days on market $27,000 Active 41 DOM
-
2026-06-02days on market $27,000 Active 40 DOM
-
2026-06-01days on market $27,000 Active 39 DOM
-
2026-05-31days on market $27,000 Active 38 DOM
-
2026-05-30days on market $27,000 Active 37 DOM
-
2026-04-23$27,000 Active 198-char remark
ⓘ Source: listings_history table (triggers on properties + properties_extension) + one-shot
backfill from property_details.listing_events for pre-trigger history.
Tax reassessment forecast TN · Resets to sale price
- Current annual tax
- $255 · $21/mo
- Projected year-2 tax
- $255 · $21/mo
- Expected delta
- $0/yr ($0/mo · 0.0%)
ⓘ Screening estimate from a state-policy table — verify with the county assessor before closing.
Climate risk First Street
- Flood 1/10 Low FEMA zone X (unshaded) · 0% chance over 30 yrs
- Wildfire 3/10 Moderate
- Heat 6/10 Major 7 d/yr ≥109°F today · 21 d/yr by 30 yrs out
- Wind 4/10 Moderate 10% chance of damaging wind over 30 yrs
- Air quality 2/10 Low 1 unhealthy d/yr today · 2 by 30 yrs out
Nearby sold comps map
Loading sold comps map…
Walkable amenities ~0.75 mi
Loading nearby amenities…
Taxation est. · year 1
- Rental income
- $10,224
- − Mortgage interest
- −$1,512
- − Property taxes
- −$255
- − Insurance
- −$135
- − Repairs & maintenance
- −$818
- − Management
- −$818
- − Depreciation
- −$785
- Taxable income
- $5,901
- Est. tax owed @ 24.0%
- −$1,416
- After-tax cash flow
- $4,572/yr
For passive investors: Depreciation is non-cash, so a rental often shows a tax loss while cash-flowing — sheltering income. Rental losses are passive: they offset passive income freely, and up to $25,000/yr can offset ordinary (W-2) income if you actively participate and your MAGI is under $100k (phasing out to $0 by $150k); unused losses carry forward. On sale, claimed depreciation is recaptured at up to 25%, and gains may owe capital-gains tax (a 1031 exchange can defer both). Figures are a year-1 estimate at your 24.0% rate — not tax advice; consult a CPA.
Schools (NCES district)
- District
- Lauderdale County
- NCES district ID
- 4702310
- Math proficiency
- 12% ▼ -21.00%
- Reading proficiency
- 16% ▼ -9.00%
- Median HH income
- $33,108
- Composite
- 11.31/100
- National rank
- #9717
- State rank
- #132 of 139 in TN
Livability — Ripley
- Score
- 58/100
- State rank
- #310
- US rank
- #21139
Category grades
Schools grade is shown separately in the Schools card above.
Census & demographics
- Census place
- Ripley, TN
- Population (ZIP)
- 15,947
Population outlook (Lauderdale County) Hauer SSP2
- Today (2025)
- 26,081 people
- By 2030
- 25,421 · -2.5%
- By 2040
- 23,824 · -8.7%
- By 2050
- 22,283 · -14.6%
- By 2075
- 19,016 · -27.1%
- By 2100
- 15,472 · -40.7%
Race, ethnicity, and origin ACS 2023
- Neighborhood character
- Majority White (57%)
- Race & ethnicity
- White 57% Black 37% Two or more races 4% Hispanic / Latino 1%
- Common ancestry
- Italian 1% Serbian 1%
- Foreign-born
- 1% · Canada
- Languages at home
- 98% English-only · Spanish 1%
Political lean MEDSL · Lauderdale
- 2024 margin
- Solid R (+37.0) · D 31.1% · R 68.2%
- 2008→2024 swing
- -30.5pp toward R · 2008: -6.5pp · 2024: -37.0pp
- All cycles
- 2024: R+37.0 2020: R+27.7 2016: R+14.2 2012: R+7.0 2008: R+6.5
Not yet ingested
- Civics
- —
Market trends
- HPI YoY
- ▲ 11.78%
- Current HPI
- 264.5191
- Rent YoY
- —
- Metro
- —
- State GDP YoY
- ▲ 2.78%
- F500 in state
- 22
Industry mix (Fortune 500 HQ in TN)
| Industry | F500 HQs | Revenue |
|---|---|---|
| Healthcare | 3 | $91B |
|
||
| Retail | 3 | $72B |
|
||
| Transportation / Logistics | 1 | $88B |
|
||
| Paper / Packaging | 1 | $19B |
|
||
| Insurance | 1 | $13B |
|
||
| Energy | 1 | $12B |
|
||
Price history
2 events — show timeline
- 2026-06-03 Pending — REALTRACS as Distributed by MLS Grid
- 2026-04-23 Listed $27,000 REALTRACS as Distributed by MLS Grid
Property tax history
+4.0%/yrLatest (2025): $255 · +2.0% YoY. Source: county tax records.
Cash-flow waterfall
monthlySold comps — $/sqft
last 12 mo · ≤1 miLoading sold comps…