 6-Plex
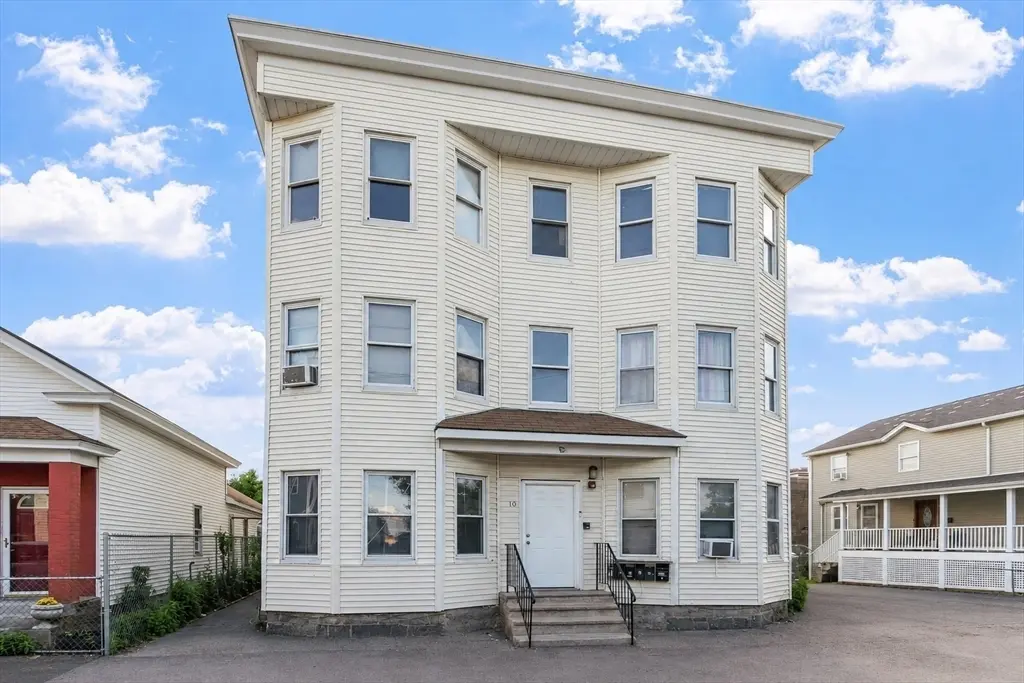
10 Kempton Ct · Lawrence, MA
Flood risk 8/10 · Major
- FEMA flood zone
- X (shaded)
- Chance of flooding over 30 yrs
- 0.99%
- Est. flood insurance / yr
- $507 – $1,088
Fire risk 1/10 · Minimal
- Est. fire insurance / yr
- $915 – $1,699
Heat risk 5/10 · Moderate
- Hot days now (above 98°F)
- 7 days/yr
- Hot days in 30 yrs
- 16 days/yr
Wind risk 6/10 · Moderate
- Chance of severe wind over 30 yrs
- 27.0%
Air-quality risk 2/10 · Minimal
- Unhealthy air days now
- 2 days/yr
- Unhealthy air days in 30 yrs
- 2 days/yr
Risk factors via First Street. Map © Google.
Why this score? — see what drove the D- grade
The composite is a weighted blend of 9 inputs, each scored 0–100. Each bar is that input's sub-score; the figure is the points it added to the 100-point composite (weight × sub-score).
- Cash flow +17.4/30.0
- DSCR +5.4/10.0
- 1% rule +3.6/10.0
- Livability +3.5/5.0
- Rent growth +2.5/5.0
- Condition / age +2.5/5.0
- Schools +1.2/10.0
- ARV discount +0.0/15.0
- Appreciation +0.0/10.0
$1,500,000
🖨 Deal sheet (PDF) 📄 Offer letter ✓ Due diligence
Multi-family units
County records classify this as Multi-Family (5+ Unit). Listing-text estimate: 6 units. confirmed
5+ unit building — per-unit beds/baths from public records are typically unavailable; the breakdown below (if shown) is an estimate from the listing text.
Listing remarks MLS
6 Family on a dead end street with lead certificates on file All newer furnaces / hot water tanks metered seperately, state of the art Sprinkler system already installed meticulous basement, clean premises and 5 Units currently occupied. parking in front lot and side lot ...Cash cow. Projected $57,600 annual income. All 2 bedroom units. This is a great investment.
Key facts
- Strong cash flow
- Long-term upside
- Newer roof
Tags
Property features AI
Finance
- HOA & community: Community near public transportation, shopping, parks, medical facility, laundromat, and public school; Not a senior community
Exterior
- Parking: Paved off-street parking; 8 open parking spaces (total 8)
- Utilities: Public water; Public sewer; Electric with circuit breakers; Gas available for range
- Home design: 5+ unit multi-family property (5+ units up/down); 3 stories
- Construction: Frame construction; Stone foundation; Built year per public records
- Exterior features: Easements on the lot; Public road frontage; Rubber roof
Interior
- Kitchen: Range; Refrigerator
- Flooring: Vinyl flooring; Laminate flooring
- Bathrooms: 6 full bathrooms
- Heating & cooling: Natural gas heating (6 heating units/zones); Window cooling units; Has heating; Has cooling
- Interior features: Living room; Kitchen; Total of 24 rooms
Neighborhood map
What this means for you Summary
Snapshot
- This is a 6 × 2-bed/1.0-bath units multifamily listed at $1.50M.
Deal economics
- At list price, monthly cash flow is $1k ($13k/yr) — positive. Per door: $175/mo.
- The deal already cash-flows at list — no discount required.
- To meet the 1% rule (rent ≥ 1% of price), the offer needs to be $1.29M (13.8% below list).
- Recommended offer: $1.29M (13.8% below list) — sets the bar for 1% rule.
- Cap rate 7.2% vs local median 4.0% in Lawrence — top-decile yield for the area; either an underpriced asset or a hidden risk that comps aren't pricing in. Stress-test before assuming the spread holds.
Location & tenants
- Location reads 70/100 on livability (#133 in MA) — a middle-class / working-renter tenant base. Strengths: commute A+, health & safety A+; Watch: crime C-, amenities D, employment D-.
- Lawrence (suburban): math 10% / reading 19% proficiency, ranked #300 of 302 in MA (top 99%) — low school quality limits family demand, transient renter base, plan for 1-2y turnover; 83% free/reduced lunch — lower-income household profile, screen leases tightly.
- Zoned schools: Lawrence High School (math 21% / reading 30%, grade F, #284 of 343 statewide, top 83%, 3,084 students, 0% FRL) — zoned schools average 0% FRL vs 83% district-wide (83 pts lower); this property's tenant base skews higher-income than the district average.
- Market conditions: 15 active listings in the ZIP; 1,032 units permitted in Essex County in 2024 (590 in 5+ unit buildings).
Forward outlook
- Local home prices are declining (-3.0%/yr); year-one equity from $10k of loan paydown is wiped out by about $45k of value loss. Plan a longer hold.
- Essex County population projected at +15% by 2050 — long-run rental-demand tailwind backs the buy-and-hold thesis.
Negotiation context
- It's been on market 18 days — a 2% lower offer ($1.48M) is reasonable based on typical stale-listing flexibility.
- 4 sale attempts since 13y ago with the ask held roughly flat each time — persistent listings suggest the price (not the market) is what's stuck; bring a comps-based counter.
- Current owner paid $360k; list at $1.50M implies a 317% gain — meaningful room to come down on a strong offer.
Risks & watch-outs
- Watch-outs: flood insurance adds $66/mo; built in 1920 — expect roof / HVAC / electrical / plumbing capex.
- Climate carrying-cost: severe flood risk; major wind risk, 27% chance of damaging wind over 30y; extreme-heat days projected 7→16/yr by 2055 (HVAC capex compounding) — expect insurance premiums to compound above CPI over the hold.
Questions for the listing agent
- Can we see the unit-by-unit rent roll, current vacancy, and any below-market leases? What's the average tenancy length?
- What capital expenditures (roof, boiler, parking lot, exteriors) have been made in the last 5 years, and what's planned in the next 2?
- Built in 1920 — when were the roof, HVAC, electrical panel, plumbing, and water heater last replaced?
- What's the actual annual flood-insurance premium (NFIP or private), and is the property in a SFHA with mandatory coverage?
- Is there a deadline driving the sale (1031 exchange, divorce, estate, relocation)? That informs how much negotiation room exists.
- Schools are D-rated, which usually means shorter tenancies and higher turnover. Who's the typical renter profile here, and what's been the actual vacancy rate?
- The area grade is low — what's the realistic commute time and amenity access for the typical tenant pool here? Any planned neighborhood developments (good or bad) we should know about?
- What's the average days-on-market for RENTAL listings here right now (not sales)? A rising rental-DOM trend means longer vacancies and softer asking-rent achievability than the comps imply.
- What's the recent tenant-quality profile in this submarket — average credit score on applications, eviction rate, late-payment / NSF rate, and stable-employment percentage? A property-management company in the area should have these aggregated.
- How much new apartment / multifamily construction is in the pipeline within 1–3 miles? Heavy new supply (>2% of stock underway) typically softens rents 12–24 months out; light construction supports rent growth.
Investment metrics
- 1% rule
- 0.86% ✗
- Cap rate
- 7.18%
- Cash-on-cash
- 3.18%
- DSCR
- 1.14
- GRM
- 9.7
CMA / ARV
- ARV (on-the-fly)
- $1,204,416
- Comps found
- 3
Show comp detail 3 sales within ~0.75 mi
| Address | Dist | Beds/Ba | Sqft | Sold | Price | $/sf | Match |
|---|---|---|---|---|---|---|---|
| 44-46 Butler St | 0.26mi | 10/5.5 (+1) | 5,556 (-0%) | 5mo | $1,325,000 | $238 | 76 |
| 274-276 Hampshire St | 0.48mi | 9/6.0 | 5,844 (+5%) | 20mo | $1,263,000 | $216 | 53 |
| 36 Manchester St | 0.60mi | 10/3.0 (+1) | 5,072 (-9%) | 1mo | $860,000 | $170 | 40 |
Match score weights: distance 35% · size 25% · config 20% · recency 20%. Top-matched comps best support the ARV.
Projected returns pro-forma
-3.0% appreciation · 3.0% rent growth · sell at horizon
- IRR
- -11.6%
- Equity multiple
- 0.58×
- Total profit
- $-176,871
- Equity at exit
- $223,655
- IRR
- -2.5%
- Equity multiple
- 0.83×
- Total profit
- $-70,291
- Equity at exit
- $129,693
Cash invested: $420,000 (down + closing). Projections, not guarantees.
Landlord ↔ Tenant lean methodology
- Overall (STATE)
- 20 Strongly Tenant-Friendly
- State Massachusetts
- 20 Strongly Tenant-Friendly · D+15
- County
- — inherits STATE
- City
- — inherits STATE
ZIP-level market 01841
- Home prices YoY
- -21.6%
- Active inventory
- 15
- Price-to-rent
- 58.0×
Monthly cashflow live
- Estimated rent
- $12,926 high interval (Pro) →
- Mortgage (P&I)
- −$7,866
- Tax from tax record
- −$606 /mo · $7,273/yr
- Insurance
- −$625
- Flood insurance flood zone
- −$66 /mo · $798/yr
- HOA
- −$0
- Lot rent
- −$0
- Vacancy / Maint / Mgmt
- −$2,714
- Net cashflow
- $1,048
Break-even live
Sensitivity live
| Price | -10% $1,897 | -5% $1,472 | +0% $1,048 | +5% $623 | +10% $199 |
|---|---|---|---|---|---|
| Rent | -10% $27 | -5% $537 | +0% $1,048 | +5% $1,558 | +10% $2,069 |
| Rate | -1.0pp $1,803 | -0.5pp $1,429 | base $1,048 | +0.5pp $659 | +1.0pp $264 |
6-unit breakdown (identical units grouped — click to expand)
| Units | Beds | Baths | Est. rent |
|---|---|---|---|
| 6× units | 2 | 1 | $12,924 |
| #1 | 2 | 1 | $2,154 |
| #2 | 2 | 1 | $2,154 |
| #3 | 2 | 1 | $2,154 |
| #4 | 2 | 1 | $2,154 |
| #5 | 2 | 1 | $2,154 |
| #6 | 2 | 1 | $2,154 |
| Total (6 units) | $12,926 | ||
UW: 25.0% down · 7.5% · 30yr · 1.5% tax · 5.0% vac · 8.0% maint · 8.0% mgmt
Financing live
Cash to close
- Down payment
- $375,000
- Closing costs
- $45,000
- Reserves months
- —
- Total cash needed
- —
Loan-product check · same deal, 3 products live
Conventional
25% down · 7.5% · 30yr
- Down + closing
- —
- Monthly P&I
- —
- Monthly cashflow
- —
- DSCR
- —
- Eligible?
- —
Personal DTI + credit; lowest rate.
DSCR
20% down · 8.5% · 30yr
- Down + closing
- —
- Monthly P&I
- —
- Monthly cashflow
- —
- DSCR
- —
- Eligible?
- —
No personal income docs; deal must DSCR.
Hard money
10% down · 12.0% · 12mo
- Down + closing
- —
- Monthly P&I
- —
- Monthly cashflow
- —
- DSCR
- —
- Eligible?
- —
Short-term bridge; refi at stabilization.
Listing history 12 events
-
2026-06-22days on market $1,500,000 Active 18 DOM
-
2026-06-21days on market $1,500,000 Active 17 DOM
-
2026-06-18days on market $1,500,000 Active 14 DOM
-
2026-06-17days on market $1,500,000 Active 13 DOM
-
2026-06-16days on market $1,500,000 Active 12 DOM
-
2026-06-15days on market $1,500,000 Active 11 DOM
-
2026-06-13days on market $1,500,000 Active 9 DOM
-
2026-06-13days on market $1,500,000 Active 8 DOM
-
2026-06-09days on market $1,500,000 Active 5 DOM
-
2026-06-08statusdays on market $1,500,000 Active 4 DOM
-
2026-06-07remarks 699-char remark
-
2026-06-07$1,500,000 New 3 DOM
ⓘ Source: listings_history table (triggers on properties + properties_extension) + one-shot
backfill from property_details.listing_events for pre-trigger history.
Tax reassessment forecast MA · Partial reset (capped growth)
- Current annual tax
- $7,273 · $606/mo
- Projected year-2 tax
- $12,862 · $1,072/mo
- Expected delta
- +$5,588/yr (+$466/mo · 76.8%)
ⓘ Screening estimate from a state-policy table — verify with the county assessor before closing.
Climate risk First Street
- Flood 8/10 Severe FEMA zone X (shaded) · 99% chance over 30 yrs
- Wildfire 1/10 Low
- Heat 5/10 Major 7 d/yr ≥98°F today · 16 d/yr by 30 yrs out
- Wind 6/10 Major 27% chance of damaging wind over 30 yrs
- Air quality 2/10 Low 2 unhealthy d/yr today · 2 by 30 yrs out
Nearby sold comps map
Loading sold comps map…
Walkable amenities ~0.75 mi
Loading nearby amenities…
Taxation est. · year 1
- Rental income
- $155,112
- − Mortgage interest
- −$84,023
- − Property taxes
- −$7,273
- − Insurance
- −$8,298
- − Repairs & maintenance
- −$12,409
- − Management
- −$12,409
- − Depreciation
- −$43,636
- Taxable loss
- −$12,936
- Est. tax savings @ 24.0%
- +$3,105
- After-tax cash flow
- $15,679/yr
For passive investors: Depreciation is non-cash, so a rental often shows a tax loss while cash-flowing — sheltering income. Rental losses are passive: they offset passive income freely, and up to $25,000/yr can offset ordinary (W-2) income if you actively participate and your MAGI is under $100k (phasing out to $0 by $150k); unused losses carry forward. On sale, claimed depreciation is recaptured at up to 25%, and gains may owe capital-gains tax (a 1031 exchange can defer both). Figures are a year-1 estimate at your 24.0% rate — not tax advice; consult a CPA.
Schools (NCES district)
- District
- Lawrence
- NCES district ID
- 2506660
- Math proficiency
- 10% ▼ -21.00%
- Reading proficiency
- 19% ▼ -11.00%
- Median HH income
- $34,802
- Composite
- 11.87/100
- National rank
- #9672
- State rank
- #300 of 302 in MA
Livability — Lawrence
- Score
- 70/100
- State rank
- #133
- US rank
- #7750
Category grades
Schools grade is shown separately in the Schools card above.
Census & demographics
- Census place
- Lawrence, MA
- City population
- 35,967
- Population (ZIP)
- 52,761
Population outlook (Essex County) Hauer SSP2
- Today (2025)
- 840,920 people
- By 2030
- 872,201 · +3.7%
- By 2040
- 927,918 · +10.3%
- By 2050
- 970,206 · +15.4%
- By 2075
- 1,077,993 · +28.2%
- By 2100
- 1,103,053 · +31.2%
Race, ethnicity, and origin ACS 2023
- Neighborhood character
- Predominantly Hispanic (87%)
- Race & ethnicity
- Hispanic / Latino 87% Two or more races 20% White 10% Black 2%
- Hispanic origin (detail)
- Mexican 1% Puerto Rican 16% Dominican 56%
- Common ancestry
- Lithuanian 2% Romanian 1% Russian 1%
- Foreign-born
- 46% · Canada, Vietnam
- Languages at home
- 19% English-only · Spanish 78% Arabic 1% Other Indo-European 1%
Political lean MEDSL · Essex
- 2024 margin
- Strong D (+20.3) · D 59.2% · R 38.9% · Other 1.9%
- 2008→2024 swing
- 0.0pp no change · 2008: 20.3pp · 2024: 20.3pp
- All cycles
- 2024: D+20.3 2020: D+29.1 2016: D+22.5 2012: D+16.2 2008: D+20.3
Not yet ingested
- Civics
- —
Market trends
- HPI YoY
- ▼ -148.71%
- Current HPI
- 538.2935
- Rent YoY
- —
- Metro
- —
- State GDP YoY
- ▲ 2.28%
- F500 in state
- 38
Industry mix (Fortune 500 HQ in MA)
| Industry | F500 HQs | Revenue |
|---|---|---|
| Technology | 3 | $17B |
|
||
| Insurance | 2 | $84B |
|
||
| Retail | 2 | $76B |
|
||
| Life Sciences | 1 | $43B |
|
||
| Energy Technology | 1 | $31B |
|
||
| Aerospace / Defense | 1 | $18B |
|
||
Price history
+525.0% since first listed15 events — show timeline
- 2026-06-04 Listed $1,500,000 MLS PIN
- 2015-07-17 Sold (MLS) $360,000 MLS PIN
- 2015-06-19 Pending — MLS PIN
- 2015-05-22 Relisted — MLS PIN
- 2015-05-14 Pending — MLS PIN
- 2015-04-08 Price Changed $369,900 MLS PIN
- 2015-02-24 Price Changed $379,900 MLS PIN
- 2015-01-23 Listed $419,900 MLS PIN
- 2013-08-19 Sold (MLS) $357,000 MLS PIN
- 2013-07-10 Contingent — MLS PIN
- 2013-07-08 Listing Removed — MLS PIN
- 2013-06-06 Price Changed $375,000 MLS PIN
- 2013-02-28 Listed $350,000 MLS PIN
- 2005-02-14 Sold (Public Records) $385,000 Public Records
- 2003-01-31 Sold (Public Records) $240,000 Public Records
Property tax history
+4.5%/yrLatest (2023): $7,273 · +6.6% YoY. Source: county tax records.
Cash-flow waterfall
monthlySold comps — $/sqft
last 12 mo · ≤1 miLoading sold comps…