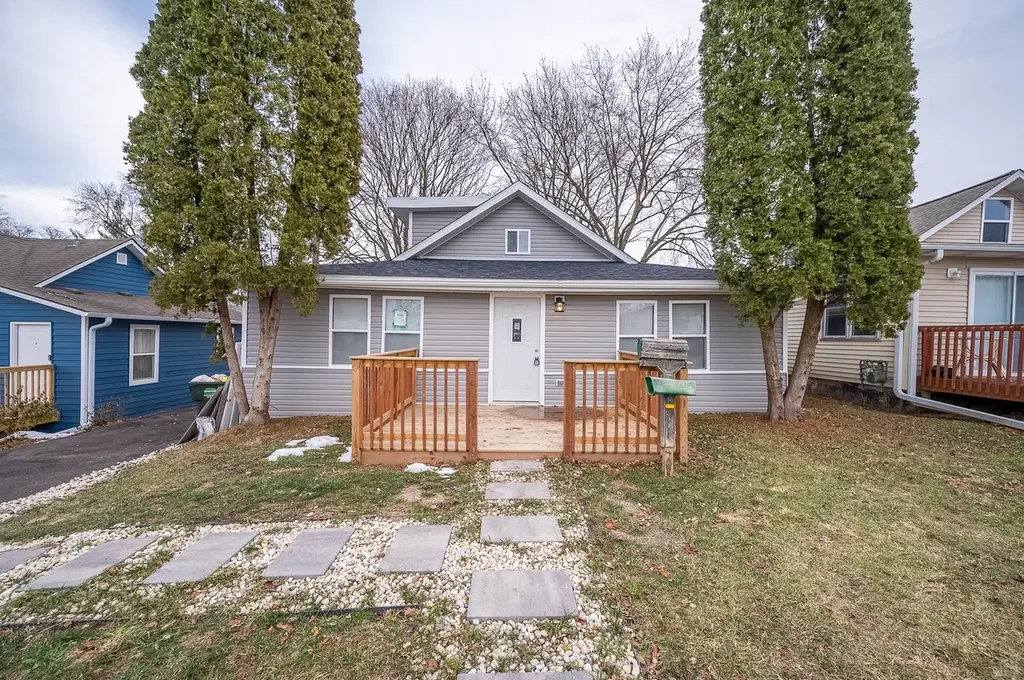
42425 N Park Ln E · Lake Catherine, IL
Flood risk 1/10 · Minimal
- FEMA flood zone
- X (unshaded)
- Chance of flooding over 30 yrs
- 0.0%
- Est. flood insurance / yr
- $507 – $1,088
Fire risk 1/10 · Minimal
- Est. fire insurance / yr
- $804 – $1,492
Heat risk 2/10 · Minimal
- Hot days now (above 100°F)
- 7 days/yr
- Hot days in 30 yrs
- 14 days/yr
Wind risk 2/10 · Minimal
- Chance of severe wind over 30 yrs
- —
Air-quality risk 2/10 · Minimal
- Unhealthy air days now
- 2 days/yr
- Unhealthy air days in 30 yrs
- 2 days/yr
Risk factors via First Street. Map © Google.
Why this score? — see what drove the D grade
The composite is a weighted blend of 9 inputs, each scored 0–100. Each bar is that input's sub-score; the figure is the points it added to the 100-point composite (weight × sub-score).
- Cash flow +13.0/30.0
- ARV discount +9.1/15.0
- DSCR +3.9/10.0
- Schools +3.6/10.0
- 1% rule +3.5/10.0
- Livability +3.4/5.0
- Rent growth +2.5/5.0
- Condition / age +2.5/5.0
- Appreciation +0.0/10.0
$244,900
🖨 Deal sheet 📄 Offer letter ✓ Due diligence
Listing remarks MLS
Your lake-area escape awaits! This beautifully updated 2-bedroom, 1-bath home is fully renovated with new roof, windows, kitchen, bath, flooring, and mechanicals. Features a smart thermostat! Walk to Crandall's Association private beach and park on Lake Catherine and enjoy the best of Antioch living. Move-in ready and easy to love!
Key facts
- Private beach
- Updated home
- Lake catherine
Tags
Neighborhood map
What this means for you Summary
Snapshot
- This is a 2-bed/1.0-bath single-family listed at $245k.
Deal economics
- At list price, monthly cash flow is $-14 ($-167/yr) — negative.
- To cash-flow at today's rent, offer at most $242k (1.0% below list).
- To meet the 1% rule (rent ≥ 1% of price), the offer needs to be $207k (15.4% below list).
- Recommended offer: $207k (15.4% below list) — sets the bar for 1% rule.
Location & tenants
- Location reads 68/100 on livability (#483 in IL) — a middle-class / working-renter tenant base. Strengths: crime A+, housing A+, cost of living A-; Watch: schools C-, amenities F, commute F.
- Chsd 117 (suburban): math 36% / reading 40% proficiency, ranked #135 of 620 in IL (top 22%) — families likely to look elsewhere, expect single-tenant / working-renter base with shorter leases.
- Market conditions: 135 active listings in the ZIP; 4 comparable units currently listed for rent nearby; rentals at typical pace (median 18d on market — plan ~3-4 weeks tenant-placement turnaround); 948 units permitted in Lake County in 2024 (424 in 5+ unit buildings).
Forward outlook
- Local home prices are declining (-3.0%/yr); year-one equity from $2k of loan paydown is wiped out by about $7k of value loss. Plan a longer hold.
- Lake County population projected to shrink 8% by 2050 — rents likely to lag national; underwrite the cash flow, not the appreciation.
Negotiation context
- It's been on market 184 days — a 12% lower offer ($216k) is reasonable based on typical stale-listing flexibility.
- 13 sale attempts since 5y ago with the ask held roughly flat each time — persistent listings suggest the price (not the market) is what's stuck; bring a comps-based counter.
Risks & watch-outs
- Watch-outs: built in 1940 — expect roof / HVAC / electrical / plumbing capex.
Questions for the listing agent
- What do current leases actually rent for vs. the listed asking? Can we see a recent rent roll and the last 12 months of T-12 income?
- It's been on market 184 days. Have you received any prior offers? Is the seller open to a 15% concession, seller financing, or rate buy-down credit?
- Built in 1940 — when were the roof, HVAC, electrical panel, plumbing, and water heater last replaced?
- What does the HOA fee cover, when was the last increase, and are there any pending special assessments or reserve-fund shortfalls?
- Why hasn't it sold? Are there any deal-killer items the seller is aware of (foundation, flood, title, zoning, code violations)?
- Is there a deadline driving the sale (1031 exchange, divorce, estate, relocation)? That informs how much negotiation room exists.
- The area grade is low — what's the realistic commute time and amenity access for the typical tenant pool here? Any planned neighborhood developments (good or bad) we should know about?
- What's the average days-on-market for RENTAL listings here right now (not sales)? A rising rental-DOM trend means longer vacancies and softer asking-rent achievability than the comps imply.
- What's the recent tenant-quality profile in this submarket — average credit score on applications, eviction rate, late-payment / NSF rate, and stable-employment percentage? A property-management company in the area should have these aggregated.
- How much new for-sale + rental construction is in the pipeline within 1–3 miles? Heavy new supply typically softens prices + rents 12–24 months out; constrained supply supports both.
Investment metrics
- 1% rule
- 0.85% ✗
- Cap rate
- 6.22%
- Cash-on-cash
- -0.24%
- DSCR
- 0.99
- GRM
- 9.8
CMA / ARV
- ARV (median comp)
- $254,212
- List price
- $244,900
- Delta
- -3.66%
- Verdict
- FAIR
- Comps
- 20 within 1.0 mi
Show comp detail 9 sales within ~0.75 mi
| Address | Dist | Beds/Ba | Sqft | Sold | Price | $/sf | Match |
|---|---|---|---|---|---|---|---|
| 42380 N Lake Dr | 0.08mi | 3/2.0 (+1) | 1,173 (+2%) | 4mo | $259,900 | $222 | 81 |
| 25091 W Crawford Ave | 0.20mi | 2/1.5 | 1,203 (+4%) | 12mo | $285,000 | $237 | 72 |
| 25087 W Claridan Ave | 0.21mi | 2/1.0 | 1,088 (-6%) | 12mo | $250,000 | $230 | 70 |
| 42220 N 7th Ave | 0.34mi | 3/1.0 (+1) | 1,176 (+2%) | 13mo | $317,000 | $270 | 66 |
| 42184 N 1st Ave | 0.30mi | 3/1.0 (+1) | 1,136 (-2%) | 18mo | $218,000 | $192 | 63 |
| 42211 N 2nd Ave | 0.26mi | 3/1.5 (+1) | 1,261 (+9%) | 12mo | $320,450 | $254 | 55 |
| 25022 W Catherine Ave | 0.30mi | 3/1.5 (+1) | 1,310 (+13%) | 3mo | $236,000 | $180 | 54 |
| 42129 N 1st Ave | 0.37mi | 3/1.0 (+1) | 1,250 (+8%) | 14mo | $203,000 | $162 | 52 |
| 619 Summerlyn Dr | 0.62mi | 3/1.0 (+1) | 1,184 (+2%) | 12mo | $315,000 | $266 | 52 |
Match score weights: distance 35% · size 25% · config 20% · recency 20%. Top-matched comps best support the ARV.
Projected returns pro-forma
-3.0% appreciation · 3.0% rent growth · sell at horizon
- IRR
- -16.7%
- Equity multiple
- 0.41×
- Total profit
- $-40,564
- Equity at exit
- $36,515
- IRR
- -8.5%
- Equity multiple
- 0.47×
- Total profit
- $-36,439
- Equity at exit
- $21,174
Cash invested: $68,572 (down + closing). Projections, not guarantees.
Landlord ↔ Tenant lean methodology
- Overall (STATE)
- 43 Moderately Tenant-Leaning
- State Illinois
- 43 Moderately Tenant-Leaning · D+7
- County
- — inherits STATE
- City
- — inherits STATE
ZIP-level market 60002
- Home prices YoY
- -34.4%
- Active inventory
- 135
- Price-to-rent
- 9.8×
Monthly cashflow live
- Estimated rent
- $2,073 medium interval (Pro) →
- Mortgage (P&I)
- −$1,284
- Tax from tax record
- −$219 /mo · $2,627/yr
- Insurance
- −$102
- HOA
- −$46
- Vacancy / Maint / Mgmt
- −$435
- Net cashflow
- $-14
Break-even live
UW: 25.0% down · 7.5% · 30yr · 1.5% tax · 5.0% vac · 8.0% maint · 8.0% mgmt
Financing live
Cash to close
- Down payment
- $61,225
- Closing costs
- $7,347
- Reserves months
- —
- Total cash needed
- —
Loan-product check · same deal, 3 products live
Conventional
25% down · 7.5% · 30yr
- Down + closing
- —
- Monthly P&I
- —
- Monthly cashflow
- —
- DSCR
- —
- Eligible?
- —
Personal DTI + credit; lowest rate.
DSCR
20% down · 8.5% · 30yr
- Down + closing
- —
- Monthly P&I
- —
- Monthly cashflow
- —
- DSCR
- —
- Eligible?
- —
No personal income docs; deal must DSCR.
Hard money
10% down · 12.0% · 12mo
- Down + closing
- —
- Monthly P&I
- —
- Monthly cashflow
- —
- DSCR
- —
- Eligible?
- —
Short-term bridge; refi at stabilization.
Rent comps 4 comps
| Address | Beds | Baths | Sqft | Rent | $/sqft | DOM | Units | Dist |
|---|---|---|---|---|---|---|---|---|
| 24220 W North Ave Apt 1 Antioch, IL | 3.0 | 1.0 | 1010 | $1,995 | $1.98 | 18d | 1 | 1.04mi |
| 41270 N Bayside Dr Antioch, IL | 3.0 | 1.0 | 1120 | $2,300 | $2.05 | 10d | 1 | 1.17mi |
| 42328 N Oak St Antioch, IL | 2.0 | 1.0 | 772 | $1,950 | $2.53 | 1d | 1 | 1.32mi |
| 42328 N Oak St Antioch, IL | 2.0 | 1.0 | 772 | $1,950 | $2.53 | 20d | 1 | 1.32mi |
HOA detail
- Monthly dues
- $46 · $552/yr
Listing history 50 events
-
2026-06-18days on market $244,900 Active 184 DOM
-
2026-06-17days on market $244,900 Active 183 DOM
-
2026-06-16days on market $244,900 Active 182 DOM
-
2026-06-15days on market $244,900 Active 181 DOM
-
2026-06-13days on market $244,900 Active 179 DOM
-
2026-06-13days on market $244,900 Active 178 DOM
-
2026-06-09days on market $244,900 Active 175 DOM
-
2026-06-08days on market $244,900 Active 174 DOM
-
2026-06-07days on market $244,900 Active 173 DOM
-
2026-06-04days on market $244,900 Active 170 DOM
-
2026-06-03days on market $244,900 Active 169 DOM
-
2026-06-02days on market $244,900 Active 168 DOM
-
2026-06-01days on market $244,900 Active 167 DOM
-
2026-05-31days on market $244,900 Active 166 DOM
-
2026-05-06status Active 333-char remark
Show marketing remark (333 chars)
Your lake-area escape awaits! This beautifully updated 2-bedroom, 1-bath home is fully renovated with new roof, windows, kitchen, bath, flooring, and mechanicals. Features a smart thermostat! Walk to Crandall's Association private beach and park on Lake Catherine and enjoy the best of Antioch living. Move-in ready and easy to love!
-
2026-05-04historical Contingent - Continue to Show 333-char remark
Show marketing remark (333 chars)
Your lake-area escape awaits! This beautifully updated 2-bedroom, 1-bath home is fully renovated with new roof, windows, kitchen, bath, flooring, and mechanicals. Features a smart thermostat! Walk to Crandall's Association private beach and park on Lake Catherine and enjoy the best of Antioch living. Move-in ready and easy to love!
-
2026-04-06status Active 333-char remark
Show marketing remark (333 chars)
Your lake-area escape awaits! This beautifully updated 2-bedroom, 1-bath home is fully renovated with new roof, windows, kitchen, bath, flooring, and mechanicals. Features a smart thermostat! Walk to Crandall's Association private beach and park on Lake Catherine and enjoy the best of Antioch living. Move-in ready and easy to love!
-
2026-03-30historical Contingent - Continue to Show 333-char remark
Show marketing remark (333 chars)
Your lake-area escape awaits! This beautifully updated 2-bedroom, 1-bath home is fully renovated with new roof, windows, kitchen, bath, flooring, and mechanicals. Features a smart thermostat! Walk to Crandall's Association private beach and park on Lake Catherine and enjoy the best of Antioch living. Move-in ready and easy to love!
-
2026-03-24status Active 333-char remark
Show marketing remark (333 chars)
Your lake-area escape awaits! This beautifully updated 2-bedroom, 1-bath home is fully renovated with new roof, windows, kitchen, bath, flooring, and mechanicals. Features a smart thermostat! Walk to Crandall's Association private beach and park on Lake Catherine and enjoy the best of Antioch living. Move-in ready and easy to love!
-
2026-03-18historical Contingent - Continue to Show 333-char remark
Show marketing remark (333 chars)
Your lake-area escape awaits! This beautifully updated 2-bedroom, 1-bath home is fully renovated with new roof, windows, kitchen, bath, flooring, and mechanicals. Features a smart thermostat! Walk to Crandall's Association private beach and park on Lake Catherine and enjoy the best of Antioch living. Move-in ready and easy to love!
-
2026-02-24price $244,900 333-char remark
Show marketing remark (333 chars)
Your lake-area escape awaits! This beautifully updated 2-bedroom, 1-bath home is fully renovated with new roof, windows, kitchen, bath, flooring, and mechanicals. Features a smart thermostat! Walk to Crandall's Association private beach and park on Lake Catherine and enjoy the best of Antioch living. Move-in ready and easy to love!
-
2025-12-16$250,000 Active 333-char remark
Show marketing remark (333 chars)
Your lake-area escape awaits! This beautifully updated 2-bedroom, 1-bath home is fully renovated with new roof, windows, kitchen, bath, flooring, and mechanicals. Features a smart thermostat! Walk to Crandall's Association private beach and park on Lake Catherine and enjoy the best of Antioch living. Move-in ready and easy to love!
-
2025-12-11historical
-
2025-11-11price
-
2025-10-27price
-
2025-10-06price
-
2025-09-22price
-
2025-09-11Active
-
2023-07-28soldstatus $339,000 Closed
-
2023-06-12historical Contingent - Continue to Show
-
2023-05-31status Active
-
2023-05-16historical
-
2023-05-15status Active
-
2023-04-30historical Contingent - Continue to Show
-
2023-04-26$349,000 Active
-
2023-03-06soldstatus $45,000 Closed
-
2023-02-18status Pending
-
2023-02-12status Active
-
2023-02-06status Pending
-
2023-01-23price $49,900
-
2023-01-19status Active
-
2023-01-18status Pending
-
2022-12-18price $58,250
-
2022-11-17$68,250 Active
-
2022-11-01historical Contingent - Continue to Show
-
2022-11-01historical
-
2022-10-20price
-
2022-10-05price
-
2022-09-28Active
-
2021-08-19soldstatus $120,000 Closed
ⓘ Source: listings_history table (triggers on properties + properties_extension) + one-shot
backfill from property_details.listing_events for pre-trigger history.
Tax reassessment forecast IL · Partial reset (capped growth)
- Current annual tax
- $2,627 · $219/mo
- Projected year-2 tax
- $4,093 · $341/mo
- Expected delta
- +$1,466/yr (+$122/mo · 55.8%)
ⓘ Screening estimate from a state-policy table — verify with the county assessor before closing.
Climate risk First Street
- Flood 1/10 Low FEMA zone X (unshaded) · 0% chance over 30 yrs
- Wildfire 1/10 Low
- Heat 2/10 Low 7 d/yr ≥100°F today · 14 d/yr by 30 yrs out
- Wind 2/10 Low
- Air quality 2/10 Low 2 unhealthy d/yr today · 2 by 30 yrs out
Nearby sold comps map
Loading sold comps map…
Walkable amenities ~0.75 mi
Loading nearby amenities…
Taxation est. · year 1
- Rental income
- $24,870
- − Mortgage interest
- −$13,718
- − Property taxes
- −$2,627
- − Insurance
- −$1,224
- − Repairs & maintenance
- −$1,990
- − Management
- −$1,990
- − HOA
- −$552
- − Depreciation
- −$7,124
- Taxable loss
- −$4,355
- Est. tax savings @ 24.0%
- +$1,045
- After-tax cash flow
- $878/yr
For passive investors: Depreciation is non-cash, so a rental often shows a tax loss while cash-flowing — sheltering income. Rental losses are passive: they offset passive income freely, and up to $25,000/yr can offset ordinary (W-2) income if you actively participate and your MAGI is under $100k (phasing out to $0 by $150k); unused losses carry forward. On sale, claimed depreciation is recaptured at up to 25%, and gains may owe capital-gains tax (a 1031 exchange can defer both). Figures are a year-1 estimate at your 24.0% rate — not tax advice; consult a CPA.
Schools (NCES district)
- District
- Chsd 117
- NCES district ID
- 1703870
- Math proficiency
- 36% ▼ -8.00%
- Reading proficiency
- 40% ▼ -4.00%
- Median HH income
- $80,993
- Composite
- 35.79/100
- National rank
- #4836
- State rank
- #135 of 620 in IL
Livability — Lake Catherine
- Score
- 68/100
- State rank
- #483
- US rank
- #10040
Category grades
Schools grade is shown separately in the Schools card above.
Census & demographics
- Census place
- Lake Catherine, IL
- Population (ZIP)
- 24,396
Population outlook (Lake County) Hauer SSP2
- Today (2025)
- 700,217 people
- By 2030
- 693,290 · -1.0%
- By 2040
- 673,588 · -3.8%
- By 2050
- 643,556 · -8.1%
- By 2075
- 562,792 · -19.6%
- By 2100
- 457,715 · -34.6%
Race, ethnicity, and origin ACS 2023
- Neighborhood character
- Predominantly White (82%)
- Race & ethnicity
- White 82% Hispanic / Latino 8% Two or more races 6% Black 3% Asian 3%
- Hispanic origin (detail)
- Mexican 4% Puerto Rican 1%
- Common ancestry
- Romanian 11% Lithuanian 3% Portuguese 2%
- Foreign-born
- 5% · Canada, Jamaica
- Languages at home
- 91% English-only · Spanish 4% Russian/Polish/Slavic 1% Other Indo-European 1%
Political lean MEDSL · Lake
- 2024 margin
- Strong D (+20.8) · D 59.7% · R 38.9% · Other 1.4%
- 2008→2024 swing
- +1.1pp toward D · 2008: 19.6pp · 2024: 20.8pp
- All cycles
- 2024: D+20.8 2020: D+24.1 2016: D+20.3 2012: D+8.1 2008: D+19.6
Not yet ingested
- Civics
- —
Market trends
- HPI YoY
- ▼ -116.22%
- Current HPI
- 221.5754
- Rent YoY
- —
- Metro
- —
- State GDP YoY
- ▲ 1.59%
- F500 in state
- 60
Industry mix (Fortune 500 HQ in IL)
| Industry | F500 HQs | Revenue |
|---|---|---|
| Insurance | 4 | $201B |
|
||
| Consumer Goods | 4 | $87B |
|
||
| Industrial Machinery | 3 | $64B |
|
||
| Healthcare | 2 | $55B |
|
||
| Retail / Pharmacy | 1 | $148B |
|
||
| Agriculture / Food | 1 | $86B |
|
||
Price history
+389.8% since first listed40 events — show timeline
- 2026-05-06 Relisted — MRED as Distributed by MLS Grid
- 2026-05-04 Contingent — MRED as Distributed by MLS Grid
- 2026-04-06 Relisted — MRED as Distributed by MLS Grid
- 2026-03-30 Contingent — MRED as Distributed by MLS Grid
- 2026-03-24 Relisted — MRED as Distributed by MLS Grid
- 2026-03-18 Contingent — MRED as Distributed by MLS Grid
- 2026-02-24 Price Changed $244,900 MRED as Distributed by MLS Grid
- 2025-12-16 Listed $250,000 MRED as Distributed by MLS Grid
- 2025-12-11 Listing Removed — MRED as Distributed by MLS Grid
- 2025-11-11 Price Changed — MRED as Distributed by MLS Grid
- 2025-10-27 Price Changed — MRED as Distributed by MLS Grid
- 2025-10-06 Price Changed — MRED as Distributed by MLS Grid
- 2025-09-22 Price Changed — MRED as Distributed by MLS Grid
- 2025-09-11 Listed — MRED as Distributed by MLS Grid
- 2023-07-28 Sold (MLS) $339,000 MRED as Distributed by MLS Grid
- 2023-06-12 Contingent — MRED as Distributed by MLS Grid
- 2023-05-31 Relisted — MRED as Distributed by MLS Grid
- 2023-05-16 Listing Removed — MRED as Distributed by MLS Grid
- 2023-05-15 Relisted — MRED as Distributed by MLS Grid
- 2023-04-30 Contingent — MRED as Distributed by MLS Grid
- 2023-04-26 Listed $349,000 MRED as Distributed by MLS Grid
- 2023-03-06 Sold (MLS) $45,000 MRED as Distributed by MLS Grid
- 2023-02-18 Pending — MRED as Distributed by MLS Grid
- 2023-02-12 Relisted — MRED as Distributed by MLS Grid
- 2023-02-06 Pending — MRED as Distributed by MLS Grid
- 2023-01-23 Price Changed $49,900 MRED as Distributed by MLS Grid
- 2023-01-19 Relisted — MRED as Distributed by MLS Grid
- 2023-01-18 Pending — MRED as Distributed by MLS Grid
- 2022-12-18 Price Changed $58,250 MRED as Distributed by MLS Grid
- 2022-11-17 Listed $68,250 MRED as Distributed by MLS Grid
- 2022-11-01 Contingent — MRED as Distributed by MLS Grid
- 2022-11-01 Listing Removed — MRED as Distributed by MLS Grid
- 2022-10-20 Price Changed — MRED as Distributed by MLS Grid
- 2022-10-05 Price Changed — MRED as Distributed by MLS Grid
- 2022-09-28 Listed — MRED as Distributed by MLS Grid
- 2021-08-19 Sold (MLS) $120,000 MRED as Distributed by MLS Grid
- 2021-07-17 Pending — MRED as Distributed by MLS Grid
- 2021-07-12 Listed $119,900 MRED as Distributed by MLS Grid
- 1995-07-31 Sold (Public Records) $69,000 Public Records
- 1986-11-01 Sold (Public Records) $50,000 Public Records
Property tax history
+1.7%/yrLatest (2024): $2,627 · +3.6% YoY. Source: county tax records.
Cash-flow waterfall
monthlySold comps — $/sqft
last 12 mo · ≤1 miLoading sold comps…